Mastering Google BigQuery: Top Functions and Techniques for Data Science Success
Google BigQuery is a powerful tool for data analysts and data scientists, allowing you to perform complex data operations with ease. In this blog, we will dive into some of the essential functions and techniques you can use to optimize your BigQuery experience, including date diff bigquery, bigquery timezones, bigquery left join, and more. Moreover, we'll introduce you to RATH, a powerful open-source alternative to traditional data analysis and visualization tools.
5 Big Query Tips You Must Know
Date Diff BigQuery and Timezones
Handling dates and times in BigQuery is a common task, especially when calculating the difference between two dates. To do this, you can use the date diff bigquery function. This function takes three arguments: the first date, the second date, and the unit of time you want to measure the difference in (e.g., DAY, HOUR, MINUTE, etc.).
Additionally, working with bigquery timezones is essential for many data projects. You can easily convert between different time zones using the DATETIME or TIMESTAMP functions. For example, to convert a TIMESTAMP to a specific time zone, use the TIMESTAMP function with the desired time zone as an argument.
BigQuery Joins: Left Join, Outer Join, and Cross Join
Joining tables in BigQuery is an essential technique for combining data from different sources. There are several types of joins available in BigQuery, including bigquery left join, bigquery outer join, and bigquery cross join.
A bigquery left join returns all rows from the left table and the matched rows from the right table, with NULL values if there is no match. An bigquery outer join returns all rows from both tables, with NULL values in the columns where there is no match. Finally, a bigquery cross join returns the Cartesian product of both tables, where each row in the first table is paired with each row in the second table.
Count, Case Statement, and Aggregate Functions
Aggregating data is another crucial aspect of data analysis. The bigquery count function is used to count the number of rows in a table or the number of non-NULL values in a specific column. Alongside count, other aggregate functions such as percentile bigquery, bigquery average, and bigquery rank can be used to summarize data effectively.
The bigquery case statement is a conditional expression that allows you to perform different calculations based on specific conditions. This is particularly useful when you want to categorize or segment your data based on certain criteria.
Converting String to Date and Working with Arrays
Sometimes, you may need to convert a string to a date format in BigQuery. To do this, you can use the bigquery convert string to date function, which takes a string and a date format as arguments and returns a date value.
Working with arrays in BigQuery is also a common task. The platform offers various bigquery array functions that make it easy to manipulate and process arrays. For example, you can use the ARRAY_LENGTH function to find the length of an array, or the ARRAY_CONCAT function to concatenate two arrays. To convert an array to a string, use the bigquery array to string function, which takes an array and a delimiter as arguments and returns a string representation of the array.
Bigquery Data, Database, and GCP Integration
BigQuery data is stored in tables within datasets, which are containers for related tables. You can manage your bigquery database using the Google Cloud Console or the command-line interface (CLI). By leveraging BigQuery, you can effectively analyze vast amounts of data in real-time, making it an ideal choice for data scientists looking to extract insights from their data.
Being a part of the Google Cloud Platform (GCP), bigquery gcp integration allows you to seamlessly interact with other GCP services. For instance, you can import data from Google Cloud Storage or Google Sheets, and export data to various formats like CSV, JSON, or Avro.
Automate Your BigQuery Data Visualization and Exploration
For data scientists who wish to take their skills to the next level, visualize and explore their data with an auto-eda tool, RATH (opens in a new tab) offers a powerful open-source alternative to traditional data analysis and visualization tools. RATH uses an Augmented Analytics engine for discovering patterns, insights, and causals, and it can auto-generate multi-dimensional data visualizations.
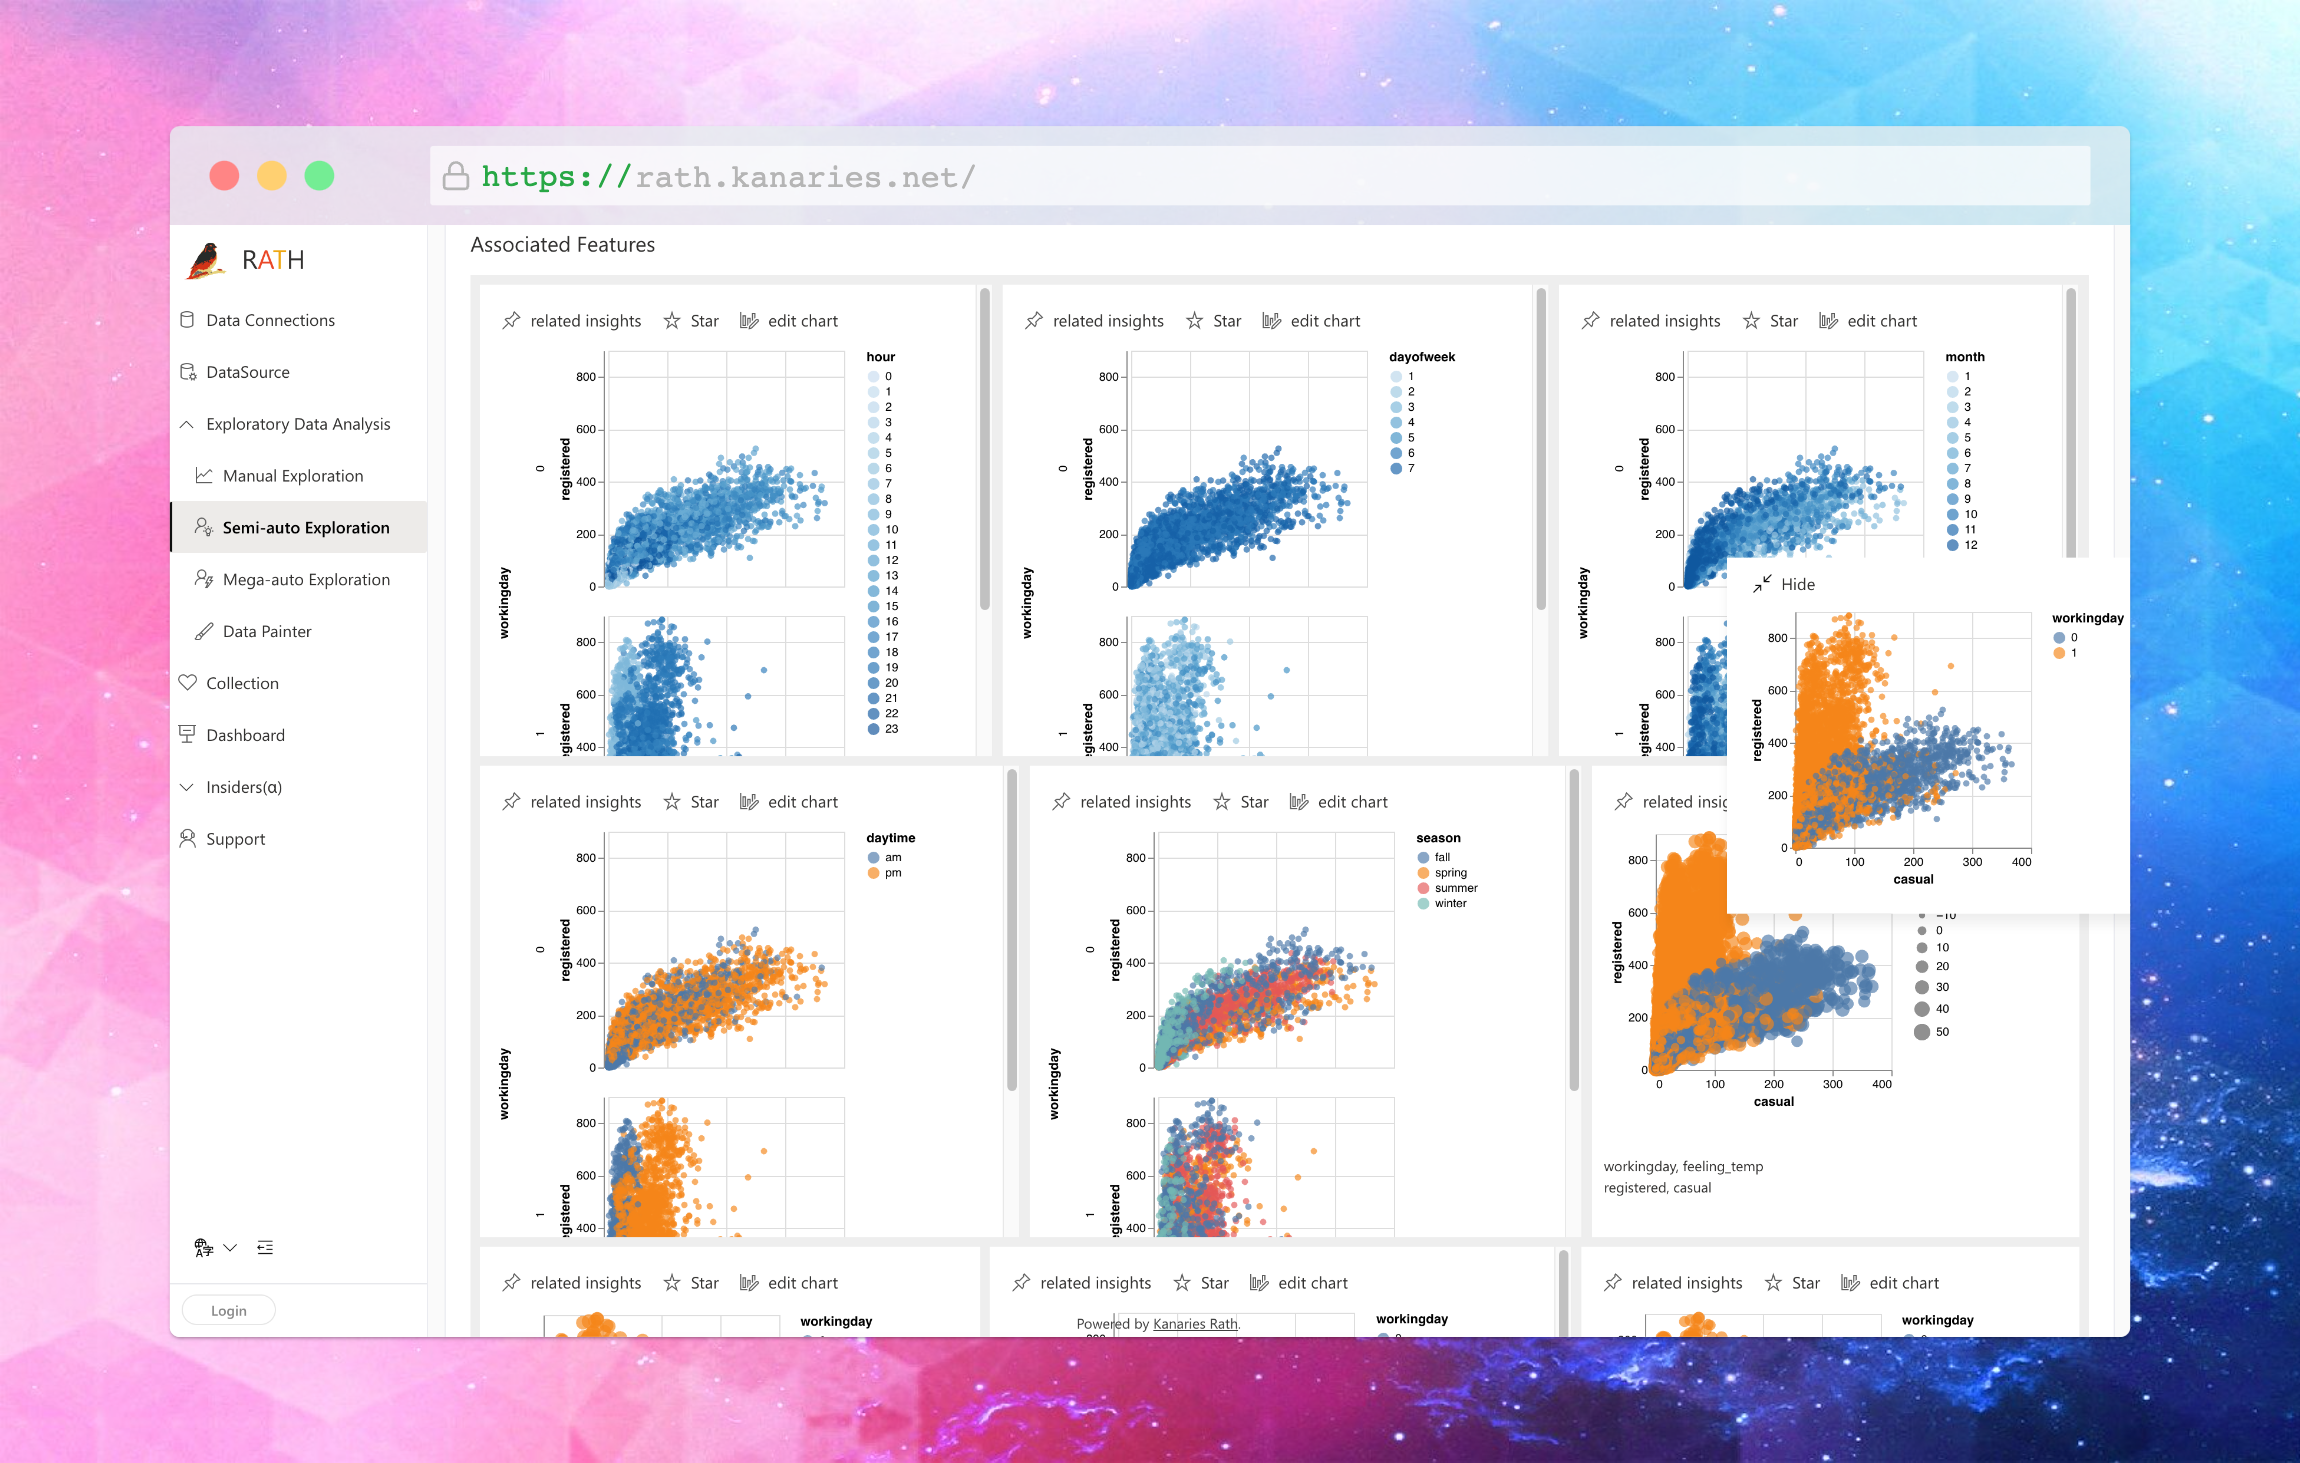
With RATH, you can prepare your data, transform it, and extract text patterns. You can also generate automated insights and explore data in Copilot Mode, which allows you to easily navigate your data and make sense of complex relationships.
In addition to the powerful analytics capabilities, RATH enables you to create data visualizations and perform causal analysis. By utilizing RATH, you can efficiently uncover hidden insights and unlock the full potential of your data.

Learning Resources and Community Support
When diving into BigQuery, RATH, or any other data analysis tool, it's essential to have access to learning resources and a supportive community. Consider exploring the RATH GitHub (opens in a new tab) repository and joining the Discord Community (opens in a new tab) to stay up-to-date with the latest developments, share your knowledge, and learn from others.
Additionally, you might find value in exploring other data analysis tools and platforms like Trifacta, Ponder.io, lux-org, and hex.tech. These tools can help you broaden your skills and gain a deeper understanding of the data science landscape.
Wrapping Up
Mastering BigQuery and its essential functions, such as date diff bigquery, bigquery timezones, bigquery left join, and bigquery count, can significantly enhance your data science capabilities. Moreover, exploring alternatives like RATH can empower you with automated data analysis and visualization, ultimately enabling you to unlock the full potential of your data.
Stay curious, keep learning, and harness the power of data analysis and data science tools to drive your projects forward. Happy analyzing!