Mastering Outlier Detection: A Comprehensive Guide for Data Analysts

Outliers are data points that differ significantly from the rest of the data, often hurting the accuracy of your analysis. Identifying and handling outliers is a crucial step in any data analysis workflow. In this article, we'll explore how to identify outliers in R and a visual, intuitive tool that can identify your outlier with one simple click: RATH
Best Way to Detect Outlier: Using RATH
By using Kanaries RATH (opens in a new tab), you can easily detect your outliers without coding knowledge. Follow the steps down below:
Step 1. Launch RATH at RATH Online Demo (opens in a new tab). On the Data Connections page, choose the Files Option and upload your Excel or CSV data file.
Tips: If you want to import data from an online database such as ClickHouse, BigQuery or SQL, choose the Database option and connect RATH to your data.
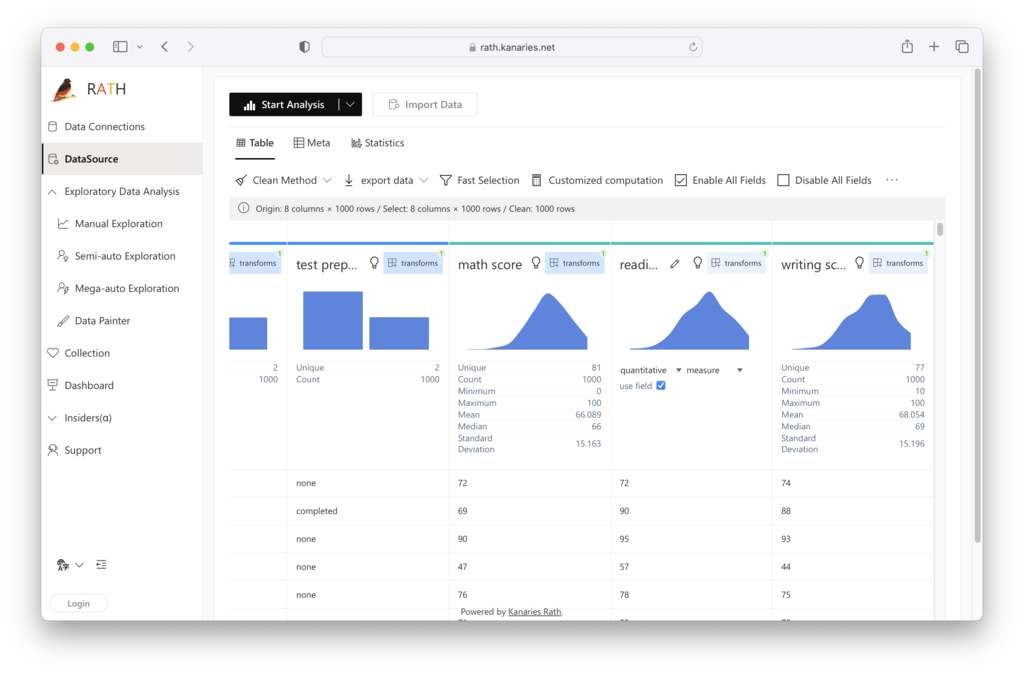
Step 2. On the Data Source tab, you are granted a general overview of your data.
 RATH can automatically detect which one of the variables could be the Outlier and suggest using the Isolation Forest algorithm for re-grouping.
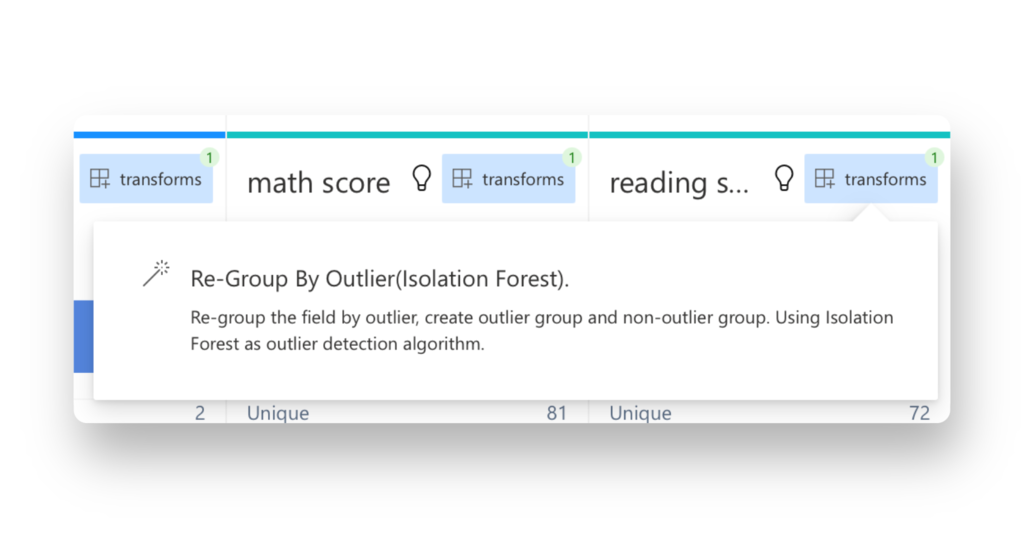
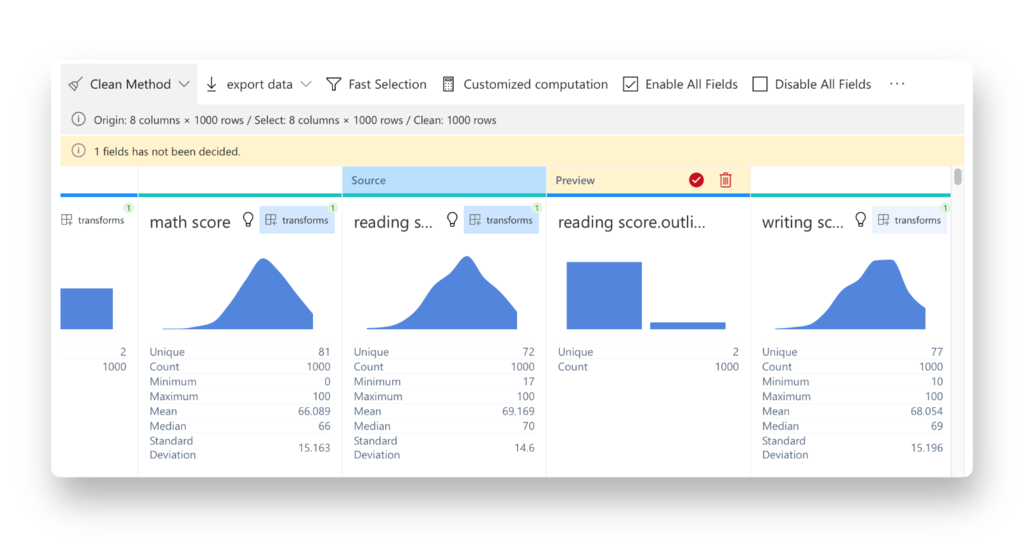
Click on the option to apply the Isolation Forest algorithm to the Outlier:
RATH makes the process of outlier detection extremely easy and simple. Beyond that, RATH is also an advanced Data Analysis Automation Tool that simplifies the process of finding patterns and causal inferences in your data. With its tableau-alternative drag-and-drop interface, you can create multi-dimensional data visualizations without any coding knowledge, and receive automated insights with an advanced Augmented Analytics Engine.
To get started with RATH, visit its GitHub repository (opens in a new tab) and follow try the Online Demo (opens in a new tab):

Outlier Detection Techniques in R
Identifying Outliers with Box Plots
A box plot is a simple yet powerful tool for visualizing the distribution of data and identifying outliers. In R, you can create a box plot using the following code:
boxplot(dataset$column_name, main="Box Plot", xlab="Column Name", ylab="Values")Replace the dataset with your dataset's name and column_name with the specific column you want to analyze. The box plot will display the interquartile range (IQR), median, and potential outliers in the data. Outliers are generally plotted as individual points beyond the whiskers of the box plot.
Z-Score Method
The Z-score method is a statistical technique that measures how far a data point is from the mean of a distribution, expressed in terms of standard deviations. In R, you can calculate the Z-score and identify outliers using the following code:
z_scores <- scale(dataset$column_name)
outliers <- which(abs(z_scores) > 2.5)
The threshold of 2.5 is arbitrary and can be adjusted depending on your specific needs. Data points with a Z-score greater than 2.5 or less than -2.5 are considered outliers.
Tukey's Fences
Tukey's fences is a robust method for detecting outliers based on the IQR. It uses the following formula to define the lower and upper boundaries for outliers:
- Lower boundary: Q1 - 1.5 × IQR
- Upper boundary: Q3 + 1.5 × IQR In R, you can apply Tukey's fences with the following code:
iqr <- IQR(dataset$column_name)
q1 <- quantile(dataset$column_name, 0.25)
q3 <- quantile(dataset$column_name, 0.75)
lower_boundary <- q1 - 1.5 * iqr
upper_boundary <- q3 + 1.5 * iqr
outliers <- dataset$column_name[dataset$column_name < lower_boundary | dataset$column_name > upper_boundary]
Handling Outliers in R
Once you have identified outliers, you can either remove or transform them depending on your analysis goals.
Removing Outliers
To remove outliers from your dataset, use the following code:
clean_data <- dataset[!(dataset$column_name %in% outliers), ]This code creates a new dataset called clean_data without the identified outliers. It's important to note that removing outliers may cause the mean of your dataset to change. Depending on the distribution of your data, the mean can be highly sensitive to outliers, and removing them can result in a more accurate representation of the central tendency of the data.
Transforming Outliers
Instead of removing outliers, you can transform them to reduce their impact on your analysis. Common transformation techniques include:
- Winsorization: Replacing the extreme values with the nearest non-outlying data points.
- Log transformation: Applying a logarithmic transformation to the data, can help reduce the impact of extreme values. In R, you can apply Winsorization using the winsorize function from the DescTools package:
library(DescTools)
winsorized_data <- Winsorize(dataset$column_name, probs = c(0.01, 0.99))
To apply a log transformation, use the following code:
log_transformed_data <- log(dataset$column_name)Keep in mind that log transformation requires all data points to be positive. If your data contains negative values, you may need to add a constant to the data before applying the transformation.
Impact of Outliers on Statistical Measures and Models
Outliers can have a significant impact on various statistical measures and models:
- Mean: As mentioned earlier, the mean is sensitive to outliers, and its value can change significantly when outliers are removed.
- Median: The median is more resistant to outliers, as it represents the middle value of the data.
- Standard deviation: Standard deviation is sensitive to outliers, as it measures the dispersion of the data points around the mean.
- Correlation: Outliers can affect the correlation between variables, potentially leading to spurious or misleading relationships.
- Random Forest: Random Forest models are generally less affected by outliers, as they rely on decision trees, which are more robust to extreme values.
- Scatter plots: Outliers can be easily identified in scatter plots, as they typically appear as isolated points far from the main cluster of data.
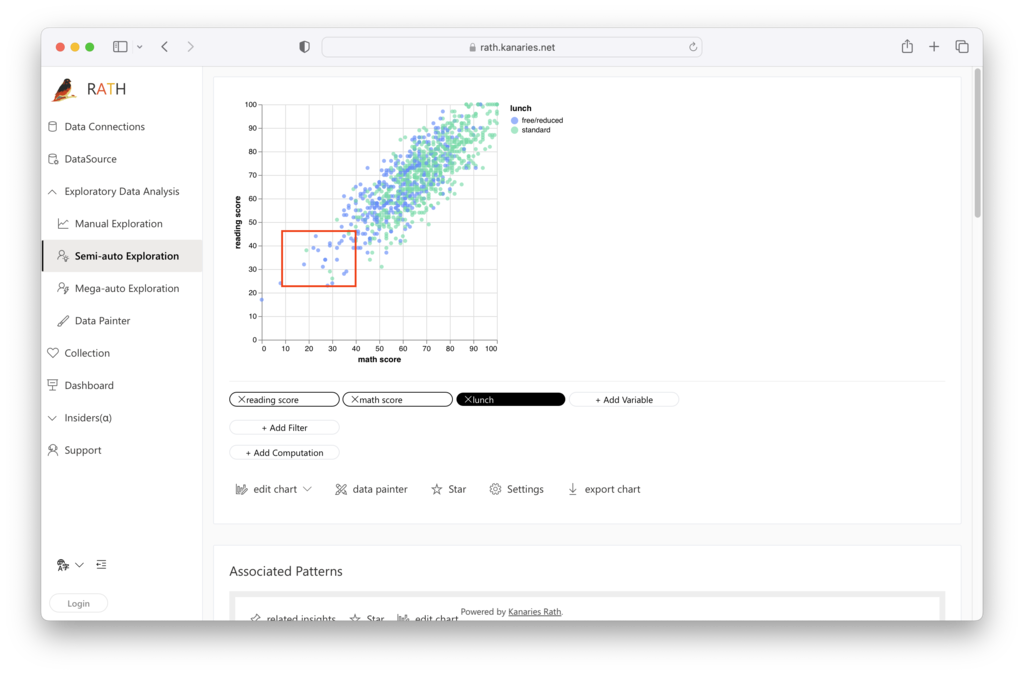
Visualizing Outliers with RATH
RATH's powerful visualization capabilities allow you to create insightful plots to identify and analyze outliers. By leveraging RATH's advanced Data Visualization capacities, you can automatically create scatter plots, box plots, and other visualizations to explore the impact of outliers on your data.
To further enhance your analytical skills, consider using RATH's Augmented Analytics Engine to streamline your exploratory data analysis workflow and discover patterns and causal inferences within your data.
Conclusion
Outlier detection is a critical step in the data analysis process. In this comprehensive guide, we explored various techniques to identify and handle outliers in R using RATH, a powerful tool for automated data analysis and visualization. By mastering these methods, you can ensure your data analysis results are accurate and reliable. So, start exploring your data with RATH today and take your data analysis skills to the next level!