Top 10 Python Libraries for Automated Data Analysis
Introduction
Automated data analysis is becoming increasingly important in today's data-driven world. With the amount of data being generated every day, manually analyzing and processing large data sets can be time-consuming and error-prone. Fortunately, Python offers a wide range of libraries that can automate data analysis tasks, making it easier to work with large data sets and extract meaningful insights.
In this article, we will explore 10 Python libraries that can be used to automate data analysis. These libraries are Pandas, NumPy, Matplotlib, Seaborn, Scikit-learn, TensorFlow, Keras, NLTK, and any other relevant libraries you want to include.
Part 1. Next Generation Automated Data Analysis: RATH
RATH (opens in a new tab) is beyond an open-source alternative to Data Analysis and Visualization tools such as Tableau. It automates your Exploratory Data Analysis workflow with an Augmented Analytic engine by discovering patterns, insights, causals and presents those insights with powerful auto-generated multi-dimensional data visualization.
| Feature | Description | Preview |
|---|---|---|
| AutoEda | Augmented analytic engine for discovering patterns, insights, and causals. A fully-automated way to explore your data set and visualize your data with one click. |  |
| Data Visualization | Create Multi-dimensional data visualization based on the effectiveness score. | 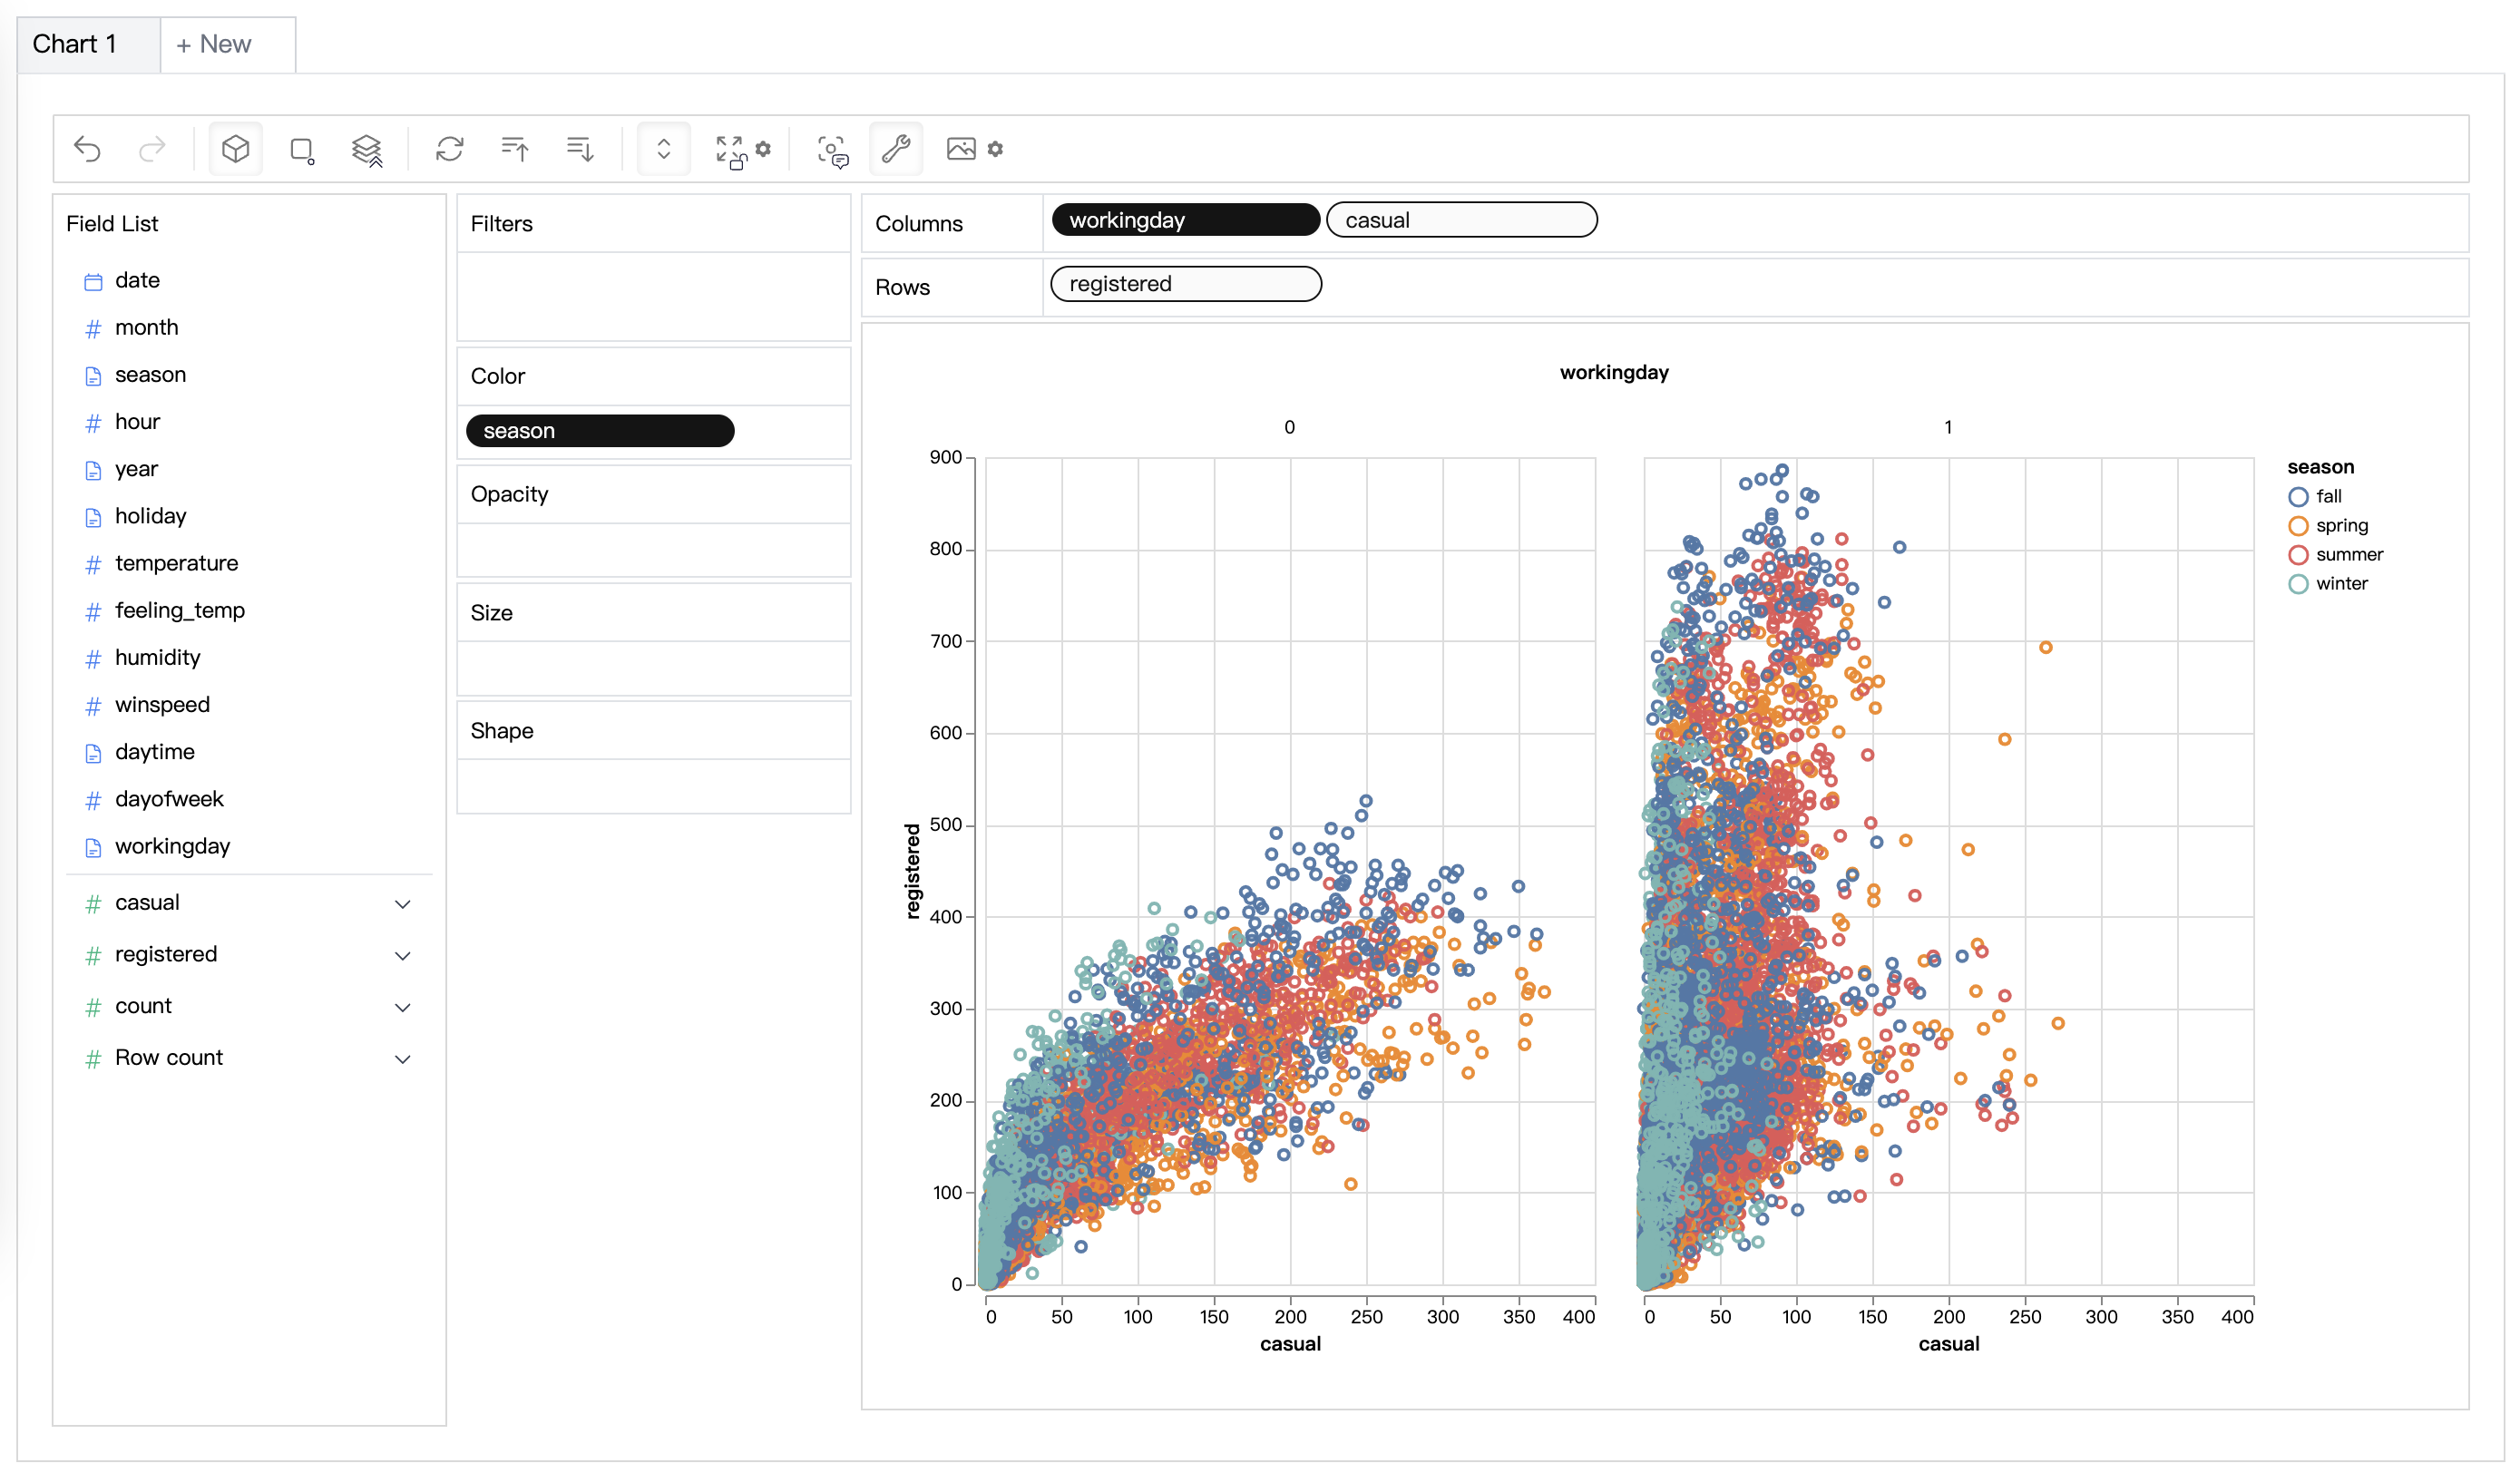 |
| Data Wrangler | Automated data wrangler for generating a summary of the data and data transformation. |  |
| Data Exploration Copilot | Combines automated data exploration and manual exploration. RATH will work as your copilot in data science, learn your interests and uses augmented analytics engine to generate relevant recommendations for you. |  |
| Data Painter | An interactive, instinctive yet powerful tool for exploratory data analysis by directly coloring your data, with further analytical features. |  |
| Dashboard | Build a beautiful interactive data dashboard (including an automated dashboard designer which can provide suggestions to your dashboard). |  |
| Causal Analysis | Provide causal discovery and explanations for complex relation analysis. | 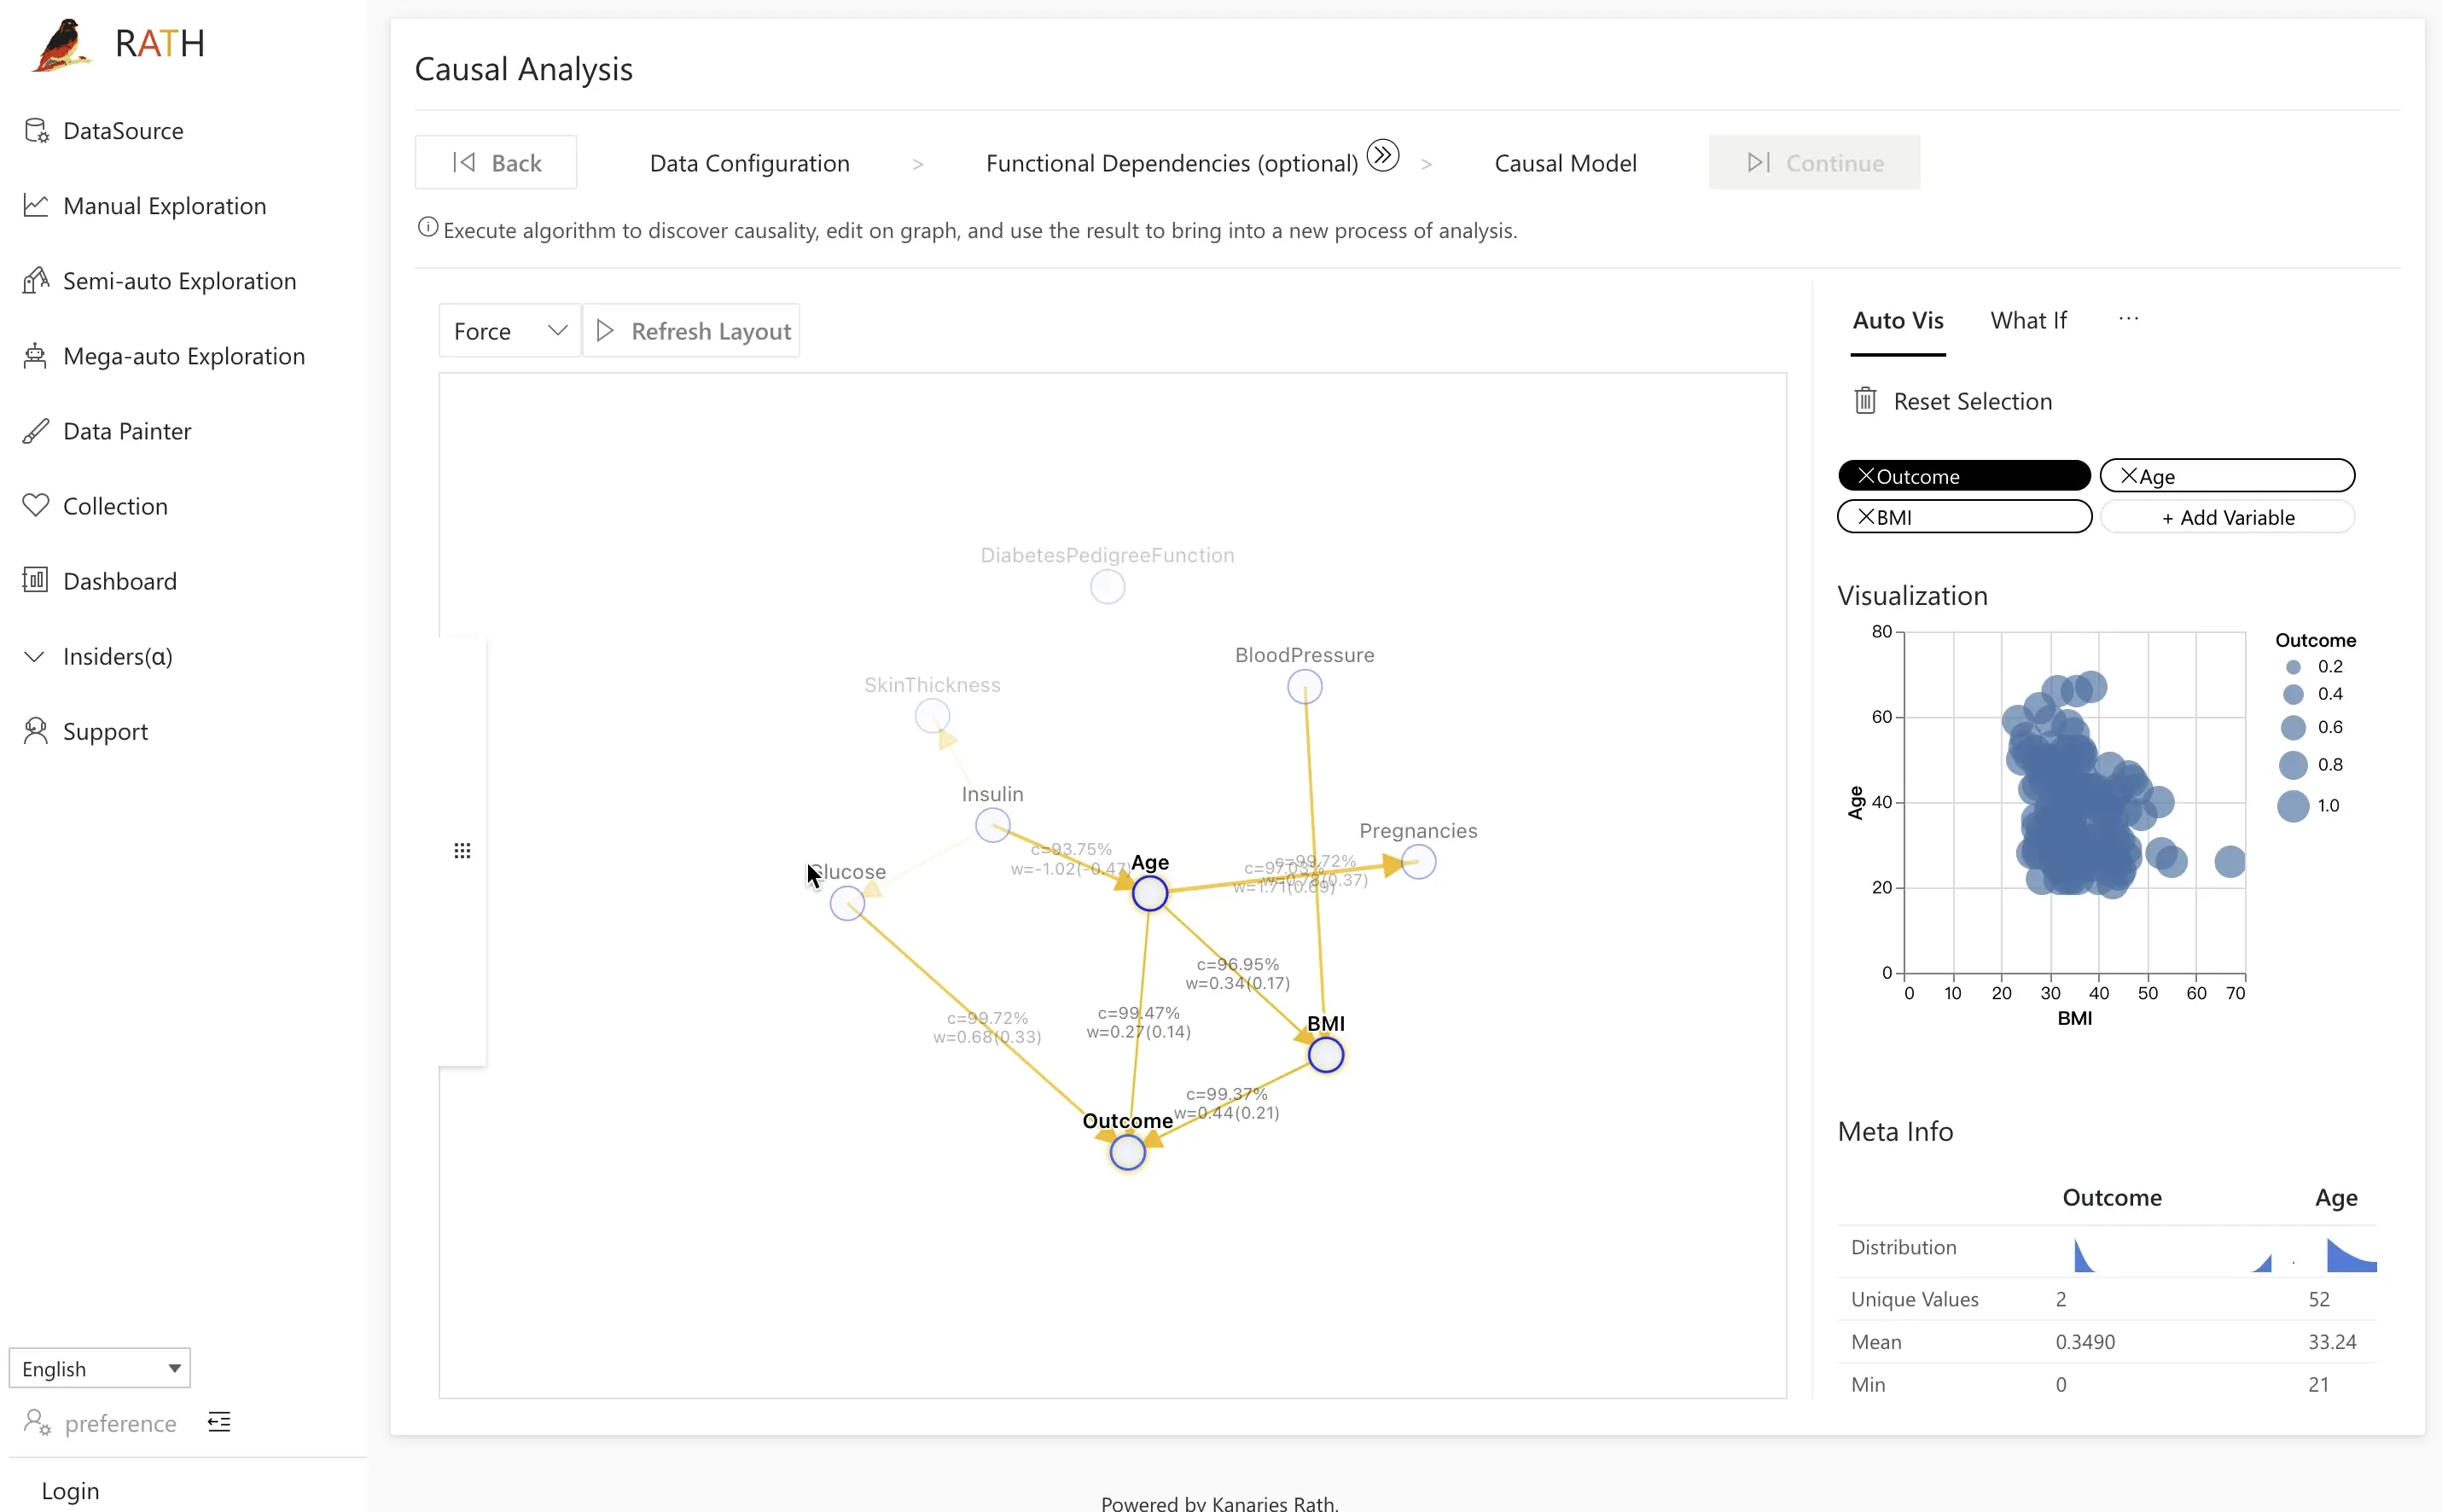 |
RATH supports a wide range of data sources. Here are some of the major database solutions that you can connect to RATH: MySQL, ClickHouse, Amazon Athena, Amazon Redshift, Apache Spark SQL, Apache Doris, Apache Hive, Apache Impala, Apache Kylin, Oracle, and PostgreSQL.
RATH (opens in a new tab) is Open Source. Visit RATH GitHub and experience the next-generation Auto-EDA tool. You can also check out the RATH Online Demo as your Data Analysis Playground!

Part 2. Top Python Automated Data Analysis Library
- Pandas
Pandas is one of the most popular libraries for data analysis in Python. It provides powerful data structures and data manipulation tools that make it easy to handle large amounts of data. With Pandas, you can easily load, clean, and prepare data for further analysis. It also allows you to perform data manipulation tasks such as filtering, grouping, and joining data.
Here's an example of how you can use Pandas to load data into a DataFrame and handle missing values:
import pandas as pd

# load data into a DataFrame
df = pd.read_csv('data.csv')

# handle missing values
df.fillna(0, inplace=True)2.NumPy
NumPy is a powerful library for numerical computations and data manipulation. It provides a wide range of mathematical functions and allows you to perform operations on arrays of data. With NumPy, you can easily calculate statistics such as the mean, standard deviation, and correlation of data.
Here's an example of how you can use NumPy to calculate the mean and standard deviation of an array of data:
import numpy as np

data = [1, 2, 3, 4, 5]

# calculate the mean
mean = np.mean(data)
print(mean) # 3.0

# calculate the standard deviation
std = np.std(data)
print(std) # 1.5811388300841898- Matplotlib
Matplotlib is a plotting library in Python that allows you to create static, animated, and interactive visualizations. It is a powerful tool for data visualization and can be used to create a wide range of plots such as line plots, scatter plots, and histograms.
Here's an example of how you can use Matplotlib to create a simple line plot:
import matplotlib.pyplot as plt

x = [1, 2, 3, 4, 5]
y = [2, 4, 6, 8, 10]

plt.plot(x, y)
plt.xlabel('x-axis')
plt.ylabel('y-axis')
plt.title('Line Plot')
plt.show()- Seaborn
Seaborn is a library built on top of Matplotlib that allows you to create more advanced visualizations. It has built-in support for data visualization with Pandas and can be used to create heatmaps, box plots, and violin plots.
Here's an example of how you can use Seaborn to create a heatmap:
import seaborn as sns

data = [[1, 2, 3], [4, 5, 6], [7, 8, 9]]

sns.heatmap(data)
plt.title('Heatmap')
plt.show()- Scikit-learn
Scikit-learn is a powerful library for machine learning in Python. It provides a wide range of algorithms for classification, regression, clustering, and more. It is also compatible with other libraries such as NumPy and Pandas, making it easy to integrate with your data analysis workflow.
Here's an example of how you can use scikit-learn to build a linear regression model:
from sklearn.linear_model import LinearRegression

x = [[1], [2], [3], [4], [5]]
y = [2, 4, 6, 8, 10]

model = LinearRegression()
model.fit(x, y)

print(model.coef_) # [2.0]
print(model.intercept_) # 0.0- TensorFlow
TensorFlow is a powerful library for deep learning in Python. It allows you to build, train, and deploy machine learning models, particularly deep learning models. With TensorFlow, you can easily build neural networks and perform tasks such as image classification and natural language processing.
Here's an example of how you can use TensorFlow to build a simple feedforward neural network:
import tensorflow as tf

model = tf.keras.Sequential()
model.add(tf.keras.layers.Dense(10, input_dim=8, activation='relu'))
model.add(tf.keras.layers.Dense(1, activation='linear'))
model.compile(loss='mean_squared_error', optimizer='adam')- Keras
Keras is a high-level neural networks API written in Python. It is a user-friendly API that allows you to build, train, and test neural network models easily. It is built on top of TensorFlow and can be used to build complex neural networks with minimal code.
Here's an example of how you can use Keras to build a simple feedforward neural network:
from keras.models import Sequential
from keras.layers import Dense

model = Sequential()
model.add(Dense(10, input_dim=8, activation='relu'))
model.add(Dense(1, activation='linear'))
model.compile(loss='mean_squared_error', optimizer='adam')- NLTK
NLTK (Natural Language Toolkit) is a library in Python that provides tools for natural language processing (NLP). It can be used to perform tasks such as tokenization, stemming, and part-of-speech tagging. With NLTK, you can easily analyze and understand text data.
Here's an example of how you can use NLTK to tokenize a sentence:
import nltk

sentence = "This is a sample sentence."

tokens = nltk.word_tokenize(sentence)
print(tokens) # ['This', 'is', 'a', 'sample', 'sentence', '.']- Scipy
SciPy is a library in python that builds on top of NumPy and provides a wide range of mathematical and scientific functions. It can be used for optimization, integration, interpolation, signal and image processing, and more. It is a powerful library for scientific computing and data analysis.
Here's an example of how you can use Scipy to perform optimization:
from scipy.optimize import minimize

def function(x):
    return x[0]**2 + x[1]**2

x0 = [2, -1]

res = minimize(function, x0)

print(res)- Statsmodels
Statsmodels is a library in Python that provides classes and functions for the estimation of many different statistical models. It also provides a variety of statistical tests and data exploration tools. It is compatible with NumPy and Pandas, making it easy to integrate with your data analysis workflow.
Here's an example of how you can use Statsmodels to perform linear regression:
import statsmodels.api as sm

X = [[1, 2], [3, 4], [5, 6], [7, 8]]
y = [2, 4, 6, 8]

X = sm.add_constant(X)

model = sm.OLS(y, X)
results = model.fit()

print(results.summary())
Conclusion
In conclusion, these are just a few examples of the many libraries available in Python that can be used to automate data analysis tasks. With these libraries, you can easily work with large data sets, perform data cleaning and preparation, extract meaningful insights, and create visualizations. For people who prefer a more modernized interface and much more advanced features such as causal analysis, data exploration copilot, etc., RATH is the ultimate tool to assist you.