Bar Chart Maker: Easily Create Bar Charts with VizGPT
Ready to start creating your own Bar Chart with VizGPT? Try this Prompt:
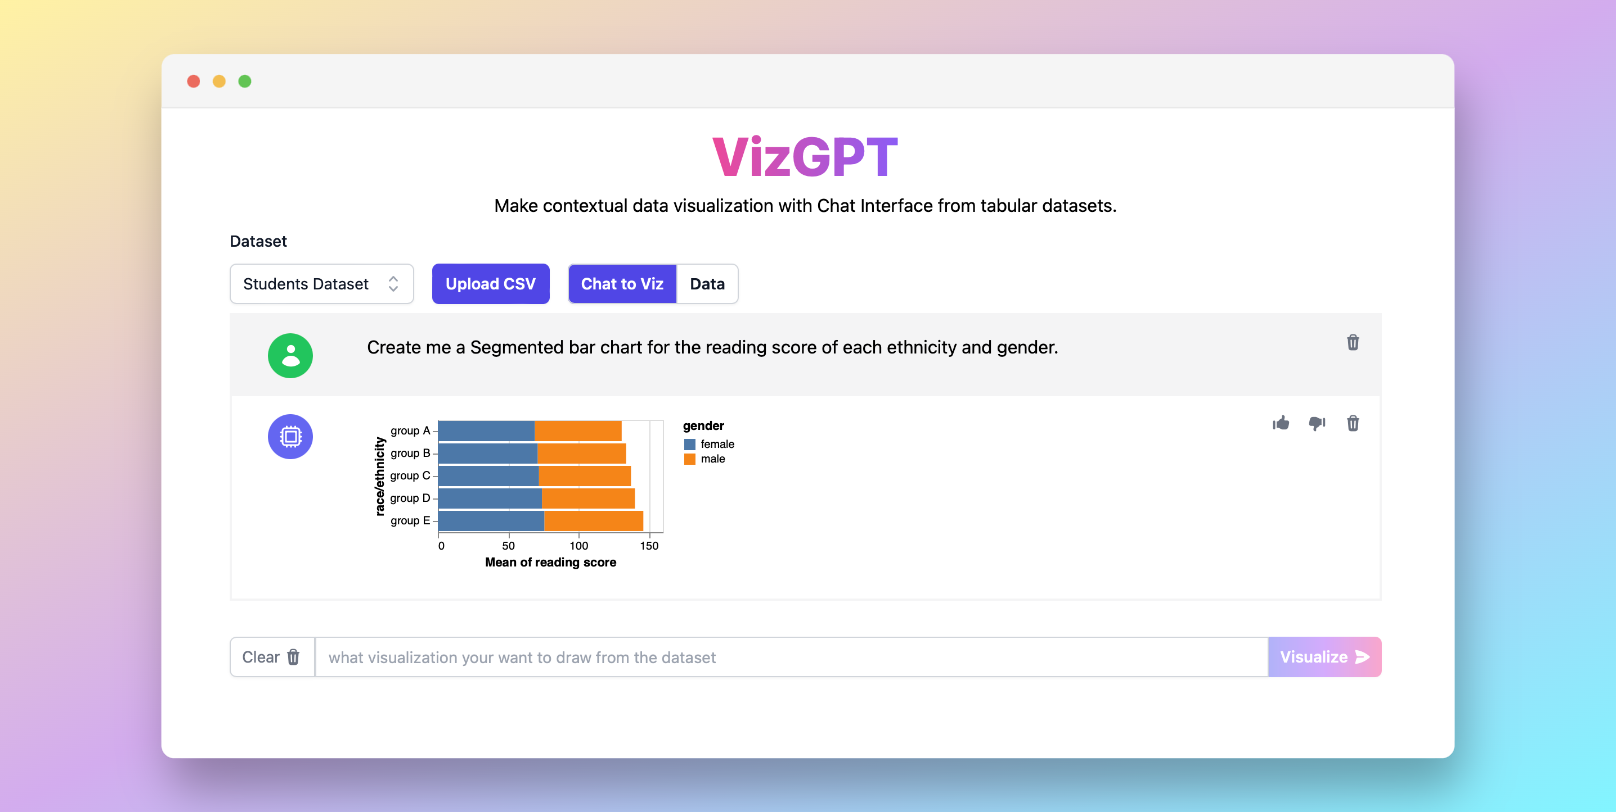
Create a Bar Chart from the data set
Want to Upload a Customized CSV File? Upgrade to Kanaries Plus Plan, you can get the full package of apps (opens in a new tab) for handling much more complicated data analysis!

Introduction to Bar Chart Makers
Need an easy-to-use online bar chart maker? VizGPT is a ChatGPT-powered tool that can transform your data into a visually pleasing bar chart with our intuitive Bar Chart Maker. Whether it's a simple bar chart, a segmented bar chart, a grouped bar chart, or a stacked bar chart, our tool lets you turn your data into understandable visuals in no time.
Bar Chart Maker: What it is?
Bar charts are a powerful tool in data visualization, helping to compare data across different categories. Each type of bar chart – from the conventional bar chart to the horizontal bar graph or the column chart – serves a unique purpose, allowing you to tailor your visuals to your data's needs.
Using a Bar Chart Maker
Creating a bar chart has never been easier. With our Bar Chart Maker, upload your data, select your preferred bar chart type, and hit visualize. You'll end up with a bar chart, grouped bar chart, or stacked bar chart that brings your data to life.
More Advanced Bar Chart Maker
Want to add more complexity? Choose a stacked bar chart or a grouped bar chart. These charts help you visualize multiple data series on your bar chart, offering deeper insight into relationships within your data.
If you're keen on exploring beyond bar charts, our tool also offers other types of charts. Be it histograms, scatter diagrams, or Bar Chart, you have a variety of tools to help you present your data in the most suitable way.
Conclusion
A good Chart Maker doesn't have to be complex. With VizGPT, you can ask questions to your data and easily create clear, informative bar charts, grouped bar charts, and stacked bar charts. Start creating charts today and unlock your data's potential.