Pie Chart Maker: Easily Create Beautiful Charts for Free
Ready to start creating your own pie charts with VizGPT?
How to Make a Pie Chart with VizGPT
Step 1. Click on the  button and upload data.
Step 2. Enter a prompt in the text box to create a pie chart:
Create a pie chart from the data set
Step 3. Press this button:  to create a pie chart!
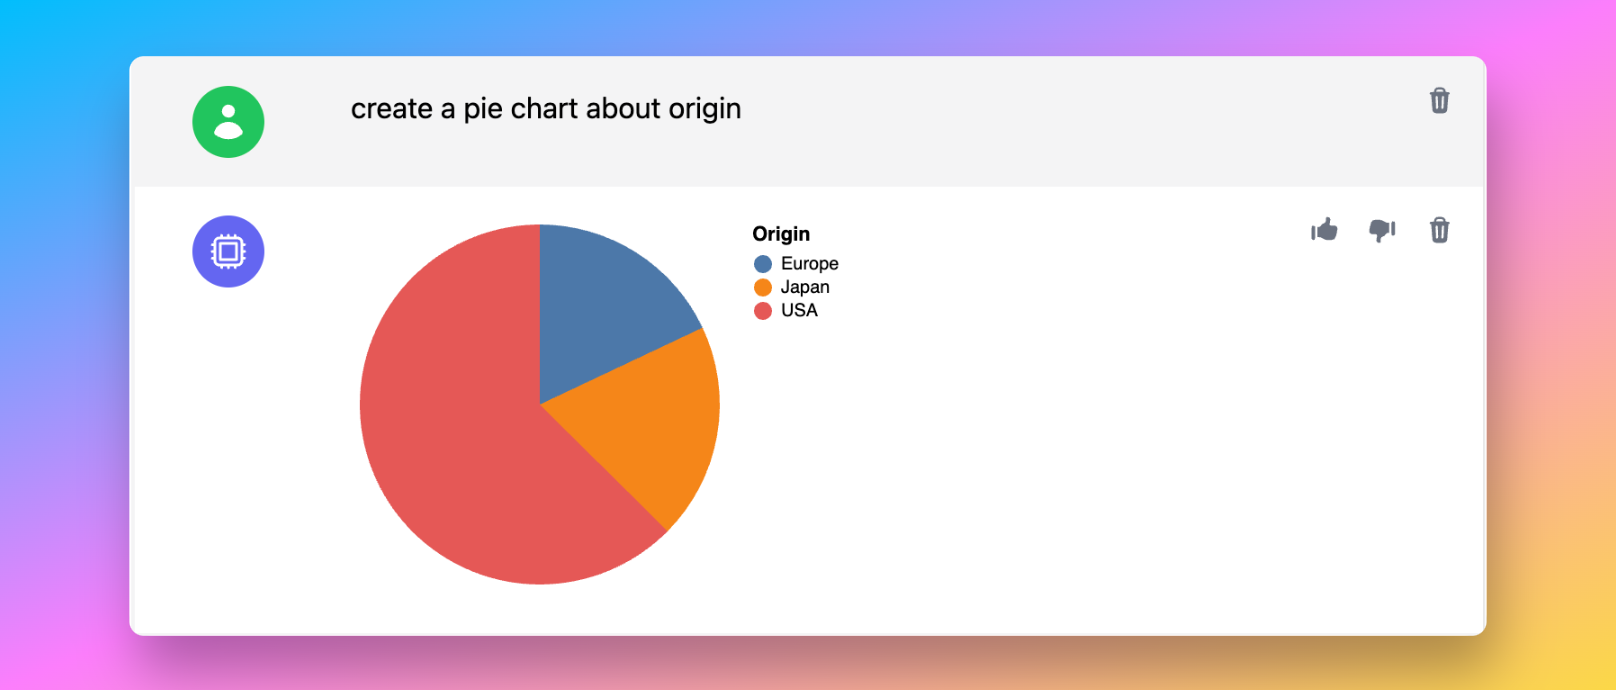
Step 4. Modify the prompt with your own variable. For example, you want to create a pie chart displaying the origin of the cars:
Create a pie chart about car origin
What is VizGPT?
VizGPT, an AI-powered tool that can help you create stunning visualizations with ease. Whether you're a data visualization beginner or a seasoned pro.
- Use ChatGPT to create all types of charts from any CSV file.
- Modify the chart by simply asking another question.
Don't forget to check out other charts that you can create with VizGPT!
| Pie Chart | Scatter Plot | Bar Chart | Area Chart | Box Plot | Bubble Chart | Heatmap | Histogram | Line Chart |
Tired of complex UI or coding to create charts? Start charting with VizGPT (opens in a new tab) today!

Introduction to Pie Chart Makers
In the realm of data visualization, pie charts hold a special place. They are simple, yet powerful tools that can represent complex data in an easily digestible format. Whether you're a small business owner tracking demographic data, a social media analyst monitoring engagement, or a student working on academic research, a pie chart maker can be an invaluable tool.
In this article, we will explore the world of pie chart makers, discussing their benefits, how to use them, and some of the best options available online. We will also answer some frequently asked questions about pie chart makers. So, let's dive in and start charting!

What is a Pie Chart Maker?
A pie chart maker is a tool that allows you to create pie charts, which are circular diagrams that represent data. Each 'slice' of the pie represents a category of data, and the size of each slice is relative to its portion of the whole. Pie chart makers are designed to make this process simple and intuitive, even for those without a background in design or data analysis.
Pie chart makers come with a variety of features, such as customizable color palettes, easy data input methods, and export capabilities to formats like PNG, JPG, PDF, and even MP4 video. Some pie chart makers also offer collaborative features, allowing teams to work together on the same chart.
Benefits of Using a Pie Chart Maker
Using a pie chart maker comes with several benefits:
-
Simplicity: Pie chart makers are designed to be user-friendly. You don't need to be a design expert or a data scientist to create a pie chart. With a few clicks, you can input your data, adjust the colors and labels, and have a finished pie chart ready to go.
-
Customizability: With a pie chart maker, you have control over the look of your chart. You can adjust the colors, fonts, and size of your chart to fit your needs and aesthetic preferences.
-
Collaboration: Many pie chart makers allow for real-time collaboration. This means you can invite your team to work on the chart together, making adjustments and additions as necessary.
-
Export Capabilities: Once your pie chart is complete, you can easily export it in a variety of formats. This makes it easy to share your chart on social media, embed it in a presentation, or include it in a report.

How to Use a Pie Chart Maker
Using a pie chart maker is a straightforward process. Here's a simple step-by-step guide:
-
Choose a Template: Most pie chart makers offer a variety of templates. Choose one that fits your needs and aesthetic preferences.
-
Input Your Data: Once you've chosen a template, it's time to input your data. This is usually as simple as clicking on the chart and typing in your data.
-
Customize Your Chart: After your data is inputted, you can customize your chart. Adjust the colors, fonts, and size to fit your needs.
-
Export Your Chart: Once you're happy with your chart, you can export it in a variety of formats.
Detailed Features of Popular Pie Chart Makers
Let's delve deeper into the features of the pie chart makers we've mentioned. Understanding these features will help you choose the right tool for your needs.
Canva
Canva's pie chart maker is known for its user-friendly interface and a wide variety of templates. Here are some of its key features:
-
Easy to Use: Canva's drag-and-drop tools make it easy to create a pie chart, even for non-designers. You can start with a template and simply click to change the data and the labels.
-
Collaboration: Canva allows you to invite your team and control who can change what, making it easy to collaborate on your pie chart design.
-
Customizable: You can adjust the colors, fonts, and background of your pie chart to get the look you want.
-
Export Options: You can download your pie chart in high-resolution files, save it as a PNG, JPG, or GIF image, PDF document, or MP4 video, and share it on any online platform.
Adobe Express
Adobe Express is another great tool for creating pie charts. Here are its key features:
-
Simplicity: Adobe Express makes it easy to create a pie chart with a few simple steps. You can adapt a pie chart template and enter your collected data to create a beautiful chart.
-
Customizability: Adobe Express allows you to customize your pie chart with different colors and styles.
-
Export Options: With Adobe Express, you can download your pie chart as a JPEG, PNG, or PDF file, share it on your social media, or email it directly to someone.
RapidTables
RapidTables offers a straightforward and easy-to-use pie chart maker. Here are its key features:
-
Simplicity: RapidTables allows you to enter any number of slices with a space delimiter. It's as simple as entering your data and pressing the draw button.
-
Customizability: RapidTables offers a variety of customization options, allowing you to create a pie chart that fits your needs.
Meta-Chart
Meta-Chart allows you to create pie charts with ease. Here are its key features:
-
Simplicity: With Meta-Chart, you can easily input your data and customize your chart.
-
Collaboration: Meta-Chart allows you to save and store your charts for future use and editing, making it a great tool for collaborative projects.
-
Customizability: Meta-Chart offers a variety of customization options, allowing you to create a pie chart that fits your needs.

How to Choose the Right Pie Chart Maker
Choosing the right pie chart maker depends on your specific needs and preferences. Here are a few things to consider:
-
Ease of Use: If you're new to data visualization, you might want to choose a pie chart maker that's easy to use.
-
Customizability: If you want to be able to customize your pie chart, look for a tool that offers a variety of customization options.
-
Collaboration Features: If you're working with a team, you might want to choose a pie chart maker that allows for real-time collaboration.
-
Export Options: Consider what export options you need. Do you need to be able to download your pie chart as a high-resolution file, or do you need to be able to share it on social media?
Remember, the best pie chart maker is the one that fits your needs and helps you visualize your data in the most effective way.
Conclusion
Pie chart makers are powerful tools that can help you visualize complex data in a simple and intuitive way. Whether you're a small business owner, a social media analyst, or a student, a pie chart maker can
help you visualize complex data in a simple and intuitive way. Whether you're a small business owner, a social media analyst, or a student, a pie chart maker can be an invaluable tool. They offer a simple and easy-to-understand picture, representing data visually as a fractional part of a whole, which can be an effective communication tool even for an uninformed audience. It enables the audience to see a data comparison at a glance to make an immediate analysis or to understand information quickly.
Remember, the best pie chart maker is the one that fits your needs and helps you visualize your data in the most effective way. So, start exploring these tools and create stunning pie charts that can help you make sense of your data.
Don't forget to check out other charts that you can create with VizGPT!
| Pie Chart | Scatter Plot | Bar Chart | Area Chart | Box Plot | Bubble Chart | Heatmap | Histogram | Line Chart |
FAQs
What are some free pie chart makers available online?
There are several free pie chart makers available online. Some of the most popular ones include Canva, Adobe Express, RapidTables, and Meta-Chart. These tools offer a variety of features and are designed to be user-friendly, making it easy for anyone to create a pie chart.
Can I export my finished pie chart to different formats?
Yes, most pie chart makers allow you to export your finished pie chart in different formats. This can include PNG, JPG, PDF, and even MP4 video. The export options will depend on the specific pie chart maker you are using.
Are there any pie chart makers that allow for collaboration?
Yes, some pie chart makers allow for collaboration. For example, Canva allows you to invite your team and control who can change what, making it easy to collaborate on your pie chart design.