Scatter Plot Maker: Discover Data Relationships with VizGPT
Ready to start creating your own Scatter Plots with VizGPT? Try this Prompt:
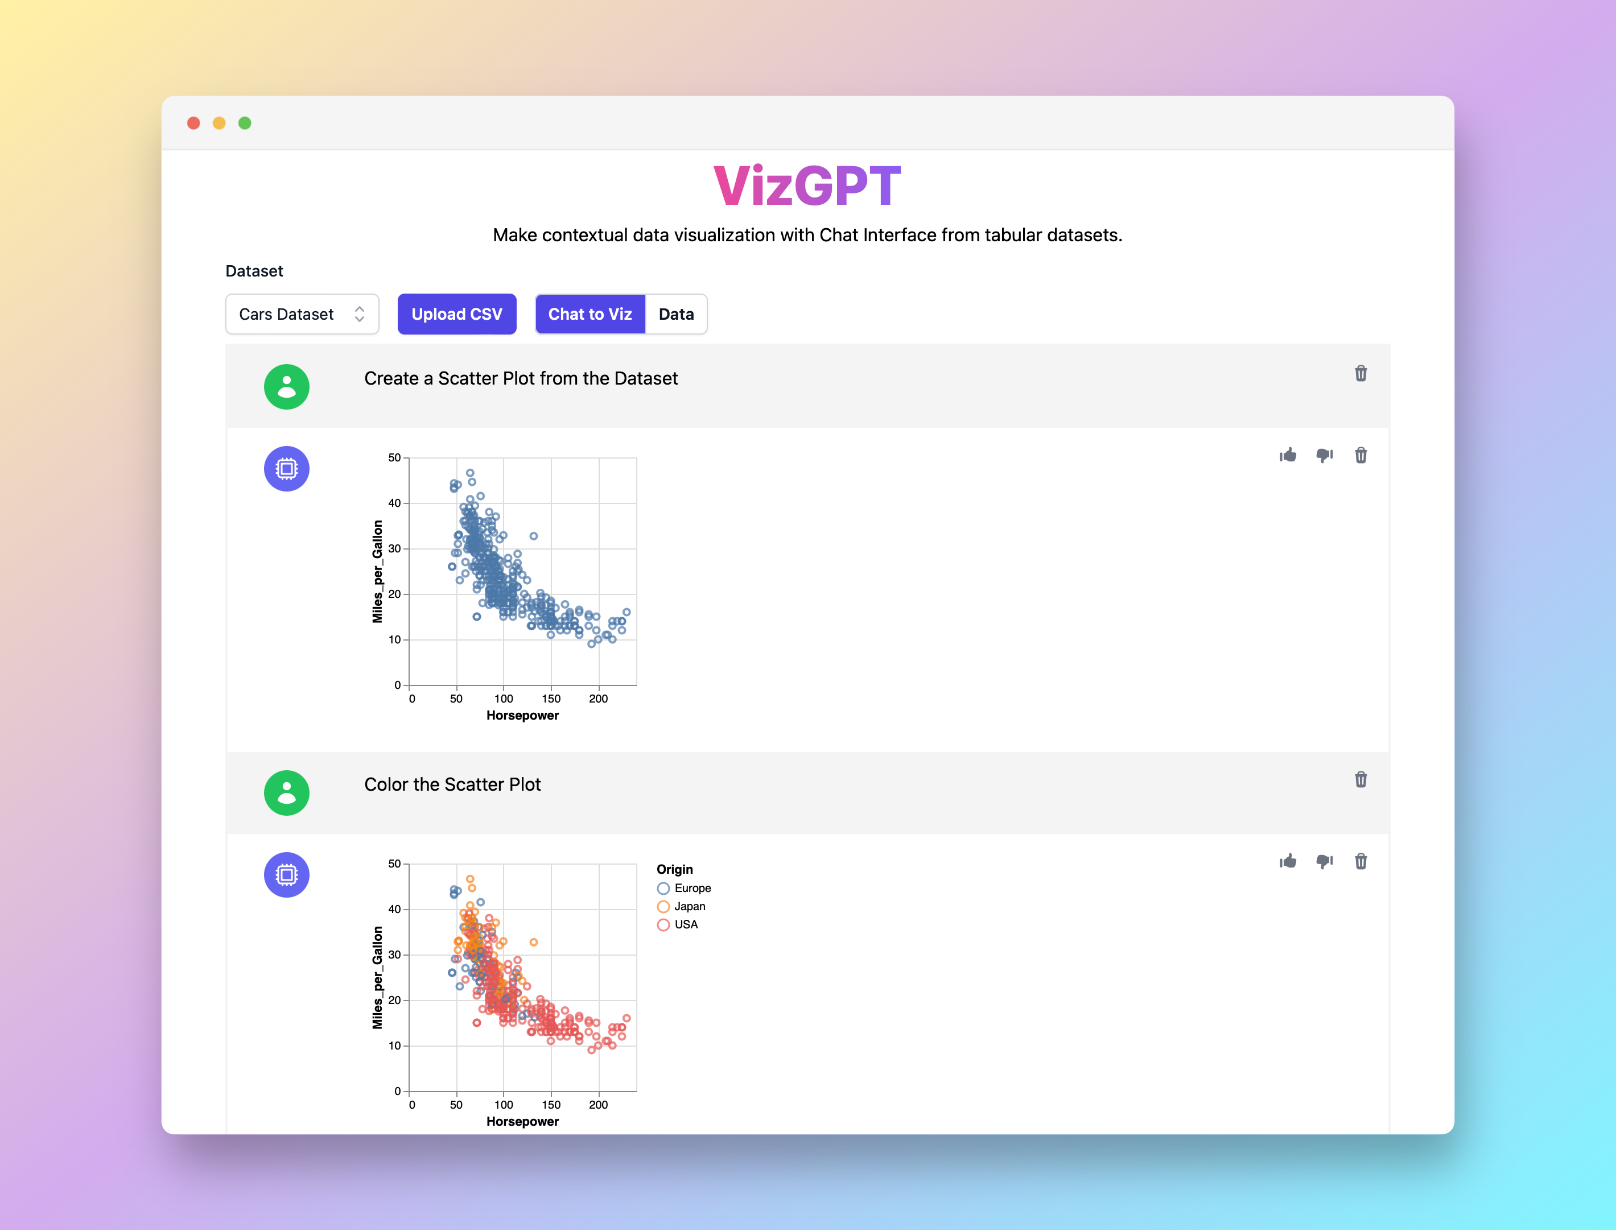
Create a Scatter Plot from the data
Want to Upload a Customized CSV File? Upgrade to Kanaries Plus Plan, you can get the full package of apps (opens in a new tab) for handling much more complicated data analysis!

Introduction
Welcome to our all-inclusive guide on Scatter Plot Maker, part of the VizGPT suite. With this tool, creating scatter diagrams and plots has never been easier. Whether you're working with linear scatter plots, scatter graphs, or scattergraphs, VizGPT provides a simple yet powerful solution. Dive into the relationships found in scatter plots and learn how to interpret various types of scatter plots for your data analysis and visualization needs.
Unpacking Scatter Plots
Scatter diagrams are versatile charts that allow you to understand the relationships between different variables in your data set. Whether you're exploring scatter plot relationships, identifying patterns, or spotting outliers, scatter plots offer a visual representation that makes interpretation intuitive and effective.
Crafting Your Scatter Plot
With our Scatter Plot Maker, creating a scatter plot or linear scatter plot is straightforward. Upload your data, ask VizGPT to form a scatter plot, and hit visualize. You'll have a clear, informative scattergraph ready to provide insights into your data.
Broadening Your Data Visualization Toolkit
While scatter plots are a powerful tool, our VizGPT platform also supports a broad range of other chart types, including bar charts, histograms, and area charts. Explore the best fit for your data visualization needs.
Make Data Interpretation a Breeze with Scatter Plots
Understanding the relationships in scatter plots shouldn't be complicated. With our Scatter Plot Maker, you can create dynamic scatter diagrams and scatter graphs effortlessly. Start your data visualization journey today and unlock the potential of your data with VizGPT.