Explore Data with Data Painter
Data Painter is a creative yet powerful feature of RATH (opens in a new tab). You can easily clean data, model data, and explore data using a Painting Tool, which turns the complex Exploratory Data Analysis process visual and simple.
Data painter is especially good at explaining complex visual patterns which can be difficult to describe by simple statistics indicators. The following video explains how to use Data Painter in detailed steps:
Prerequisites
The following data visualization from the "College" dataset shows the relationship between AverageFacultySalary and AverageCost. We want to study why the data is not evenly distributed, but rather split into two parts.
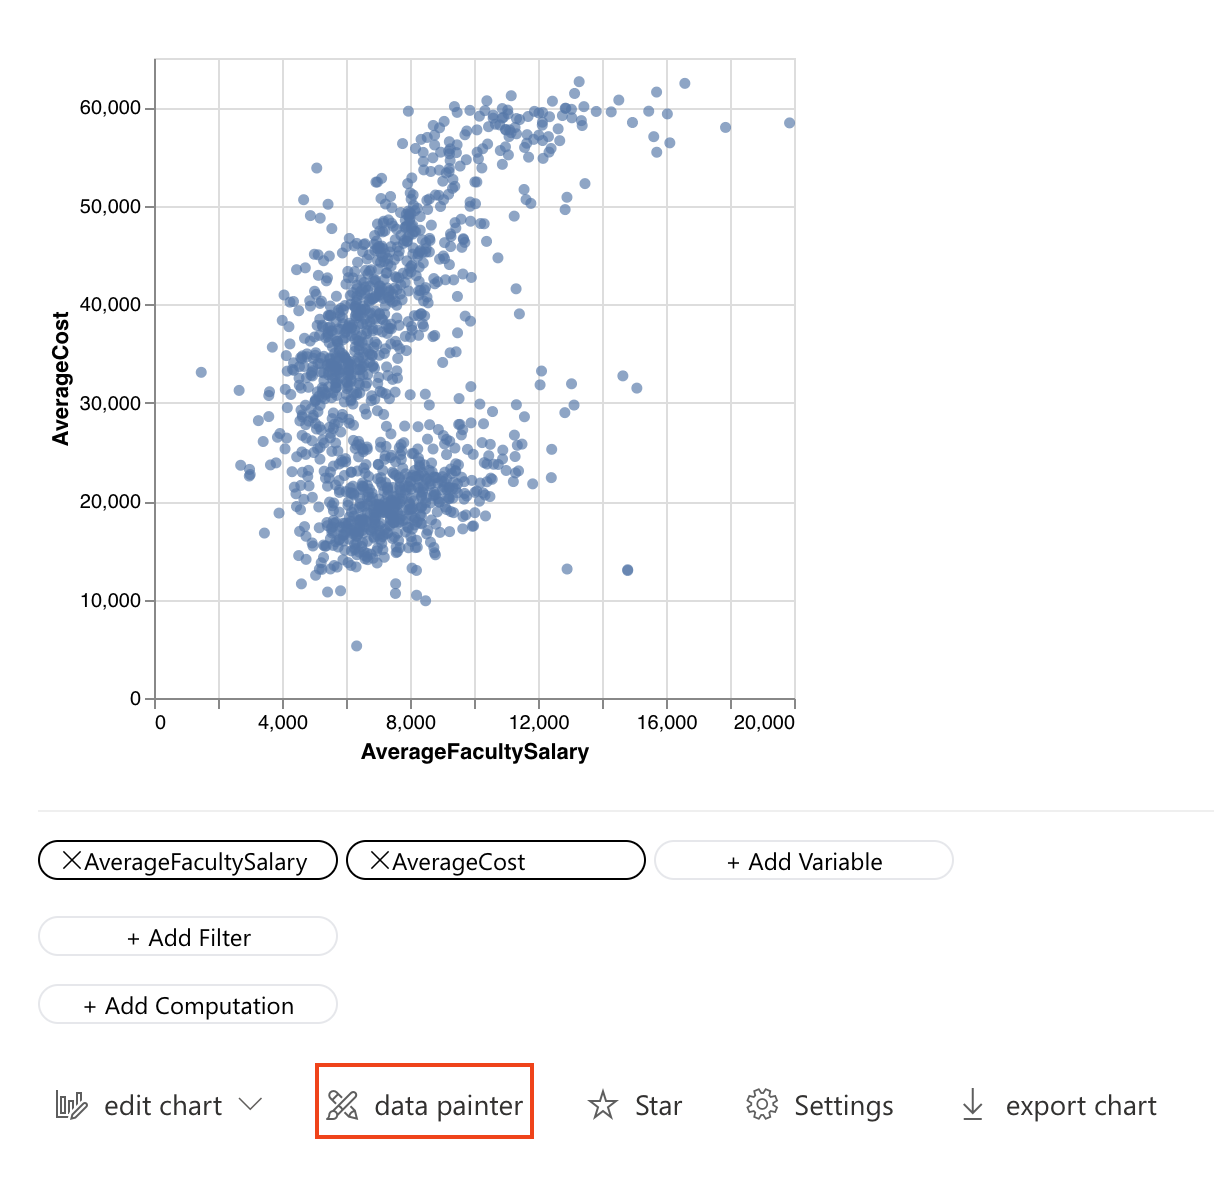
Click on the Data Painter button to explore this chart.
Explore data
Case 1.
On the Data Painter tab, we can paint the dots which represent the data we want to explore with your mouse cursor.
Click on the Search button to automatically analyze your data painting. RATH can automatically detect your intent and recommends a data visualization for a possible explanation.
The auto-generated result explains why the data is distributed unevenly: it was caused by the FundingModel variable. The blue dots on top of the chart are private schools, while the red dots on the lower side of the chart are public schools.
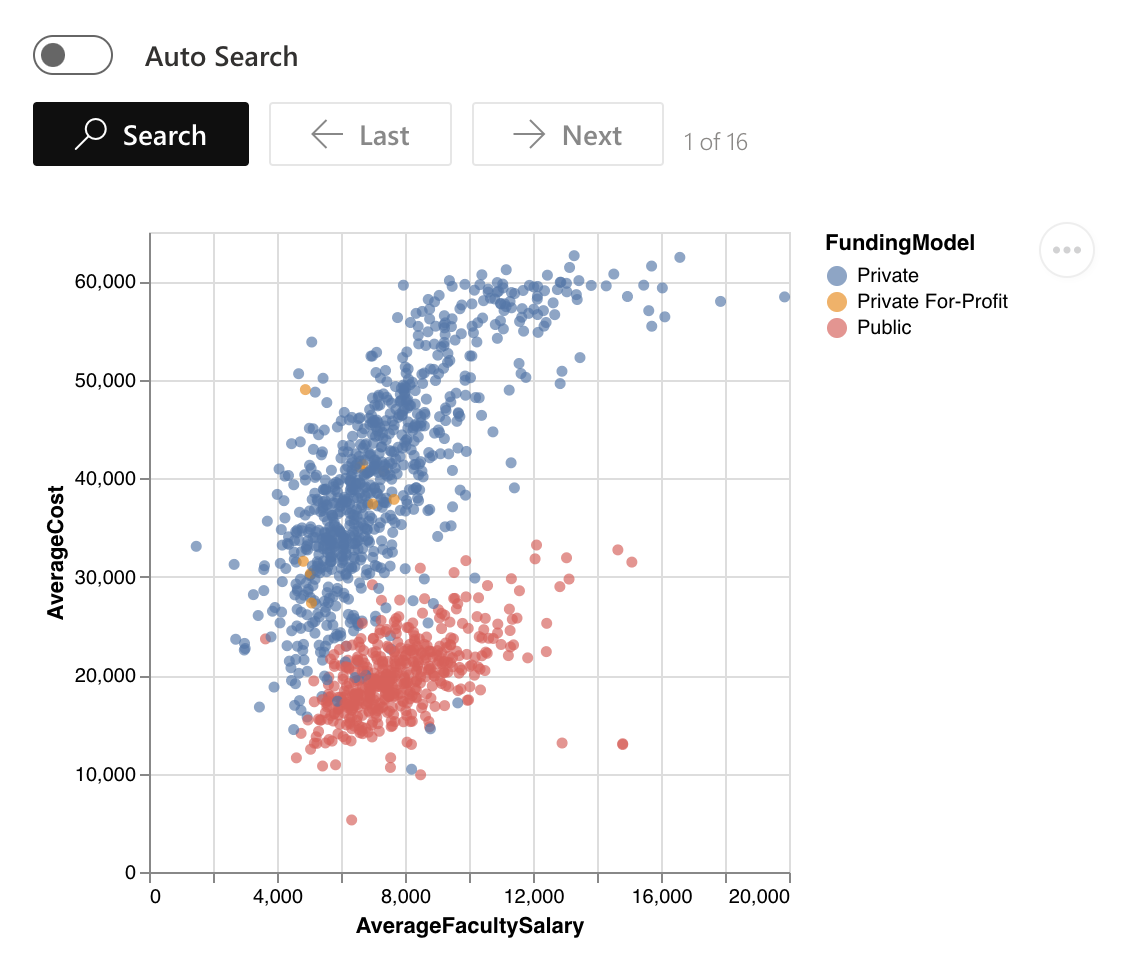
For more suggested results, you can click on the "Next" and "Last" buttons to navigate through all the generated results.
Case 2.
In the following case, we are about to explore an interesting pattern that is more complex.
Step 1. We are about to analyze a chart with a complicated pattern. The chart demonstrates the relationship between SOC and the Maximum battery voltage.
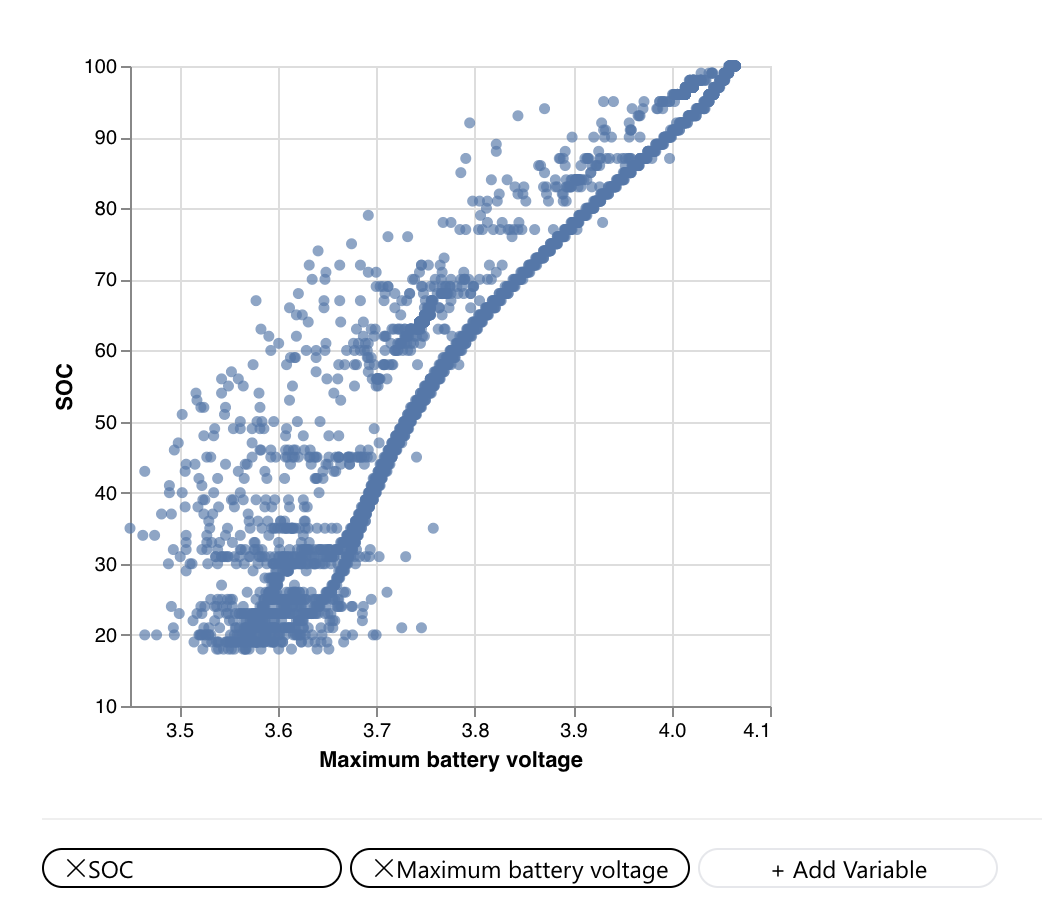
Step 2. We can use the Data Painter to study the unusual pattern in the chart. Click on the Data Painter button under the chart, and color the pattern by dragging your mouse cursor.
Click on the Search button. RATH can automatically detect your intention. Here, RATH suggests the deciding factor is the Vehicle Condition. The pattern represents the vehicle engine is in a flameout condition.
Erase unwanted data
You can use Data Painter to remove unwanted parts of data, or remove anomalies.
To erase data in Data Painter, click on the Erase button, and wipe out the unwanted data.
After removing the unwanted parts of the data, you can focus on the data that you want to analyze.
Explore patterns in data
You might spot some patterns in the data. However, there are no available variables or features that could accurately describe the patterns in the original data.
In this case, you can create new variables and features with Data Painter, by painting the data in different colors. Each color represents a different subset or group.
You can also visualize the patterns in your data by building customized charts. Click on the Explore button and use a tableau-alternative User Interface to build customized charts by dragging and dropping.