Data Profiling
What is data profiling
Data profiling is the process of examining and analyzing data to gain a better understanding of its structure, content, and quality. It involves collecting statistics and metrics about data attributes, including data type, length, pattern, and completeness, to identify potential issues and inconsistencies that may impact data quality.
The purpose of data profiling is to provide a comprehensive overview of the data and to support data governance, data cleansing, and data integration activities.
Data profiling with RATH
After connecting RATH to your data source, you may access a bird-eye view of your data on the Data Source tab. On this page, you can access the distribution and basic statistics of your data source, with three different options to overview your data source.
- Table View: where you can take a glance over your data in the form of a table.
- Meta View: where you can overview the metadata. Best practice: use the meta view to quickly configure the types of the data fields.
- Statistics View: where you can check the statistical information of your data source. Best practice: use this view for statistical and data distribution analysis.
Table view
On the table view, you can take a quick glance over the available data fields, thus granting a general idea of what this dataset is about.
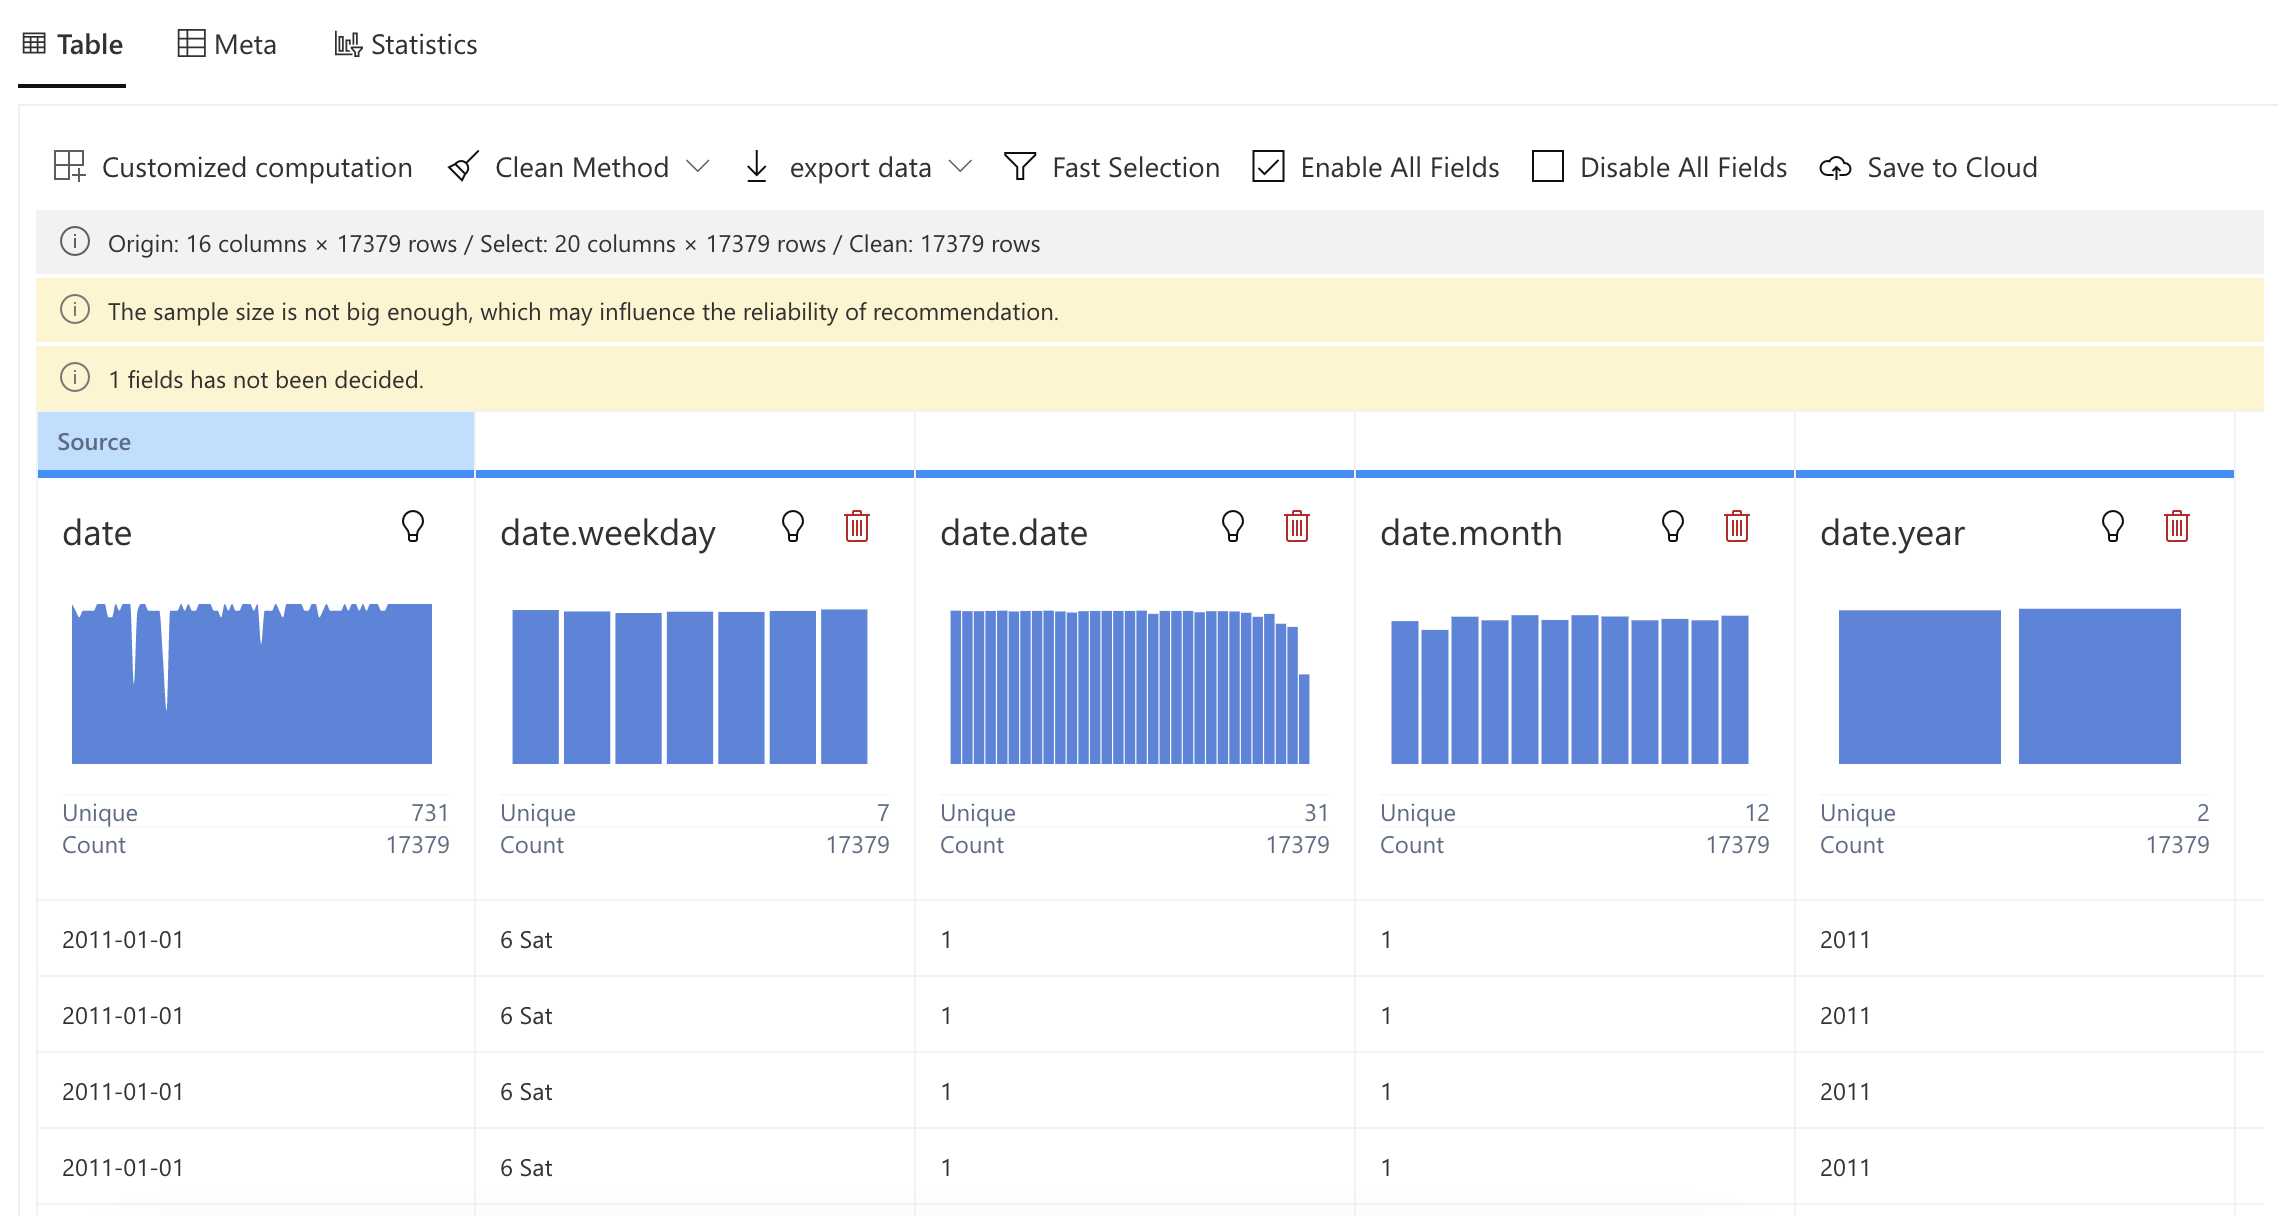
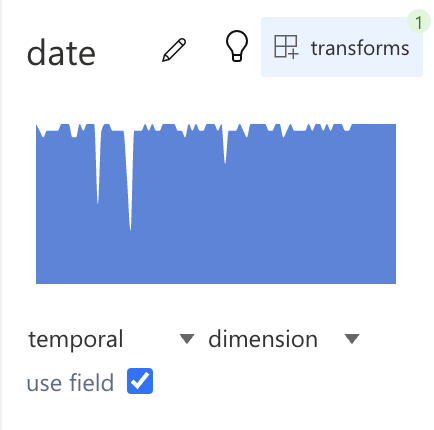
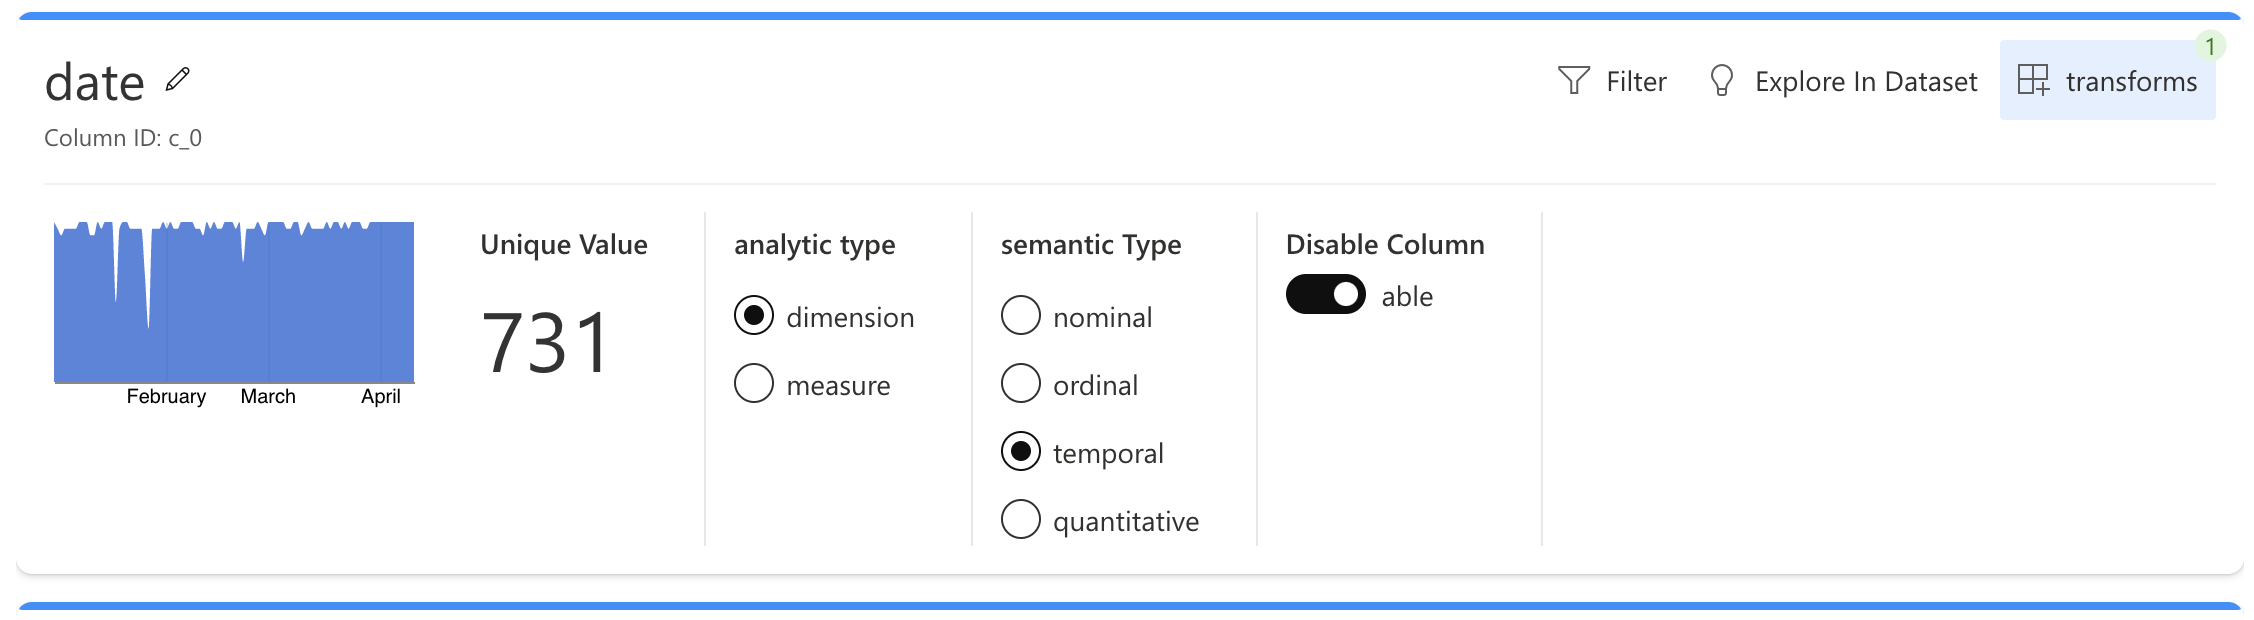
Move your mouse cursor over the specific data field you intend to edit. In this example, we are trying to modify the date field.
-
Click on the "pen" button on the right side of
dateto change the name of this field. -
Click on the "light bulb" button on the right side of
dateto explore this field with the Semi-auto Exploration feature. -
Click on the Transform button to transform this field. In this case, RATH automatically detects the
datefield as a DateTime field and suggests grouping the field by units of time.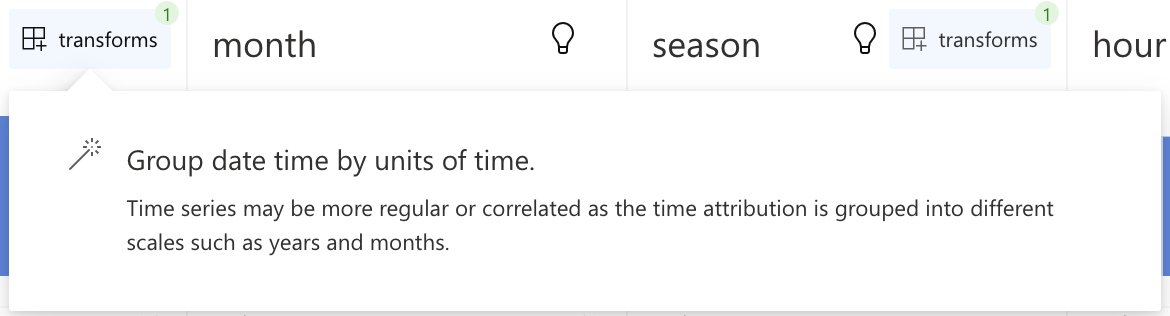
-
Change the dimension of this field.
- For the data types, you can choose between nominal, ordinal, quantitative and temporal.
- Refer to this documentation (opens in a new tab) to learn more about these 4 different data types.
-
Tick off the "use field" option to unselect this field from your dataset.
The concepts of dimensions and measures are borrowed from business intelligence (BI). In a strict sense:
- A dimension is an independent variable, while a measure is a dependent variable.
- Or, a dimension is a feature variable, while a measure is the target variable.
RATH will automatically help you assign the dimensions and measures.
Best practice: For unexplored datasets, you can use RATH to generate quick analysis results. Later, you can adjust the field types according to your understanding.
Meta view
The meta view is an alternative way to oversee your datasets, but more focusing on the metadata.
You can easily modify the fields, change the analytic and semantic types, filter, explore, or transform the fields, etc.
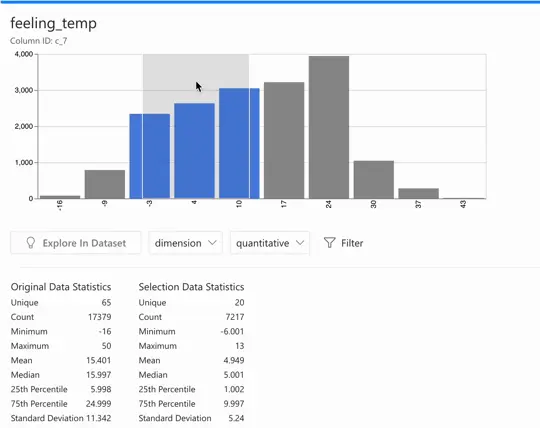
Statistics view
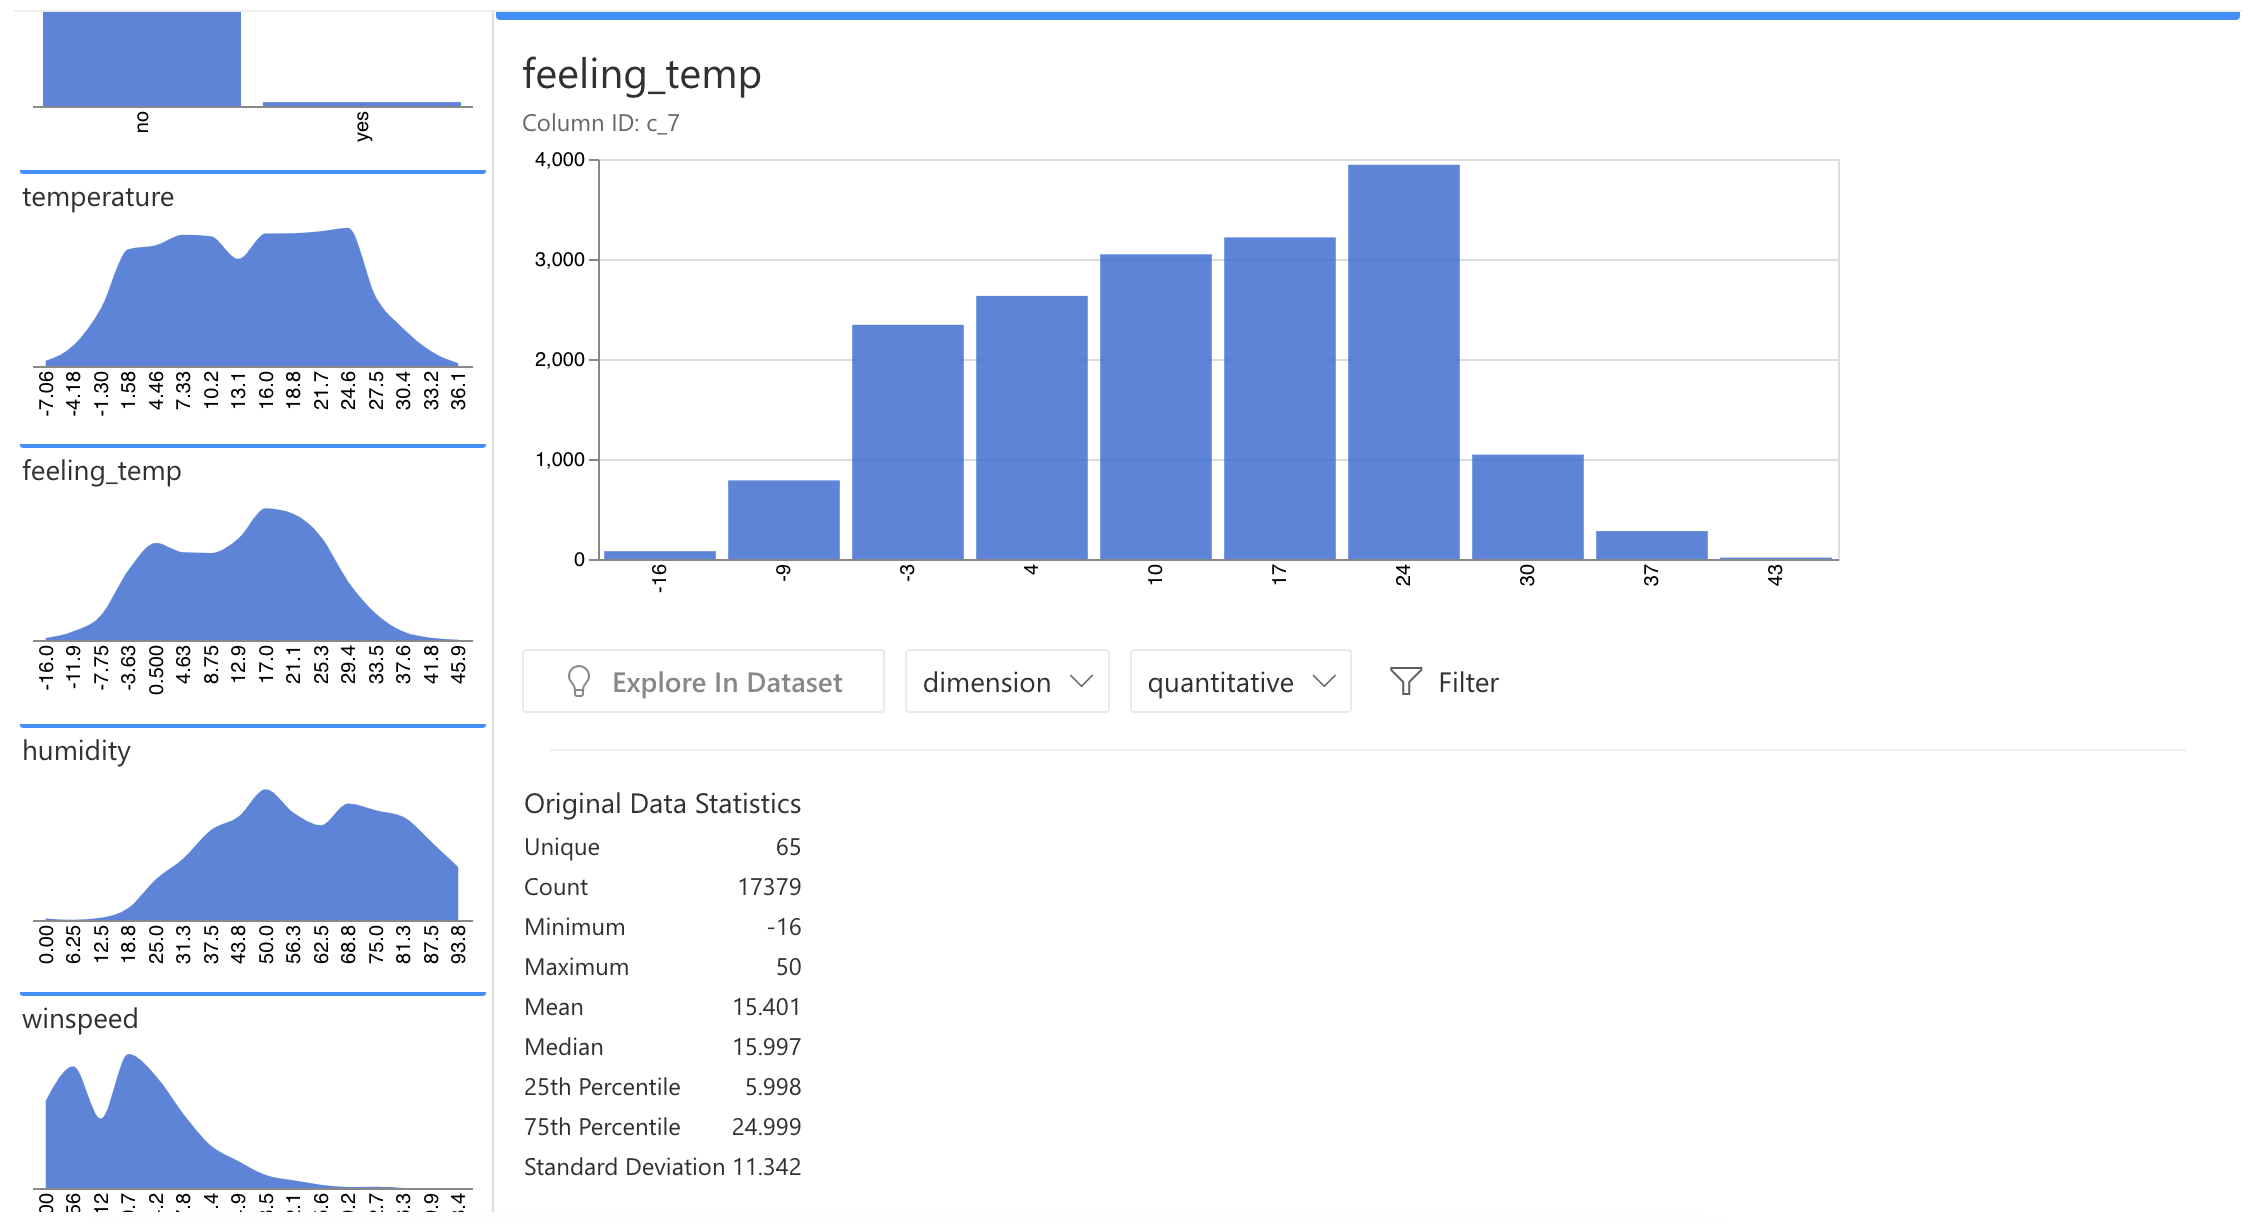
On the Statistics View, RATH displays all your data distribution views on the left panel. You can click on any field for detailed information about this field, which includes unique value, maximum and minimum value, medium value, quantile, standard deviation, etc.
You can select a portion of the field. RATH will automatically generate data statistics for the selected part.
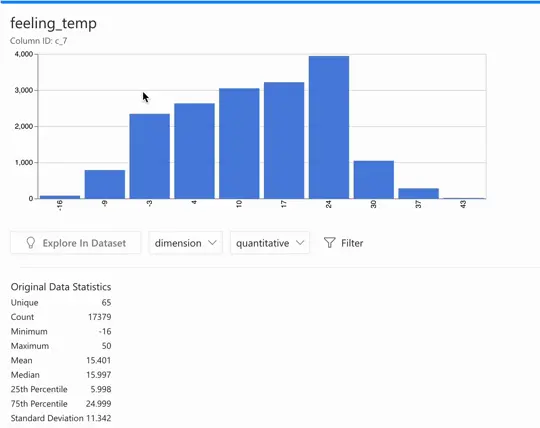
Move the selected field by dragging and dropping. The selected data statistics change accordingly.