Top Open Source Tableau Alternatives in 2025
Tableau is undoubtedly one of the most popular data visualization tools used in the business world, but its proprietary nature can make it expensive for small businesses or individuals who cannot afford its high price tag. Fortunately, open source Tableau alternatives can provide a cost-effective solution for those who are looking for an alternative to Tableau. In this guide, we will explore the top open source Tableau alternatives and help you evaluate which tool best suits your needs.
PyGWalker
PyGWalker (opens in a new tab) (Python Graphic Walker) is an open-source tool that integrates with Pandas DataFrames. It provides an intuitive, no-code interface for data visualization and exploration. PyGWalker is Inspired by Tableau and designed for Python developers. It enables users to create interactive and dynamic visualizations directly within Jupyter notebooks or other Python environments.
Graphic Walker
Graphic Walker (opens in a new tab) is an open-source tool that provides a user-friendly interface for data visualization and exploration. Unlike other open source alternatives, Graphic Walker focus on flexibility and customization.
It is the state of the art component for building your own data visualization tool or integrate BI features into your software.
For most simple use case, developer can intergrate graphic walker with a simple React component, and just fetch data from a REST API and pass to graphic walker. graphic walker can handle data processing and visualization in the browser.
For advanced use case, developers can use graphic walker with its sql parser, which turns users's drag and drop into a sql query. It not only allows you to connect with databases, but also can scale graphic walker to a large dataset, since all computation tasks can push to your database clusters with sql.
For developers who want to build BI + AI, graphic walker also provides custom LLM or customize sql to chart implementation.
Apache Superset

Apache Superset (opens in a new tab) is a free and open source data visualization and exploration platform that provides a user-friendly interface and supports a wide range of data sources. With Apache Superset, you can easily create interactive visualizations, ad hoc reporting, and dashboarding. Apache Superset offers a variety of visualization types, including heatmaps, scatterplots, pie charts, and more. Its versatility and ease of use make it a great alternative to Tableau for those who are looking for a user-friendly data visualization tool.
RATH
RATH (opens in a new tab) is the next-generation AI-powered, Automated Exploratory Data Analysis & Data Visualization tool. It is beyond an open-source alternative to Data Analysis and Visualization tools such as Tableau. It automates your Exploratory Data Analysis workflow with an Augmented Analytic engine by discovering patterns, insights, causals and presents those insights with powerful auto-generated multi-dimensional data visualization.
Redash
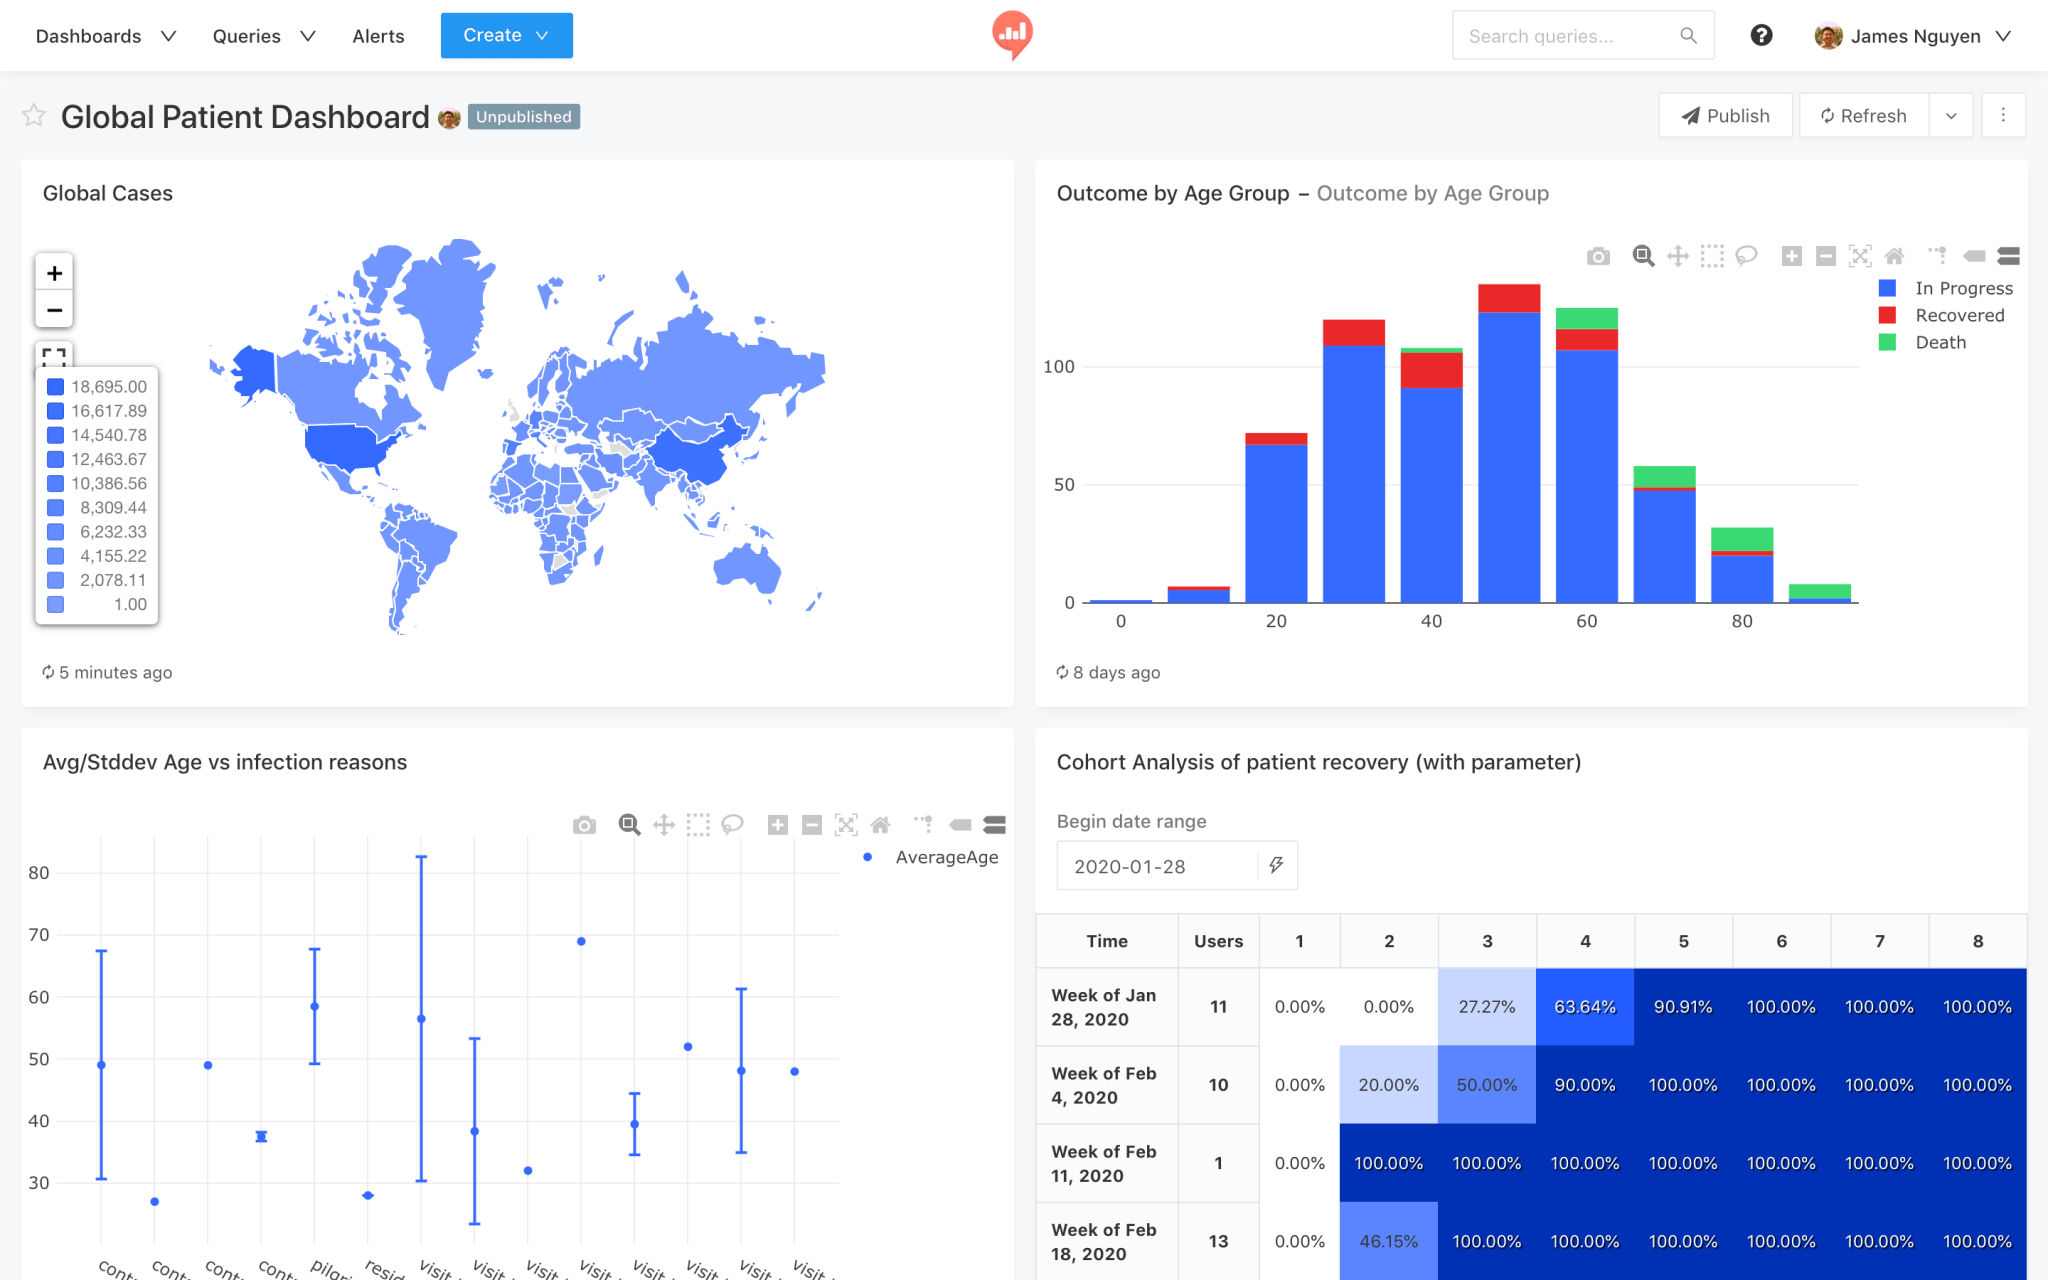
Redash (opens in a new tab) is another open source alternative to Tableau that allows you to connect to various data sources and create interactive dashboards. Redash supports SQL, NoSQL, and other data sources and offers a variety of visualizations, including bar charts, line charts, and pivot tables. Redash also has a community edition, which is completely free to use. With its ease of use and versatility, Redash is an excellent choice for those who are looking for a free and open source alternative to Tableau for creating interactive dashboards.
Metabase

Metabase (opens in a new tab) is a free and open source business intelligence and analytics tool that has an intuitive user interface and allows you to create dashboards and visualizations without any coding skills. With Metabase, you can connect to a wide range of data sources, including MySQL, PostgreSQL, and Google Analytics. Metabase is easily customizable to meet specific business needs, making it a great alternative to Tableau for those who are looking for an intuitive and customizable business intelligence and analytics tool.
BIRT
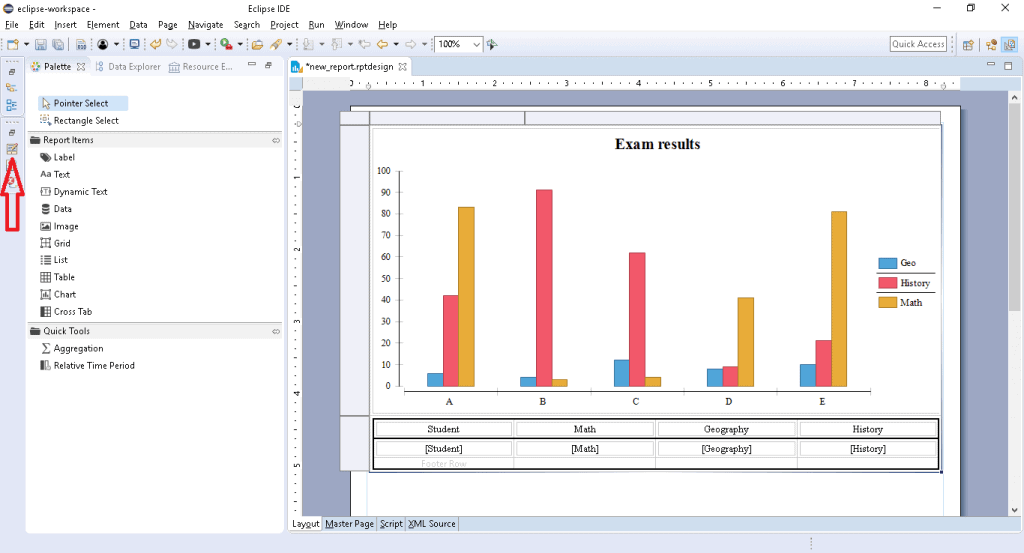
BIRT (opens in a new tab) (Business Intelligence and Reporting Tools) is an open source reporting system for web applications. It is built on the Eclipse platform and offers a variety of visualizations and data sources. BIRT can be used to create reports and dashboards, and it also has a number of export options. One of the key advantages of BIRT is its flexibility in terms of customization. It allows developers to write custom code and design their own reports, making it a powerful tool for businesses with complex reporting requirements. BIRT also has a strong community of users who have contributed a wide range of plug-ins and extensions to the platform.
- Runcell Science: An Open Source Alternative to Claude Science for Research Workflows
- How to Make Mac Not Sleep: Keep Codex, Claude Code, and AI Agents Running
- OpenClaw vs ZeroClaw vs Pi Agent vs Nanobot: Which AI Agent Stack Should You Choose in 2026?
- Can Claude Code Analyze Jupyter Notebooks for Data Science? What It Actually Does
- Claude Code Routines: Why AI Agent Cron Jobs Matter
- Claude Code Desktop Bypass Permissions: How to Enable It
- How to Build Two Python Agents with Google’s A2A Protocol - Step by Step Tutorial
- Top 10 growing data visualization libraries in Python in 2025
Pentaho
Pentaho (opens in a new tab) is an open source business intelligence and analytics tool that offers a wide range of features, including data integration, analytics, and reporting. It supports a variety of data sources and allows you to create interactive dashboards and reports. Pentaho is highly customizable and can be tailored to meet the specific needs of a business. One of the key advantages of Pentaho is its user-friendly interface, which allows users with little technical expertise to create reports and dashboards.
Comparison of Open Source Tableau Alternatives: Strengths and Weaknesses
Here is the comparison of the open source Tableau alternatives with a table highlighting their strengths and weaknesses:
| Tool | Strengths | Weaknesses |
|---|---|---|
| RATH | Automated exploratory data analysis and visualization, augmented analytic engine, multi-dimensional data visualization | |
| PyGWalker | Popular python library in data science community, best for customization and embedding | |
| Graphic Walker | Flexible and customizable, best for building your own data visualization tool or integrate BI features into your software | |
| Apache Superset | User-friendly interface, versatile, wide range of data sources | Limited visualization types |
| Redash | Easy to use, supports various data sources, community edition is free | Limited customization options |
| Metabase | Intuitive interface, customizable, wide range of data sources | Limited visualization options, less robust than other tools |
| BIRT | Customizable, strong community of users, various data sources | Steep learning curve, less user-friendly than other tools |
| Pentaho | User-friendly interface, data integration, analytics, and reporting capabilities | Limited visualization options, less customizable than other tools |
Based on the comparison table, RATH (opens in a new tab) is the best open source alternative to Tableau. RATH has much more advanced, creative features with the heart of Open Source. For example, users with a more traditional BI background, RATH has an easy-to-use, tableau-alternative feature called Manual Exploration. You can create highly customizable charts by dragging and dropping variables to shelves. Watch the following demo video about Exploring the seasonal relationships between registered users and casual users.
Discovering the underlying patterns and trends from a complicated data source can be extremely challenging. The Data Painter feature is designed to fix this problem. You can easily clean data, model data, and explore data using a Painting Tool, which turns the complex Exploratory Data Analysis process visual and simple.
The following demo video shows the process of finding out the meaning of the trend within a certain data set:
Interested? Visit our website (opens in a new tab) for more information!

Conclusion
Open source Tableau alternatives provide a cost-effective solution for those who cannot afford Tableau's high price tag. Each of the above-mentioned tools has its own strengths and weaknesses, so it's important to carefully evaluate which one best suits your needs.
Our Recommendations
Based on different use cases and requirements, here are our specific recommendations:
For Maximum Customization and Integration: Graphic Walker (opens in a new tab) is the ideal choice when you need to build your own data visualization tool or integrate BI features into existing software. Its flexible architecture and React component design make it perfect for developers who want complete control over the visualization experience.
For Small Data Science Teams and Quick Analysis: PyGWalker (opens in a new tab) stands out as the go-to solution for data scientists working with Python. It seamlessly integrates with Pandas DataFrames and Jupyter notebooks, enabling rapid prototyping and exploration without leaving your familiar Python environment.
For Comprehensive AI-Powered Analytics: RATH (opens in a new tab) remains the best overall alternative to Tableau, offering automated exploratory data analysis and advanced AI-driven insights that go beyond traditional BI tools.
With the availability of these open-source alternatives, there is no need to compromise on quality or functionality when it comes to data visualization and analytics. By choosing the right open-source alternative for your specific needs, businesses and teams can save money while still benefiting from powerful, cutting-edge data visualization and analytics capabilities.
FAQs
-
Q1. Are open-source Tableau alternatives reliable for business use?
A1. Yes, open source Tableau alternatives are reliable for business use. These tools are used by many businesses and have a strong user community, which ensures that bugs and other issues are quickly identified and addressed.
-
Q2. Do open source Tableau alternatives offer the same level of functionality as Tableau?
A2. Yes, open source Tableau alternatives offer the same level of functionality as Tableau, and in some cases, they offer even more functionality.
-
Q3. What are the main advantages of using open source Tableau alternatives?
A3. The main advantages of using open source Tableau alternatives are cost-effectiveness, flexibility, and customization options.
-
Q4. Are there any downsides to using open source Tableau alternatives?
A4. One potential downside of using open source Tableau alternatives is that they may require more technical expertise to set up and use than Tableau.
-
Q5. Which open source Tableau alternative is the best? A5. The best open source Tableau alternative depends on the specific needs of a business. Each tool has its own strengths and weaknesses, and businesses should carefully evaluate which one best suits their needs.