Graphic Walker
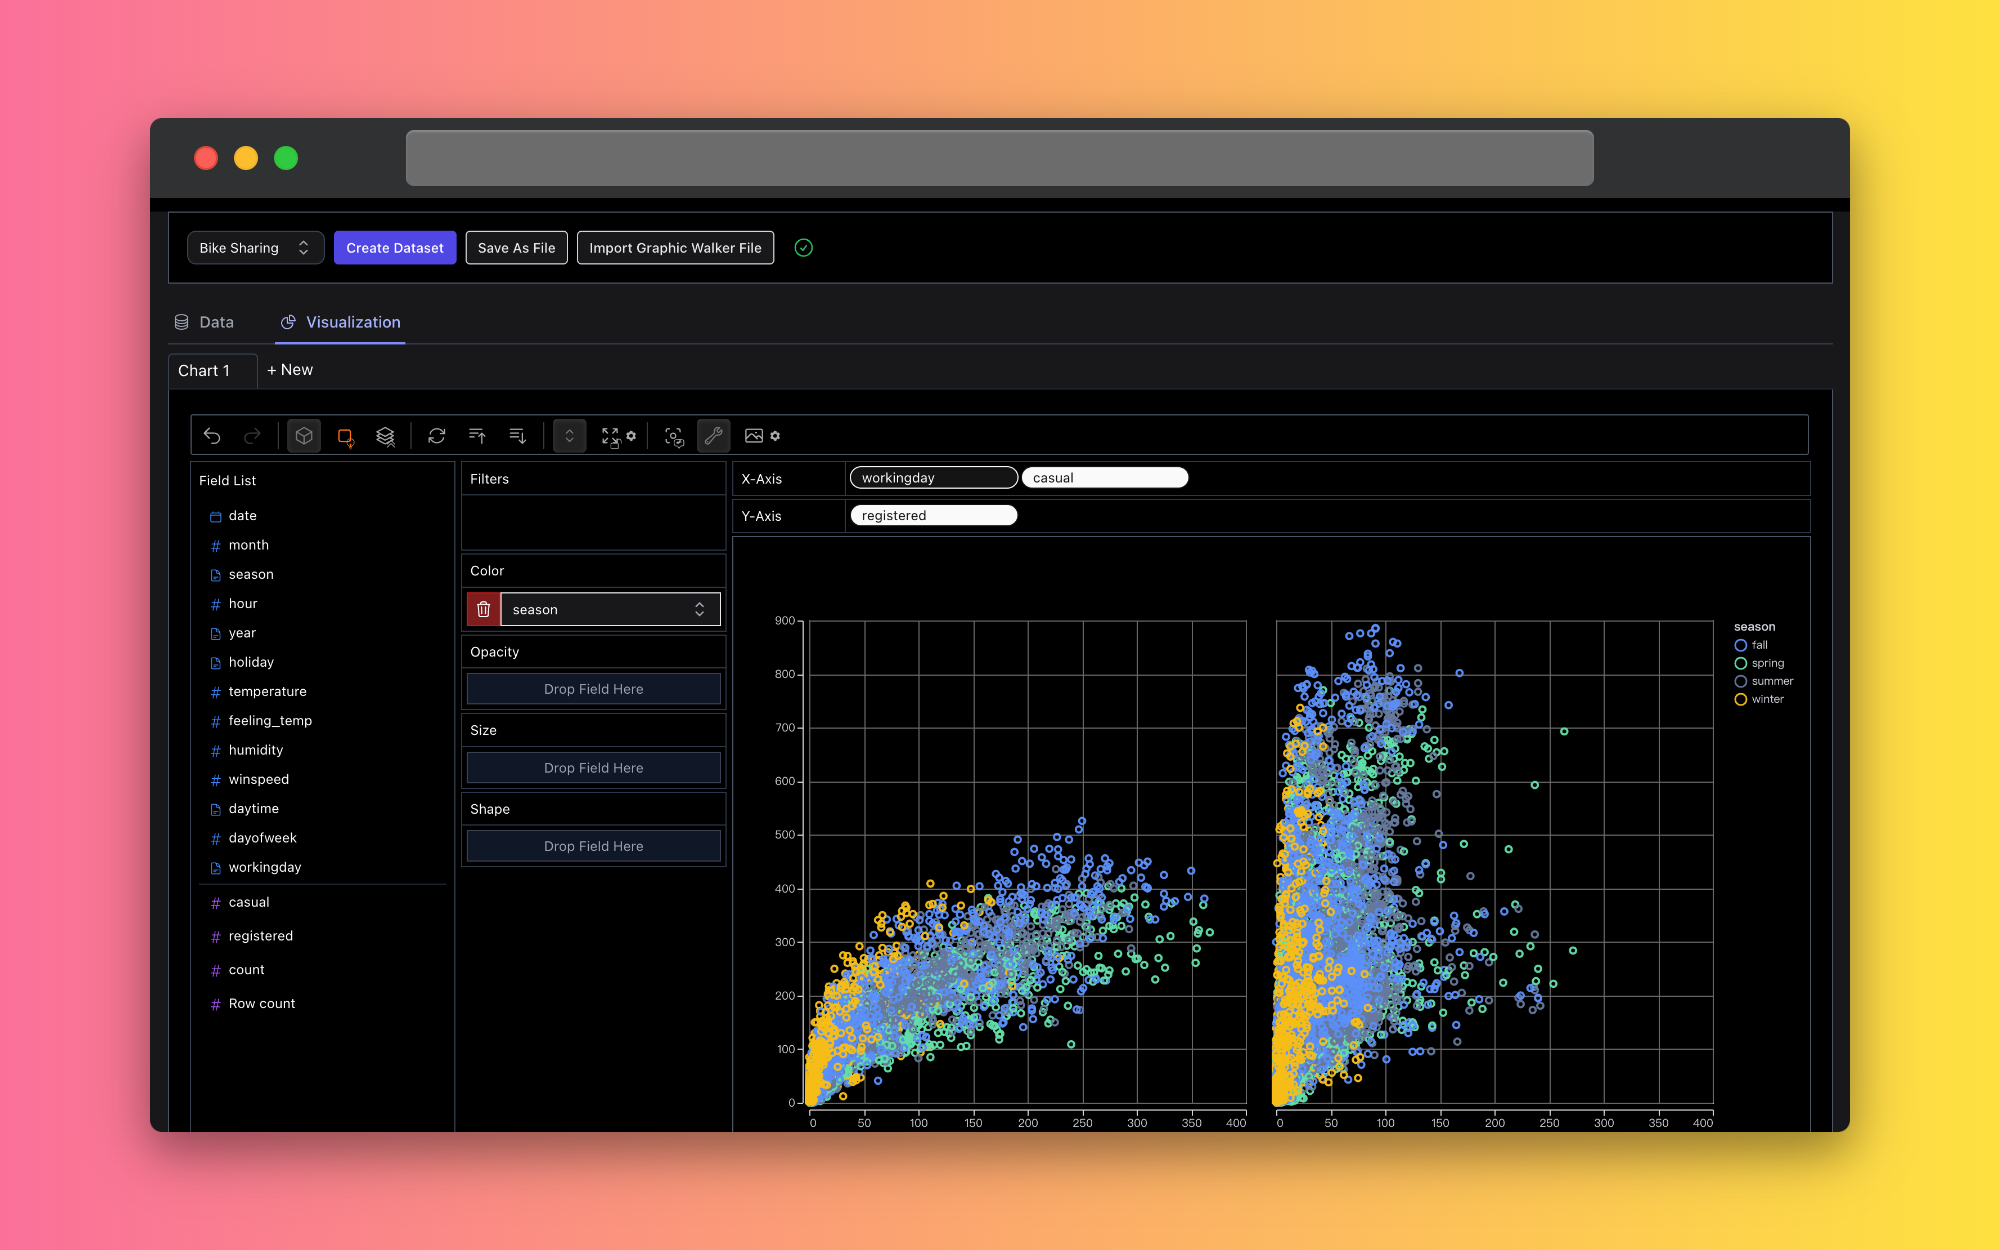


Graphic Walker is an open-source alternative to Tableau that turns your data into interactive visualizations through drag-and-drop. It works as a lightweight, embeddable React component — no heavy BI platform required.
Key Features
- Drag-and-drop exploration — build visualizations by dragging fields into visual encoding channels (rows, columns, color, size, shape, opacity)
- Grammar of graphics — powered by vega-lite (opens in a new tab), supporting bar, line, area, scatter, heatmap, box plot, and geographic charts
- Multiple components —
GraphicWalkerfor full exploration,GraphicRendererfor read-only chart display,PureRendererfor embedding,TableWalkerfor data tables - Client or server computation — runs computations in a WebWorker by default, or delegates to your server for large datasets
- Theming — built-in themes (vega, g2, streamlit), dark mode support, and fully customizable UI colors
- Geographic visualization — choropleth maps and point maps with GeoJSON/TopoJSON support
- Chart export — export charts as SVG or PNG via the ref API
- i18n — built-in support for English, Chinese, and Japanese with custom translation support
- No React? No problem — vanilla JS embedding functions for any web framework
Quick Start
npm install @kanaries/graphic-walkerimport { GraphicWalker } from '@kanaries/graphic-walker';
const fields = [
{ fid: 'date', name: 'Date', semanticType: 'temporal', analyticType: 'dimension' },
{ fid: 'category', name: 'Category', semanticType: 'nominal', analyticType: 'dimension' },
{ fid: 'sales', name: 'Sales', semanticType: 'quantitative', analyticType: 'measure' },
];
function App() {
return <GraphicWalker data={data} fields={fields} />;
}See the Getting Started guide for a complete walkthrough.
Documentation
| Section | Description |
|---|---|
| Getting Started | Installation, basic usage, and field configuration |
| API Reference | Complete props documentation for all components |
| Guides | Chart types, theming, computation, geographic viz, and more |
| Tutorials | Step-by-step tutorials for creating specific chart types |
| FAQ | Common questions and troubleshooting |
Online Playground
Try Graphic Walker without installing anything: Graphic Walker Online (opens in a new tab)
License
Graphic Walker is released under the Apache-2.0 License (opens in a new tab).