PyGWalker Quickstart
Quick Start in Jupyter Notebook
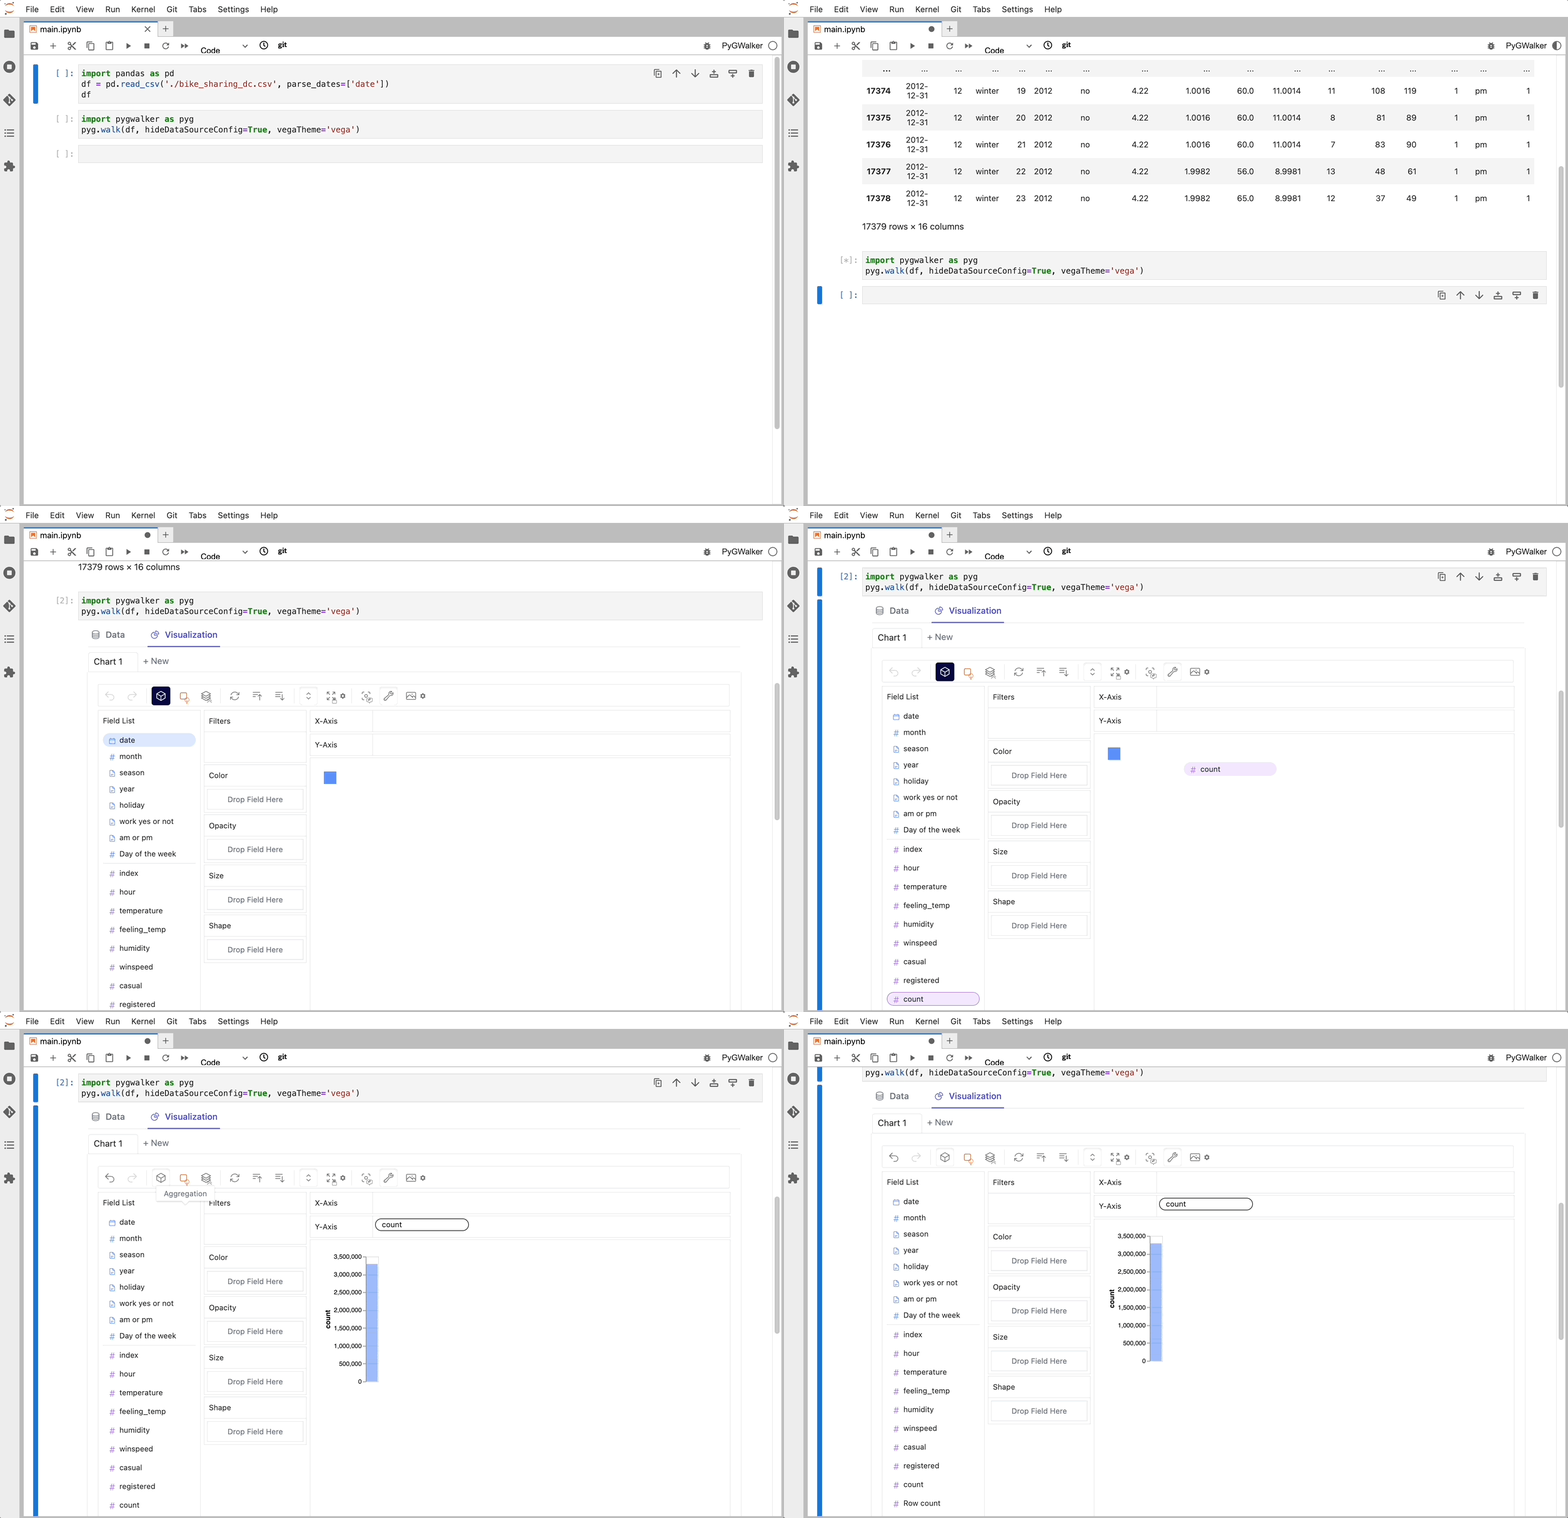
Import pygwalker and pandas to your Jupyter Notebook to get started.
import pandas as pd
import pygwalker as pyg
Load your data as a dataframe, then pass it to pygwalker.
df = pd.read_csv('./<your_csv_file_path>.csv')
walker = pyg.walk(df)
pygwalker accept not just pandas dataframe, but also modin dataframe and even a data connection, like snowflake.
Boosting pygwalker's performance
Sometimes your dataframe can be pretty large, and causes slow performance of pygwalker. Now we provide you with a simple way to boosting its performance with one extra parameter kernel_computation.
pyg.walk(df, kernel_computation=True)By set kernel_computation=True will enable the new computation engine in pygwalker powered by DuckDB.
Use pygwalker with Snowflake
Sometimes your data can be extremely large, and you don't want to load it into your local memory. PyGWalker allows to push all its computations into a remote OLAP services, like Snowflake.
pip install --upgrade --pre pygwalker
pip install --upgrade --pre "pygwalker[snowflake]"
Here is a code example of using pygwalker with Snowflake.
import pygwalker as pyg
from pygwalker.data_parsers.database_parser import Connector
conn = Connector(
    "snowflake://user_name:password@account_identifier/database/schema",
    """
        SELECT
            *
        FROM
            SNOWFLAKE_SAMPLE_DATA.TPCH_SF1.ORDERS
    """
)
walker = pyg.walk(conn)
Quick in Streamlit
PyGWalker is powerful for data exploration locally, and it can be great if it can be run in a web app. Basically, there are many ways to implment this:
- Use the Streamlit (opens in a new tab) to build a web app.
Streamlit is a great tool to build data apps with Python, especially for data scientists who are not familiar with web development. Here is a quick example of using PyGWalker with Streamlit.
from pygwalker.api.streamlit import StreamlitRenderer
import pandas as pd
import streamlit as st

# Adjust the width of the Streamlit page
st.set_page_config(
    page_title="Use Pygwalker In Streamlit",
    layout="wide"
)

# Add Title
st.title("Use Pygwalker In Streamlit")

# You should cache your pygwalker renderer, if you don't want your memory to explode
@st.cache_resource
def get_pyg_renderer() -> "StreamlitRenderer":
    df = pd.read_csv("./bike_sharing_dc.csv")
    # If you want to use feature of saving chart config, set `spec_io_mode="rw"`
    return StreamlitRenderer(df, spec="./gw_config.json", spec_io_mode="rw")


renderer = get_pyg_renderer()

renderer.explorer()Check this article from community to learn more about how to use PyGWalker with Streamlit: pygwalker streamlit api