Unlocking Insights: A Comprehensive Guide to Automated Exploratory Data Analysis

Exploratory data analysis (EDA) is an essential tool in data analysis that helps uncover insights and patterns hidden within data. This article will explore the importance of EDA and how it can be used to help organizations make informed decisions. Additionally, we will discuss a software brand that specializes in EDA and the benefits of using automation to enhance EDA.
- Runcell Science: An Open Source Alternative to Claude Science for Research Workflows
- How to Make Mac Not Sleep: Keep Codex, Claude Code, and AI Agents Running
- OpenClaw vs ZeroClaw vs Pi Agent vs Nanobot: Which AI Agent Stack Should You Choose in 2026?
- Can Claude Code Analyze Jupyter Notebooks for Data Science? What It Actually Does
- Claude Code Routines: Why AI Agent Cron Jobs Matter
- Claude Code Desktop Bypass Permissions: How to Enable It
- How to Build Two Python Agents with Google’s A2A Protocol - Step by Step Tutorial
- Top 10 growing data visualization libraries in Python in 2025
What is Exploratory Data Analysis?
EDA is an approach to analyzing data that emphasizes the use of graphical and statistical techniques to explore and understand data. Its primary goals include discovering patterns, identifying anomalies, and finding relationships between variables. EDA is often used to generate hypotheses that can be tested with more advanced statistical methods.
Types of Exploratory Data Analysis
EDA can be broken down into different types of analyses, such as univariate, bivariate, and multivariate analysis. Univariate analysis involves analyzing a single variable, while bivariate analysis involves analyzing the relationship between two variables. The multivariate analysis involves analyzing the relationship between multiple variables.
Automation of Exploratory Data Analysis
Automation can be used to conduct EDA, allowing for faster and more efficient analysis of data. Automated EDA can be performed using various software tools that can help identify patterns and relationships within data sets. However, the use of automation can also lead to potential drawbacks, such as the loss of control over data analysis.
GitHub Projects for Automated Exploratory Data Analysis
Pandas EDA
Pandas EDA (opens in a new tab) provides a detailed overview of exploratory data analysis using the popular Python library Pandas. It includes Jupyter notebooks with clear explanations and examples of each step of the EDA process, including data cleaning, data visualization, and statistical analysis.
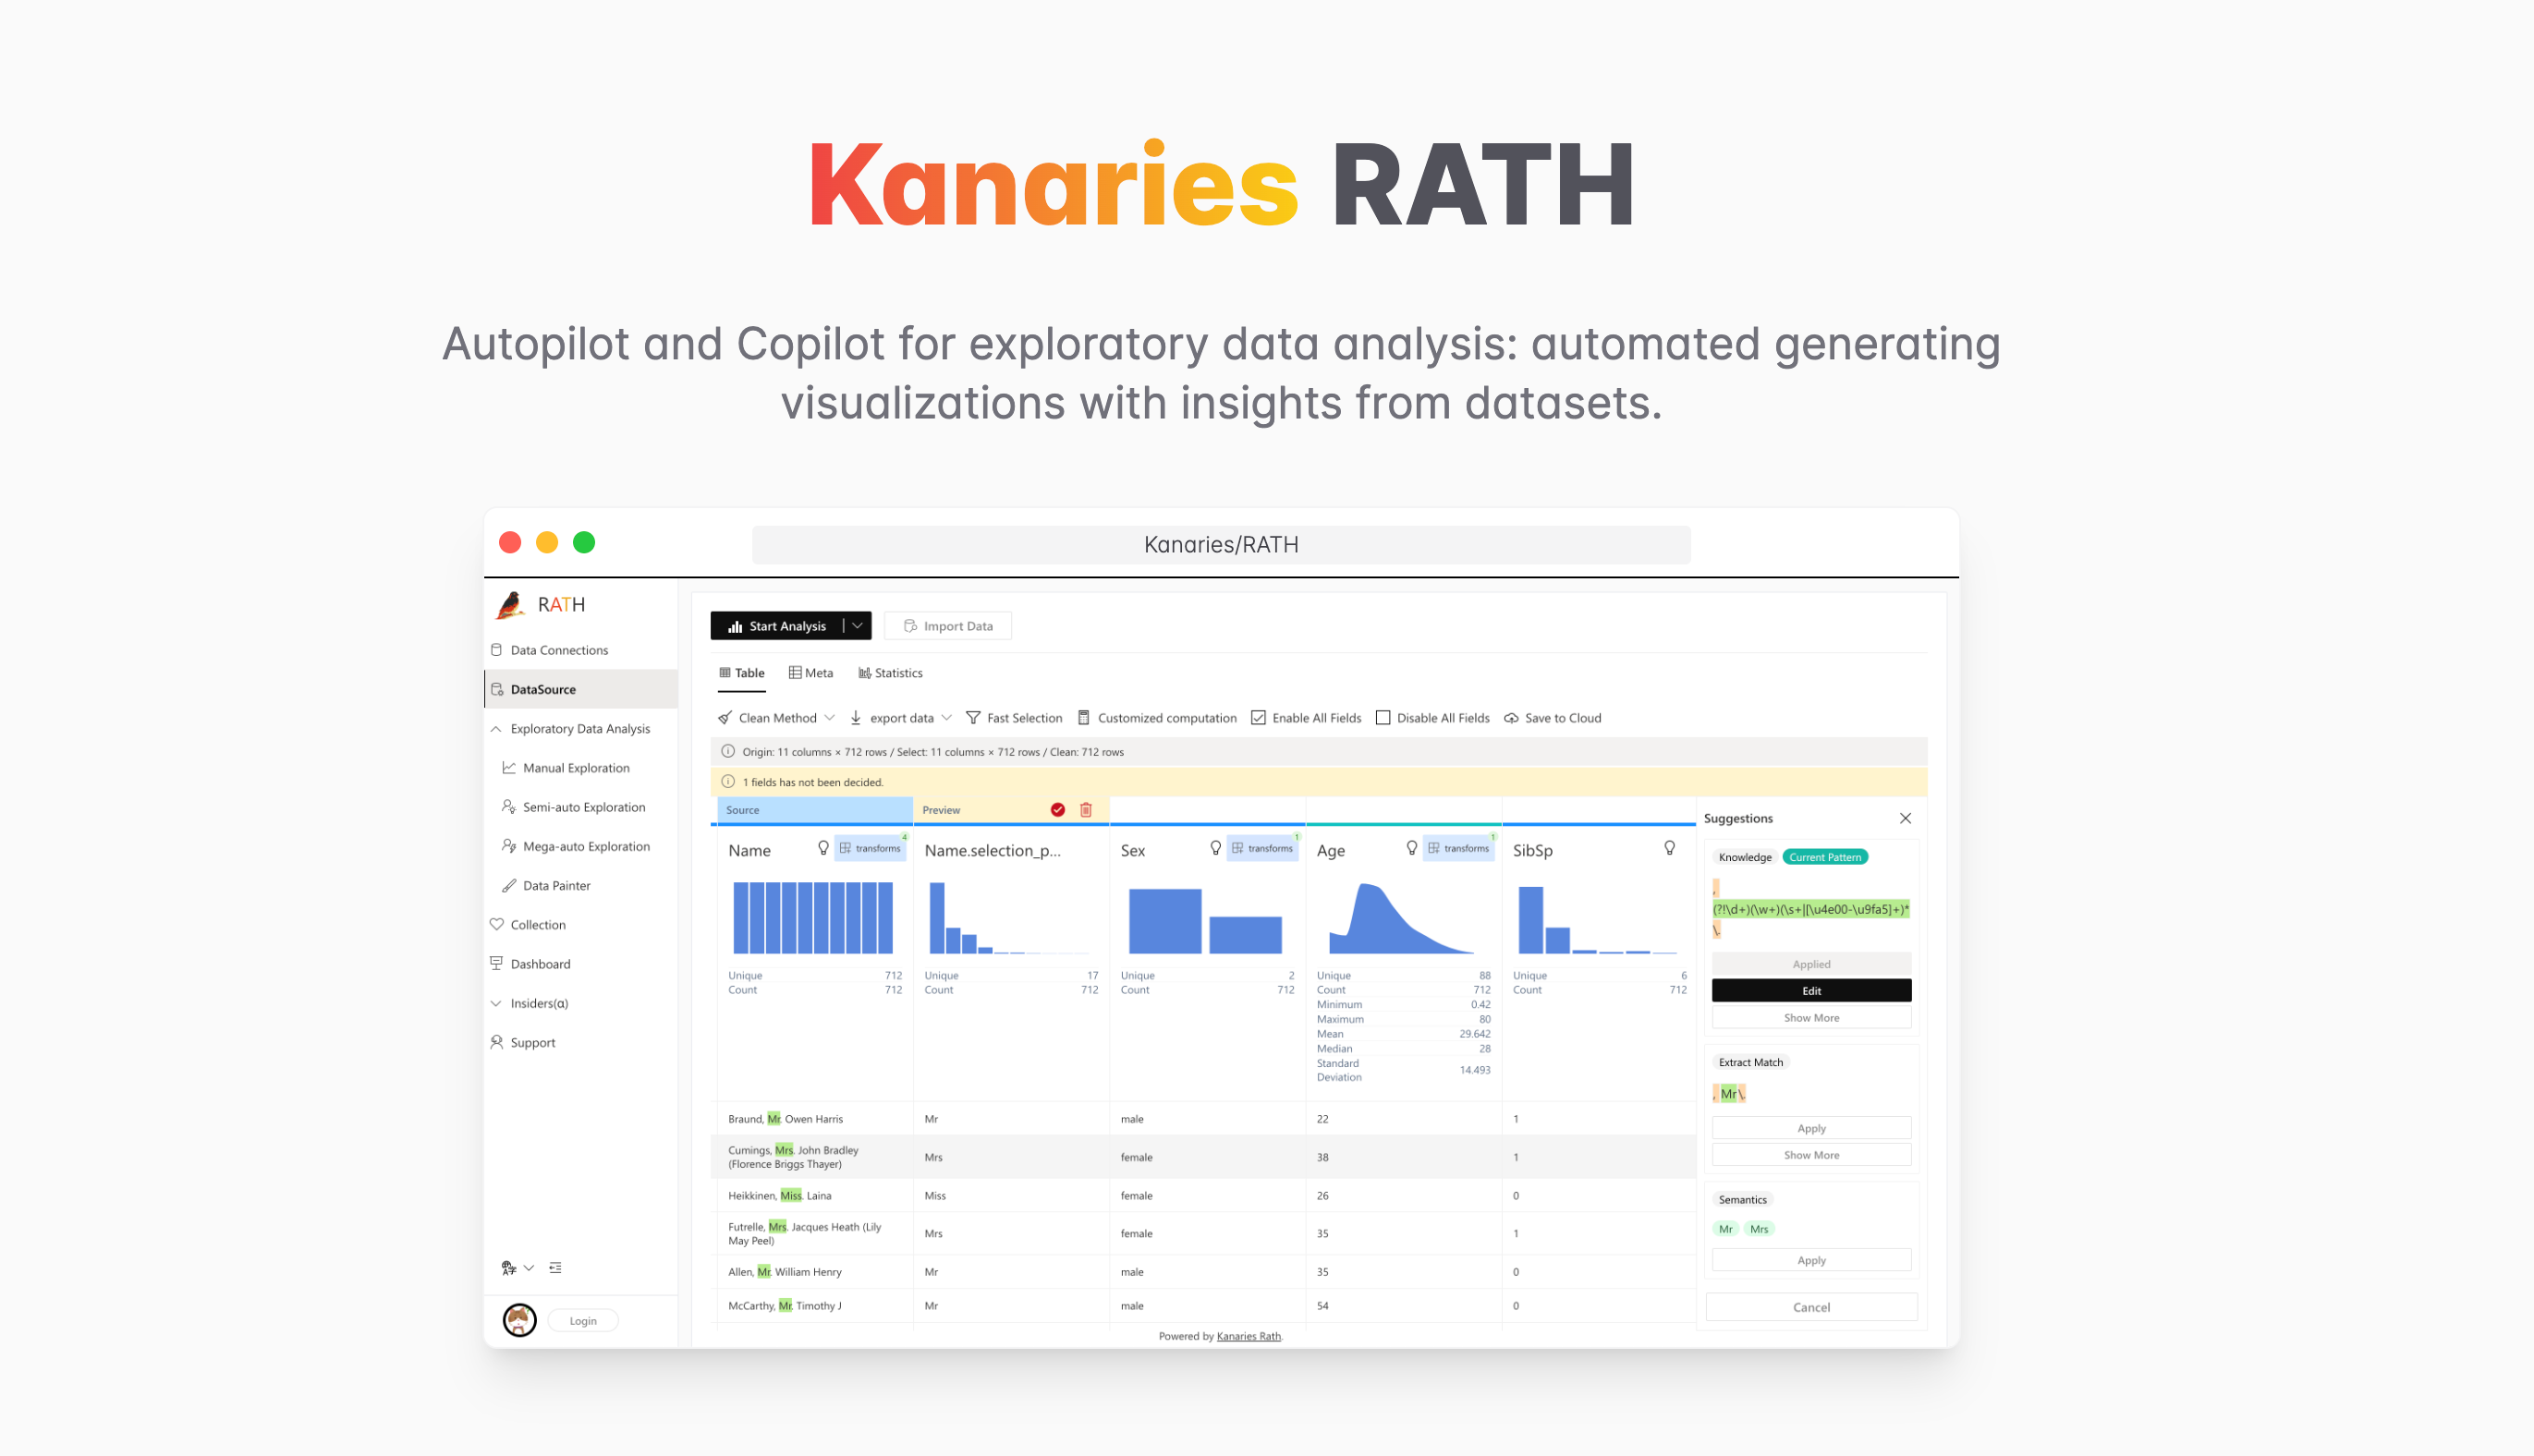
RATH - AutoEDA Solution (opens in a new tab)
RATH (opens in a new tab) is beyond an open-source alternative to Data Analysis and Visualization tools such as Tableau. It automates your Exploratory Data Analysis workflow with an Augmented Analytic engine by discovering patterns, insights, causals and presents those insights with powerful auto-generated multi-dimensional data visualization.
Core features include:
| Feature | Description | Preview |
|---|---|---|
| AutoEda | Augmented analytic engine for discovering patterns, insights, and causals. A fully-automated way to explore your data set and visualize your data with one click. |  |
| Data Visualization | Create Multi-dimensional data visualization based on the effectiveness score. | 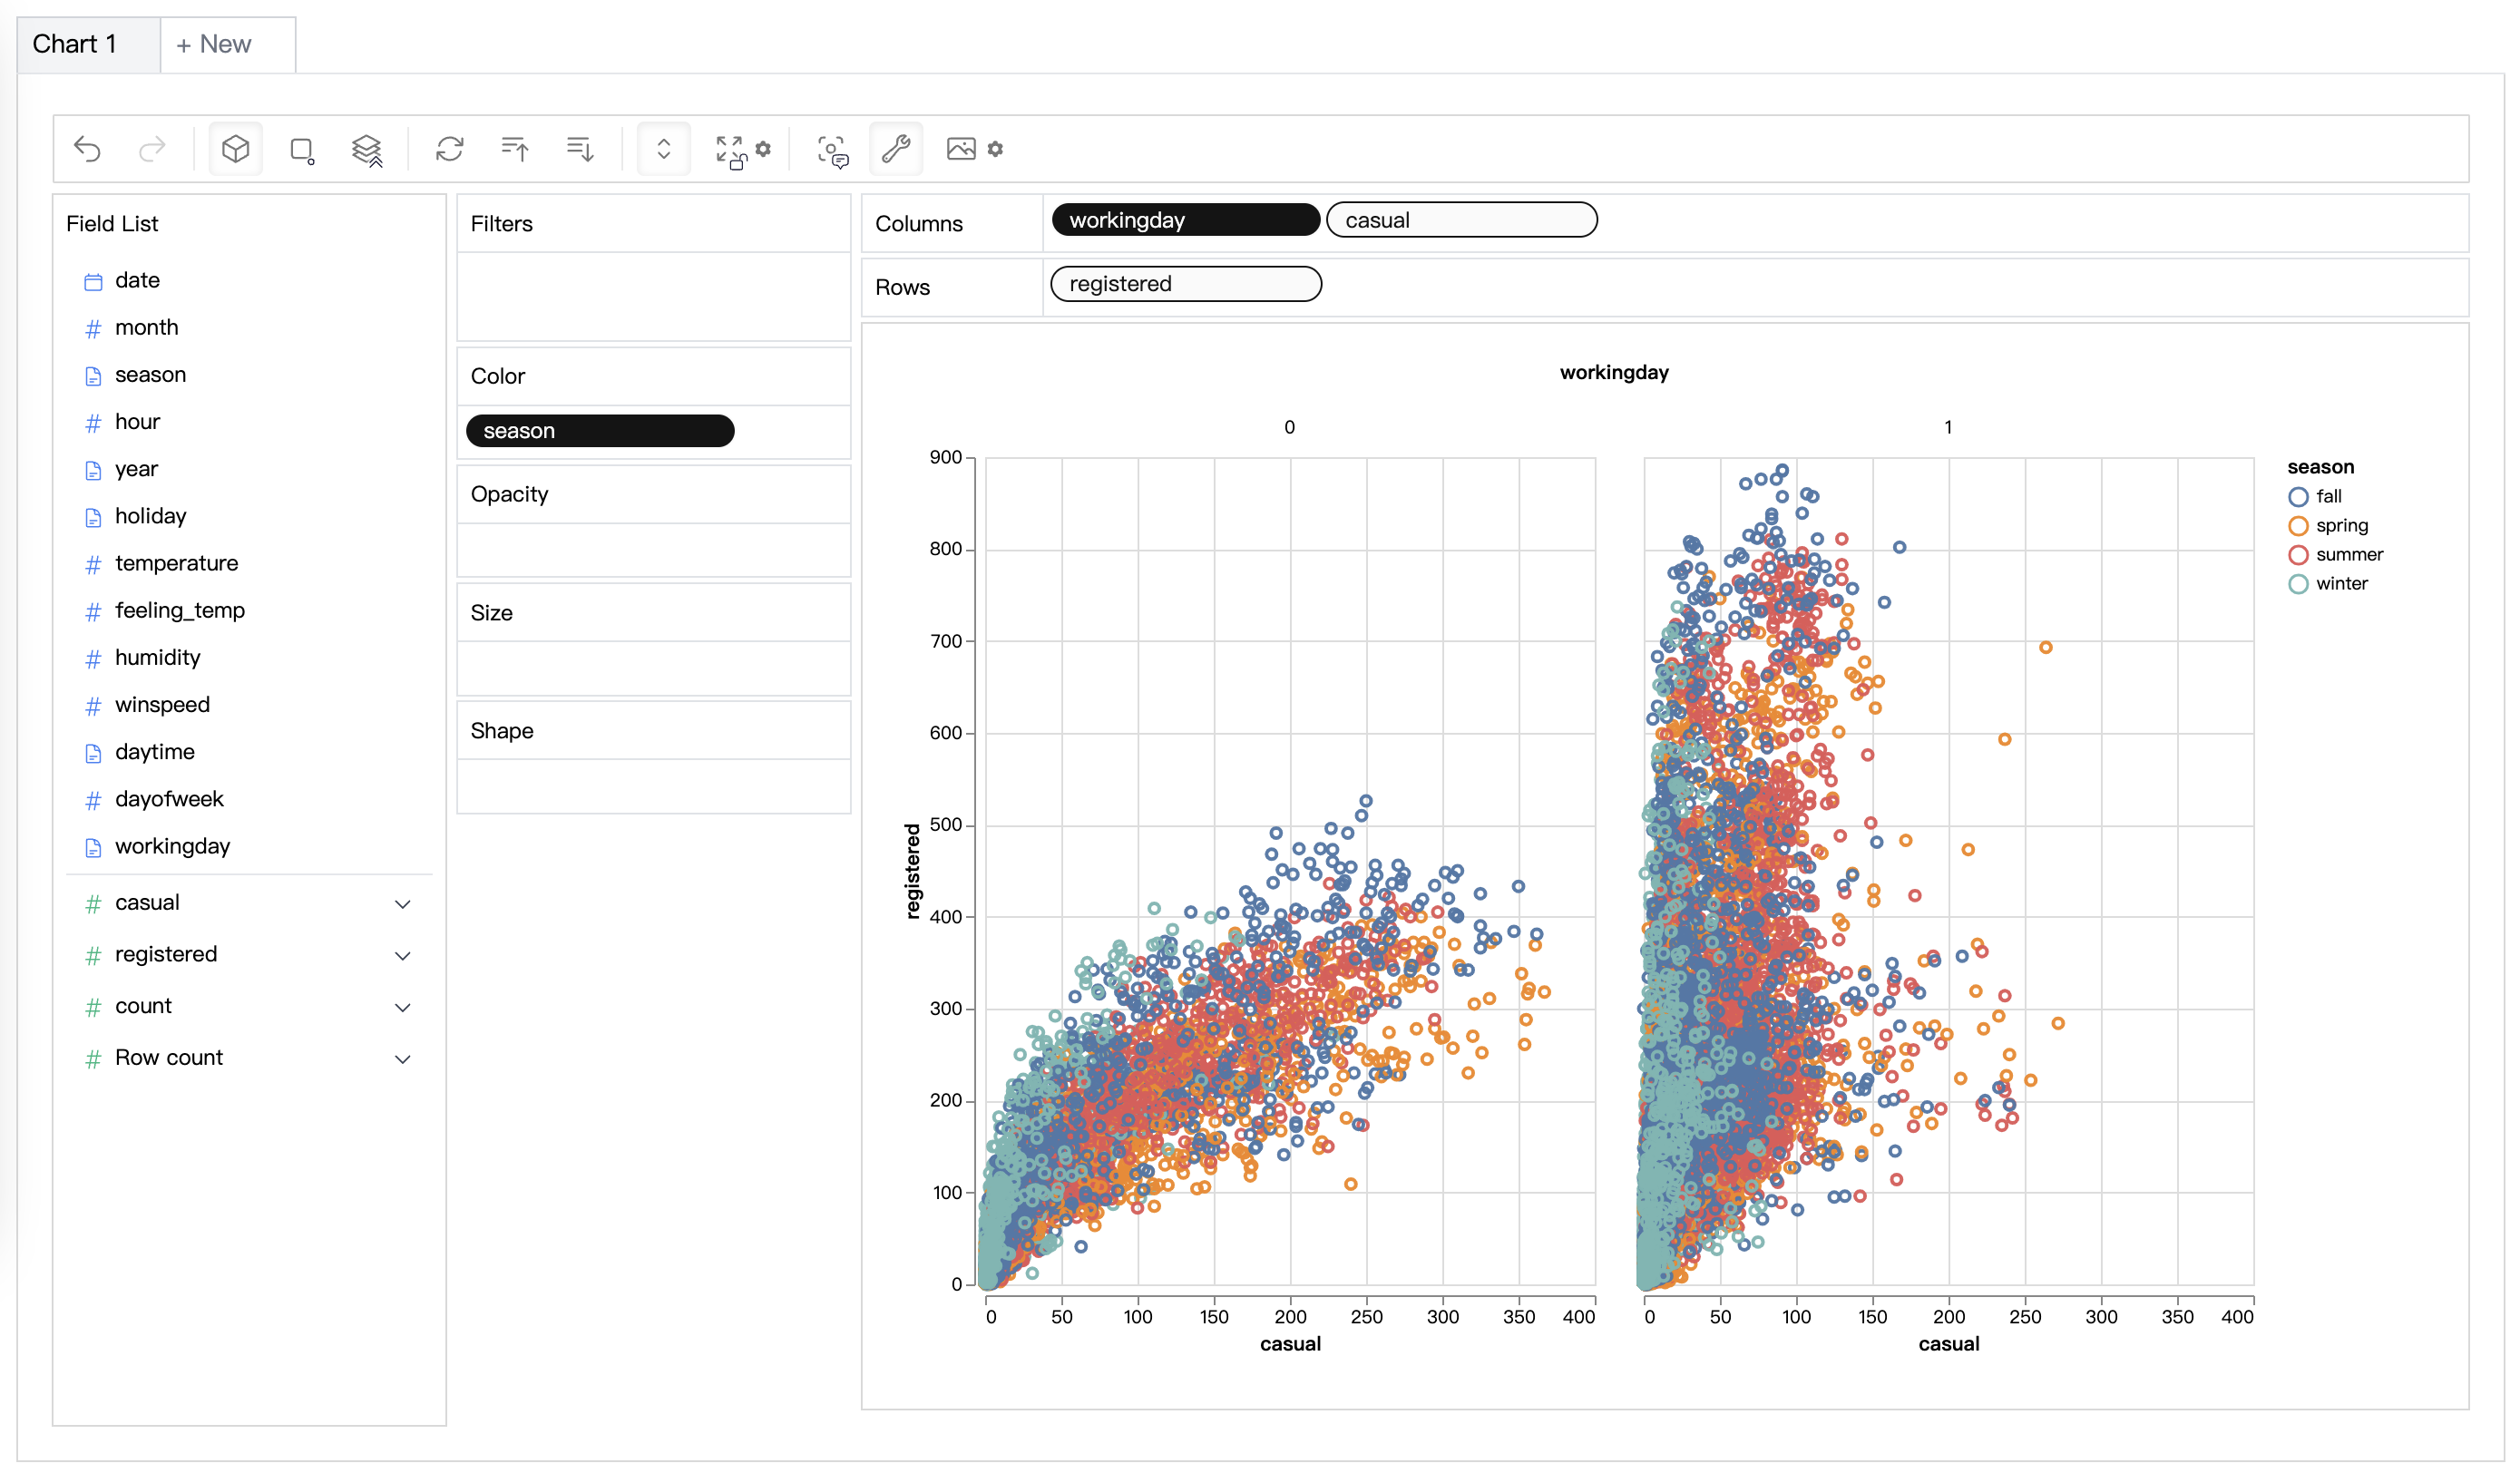 |
| Data Wrangler | Automated data wrangler for generating a summary of the data and data transformation. |  |
| Data Exploration Copilot | Combines automated data exploration and manual exploration. RATH will work as your copilot in data science, learn your interests and uses augmented analytics engine to generate relevant recommendations for you. |  |
| Data Painter | An interactive, instinctive yet powerful tool for exploratory data analysis by directly coloring your data, with further analytical features. |  |
| Dashboard | Build a beautiful interactive data dashboard (including an automated dashboard designer which can provide suggestions to your dashboard). |  |
| Causal Analysis | Provide causal discovery and explanations for complex relation analysis. | 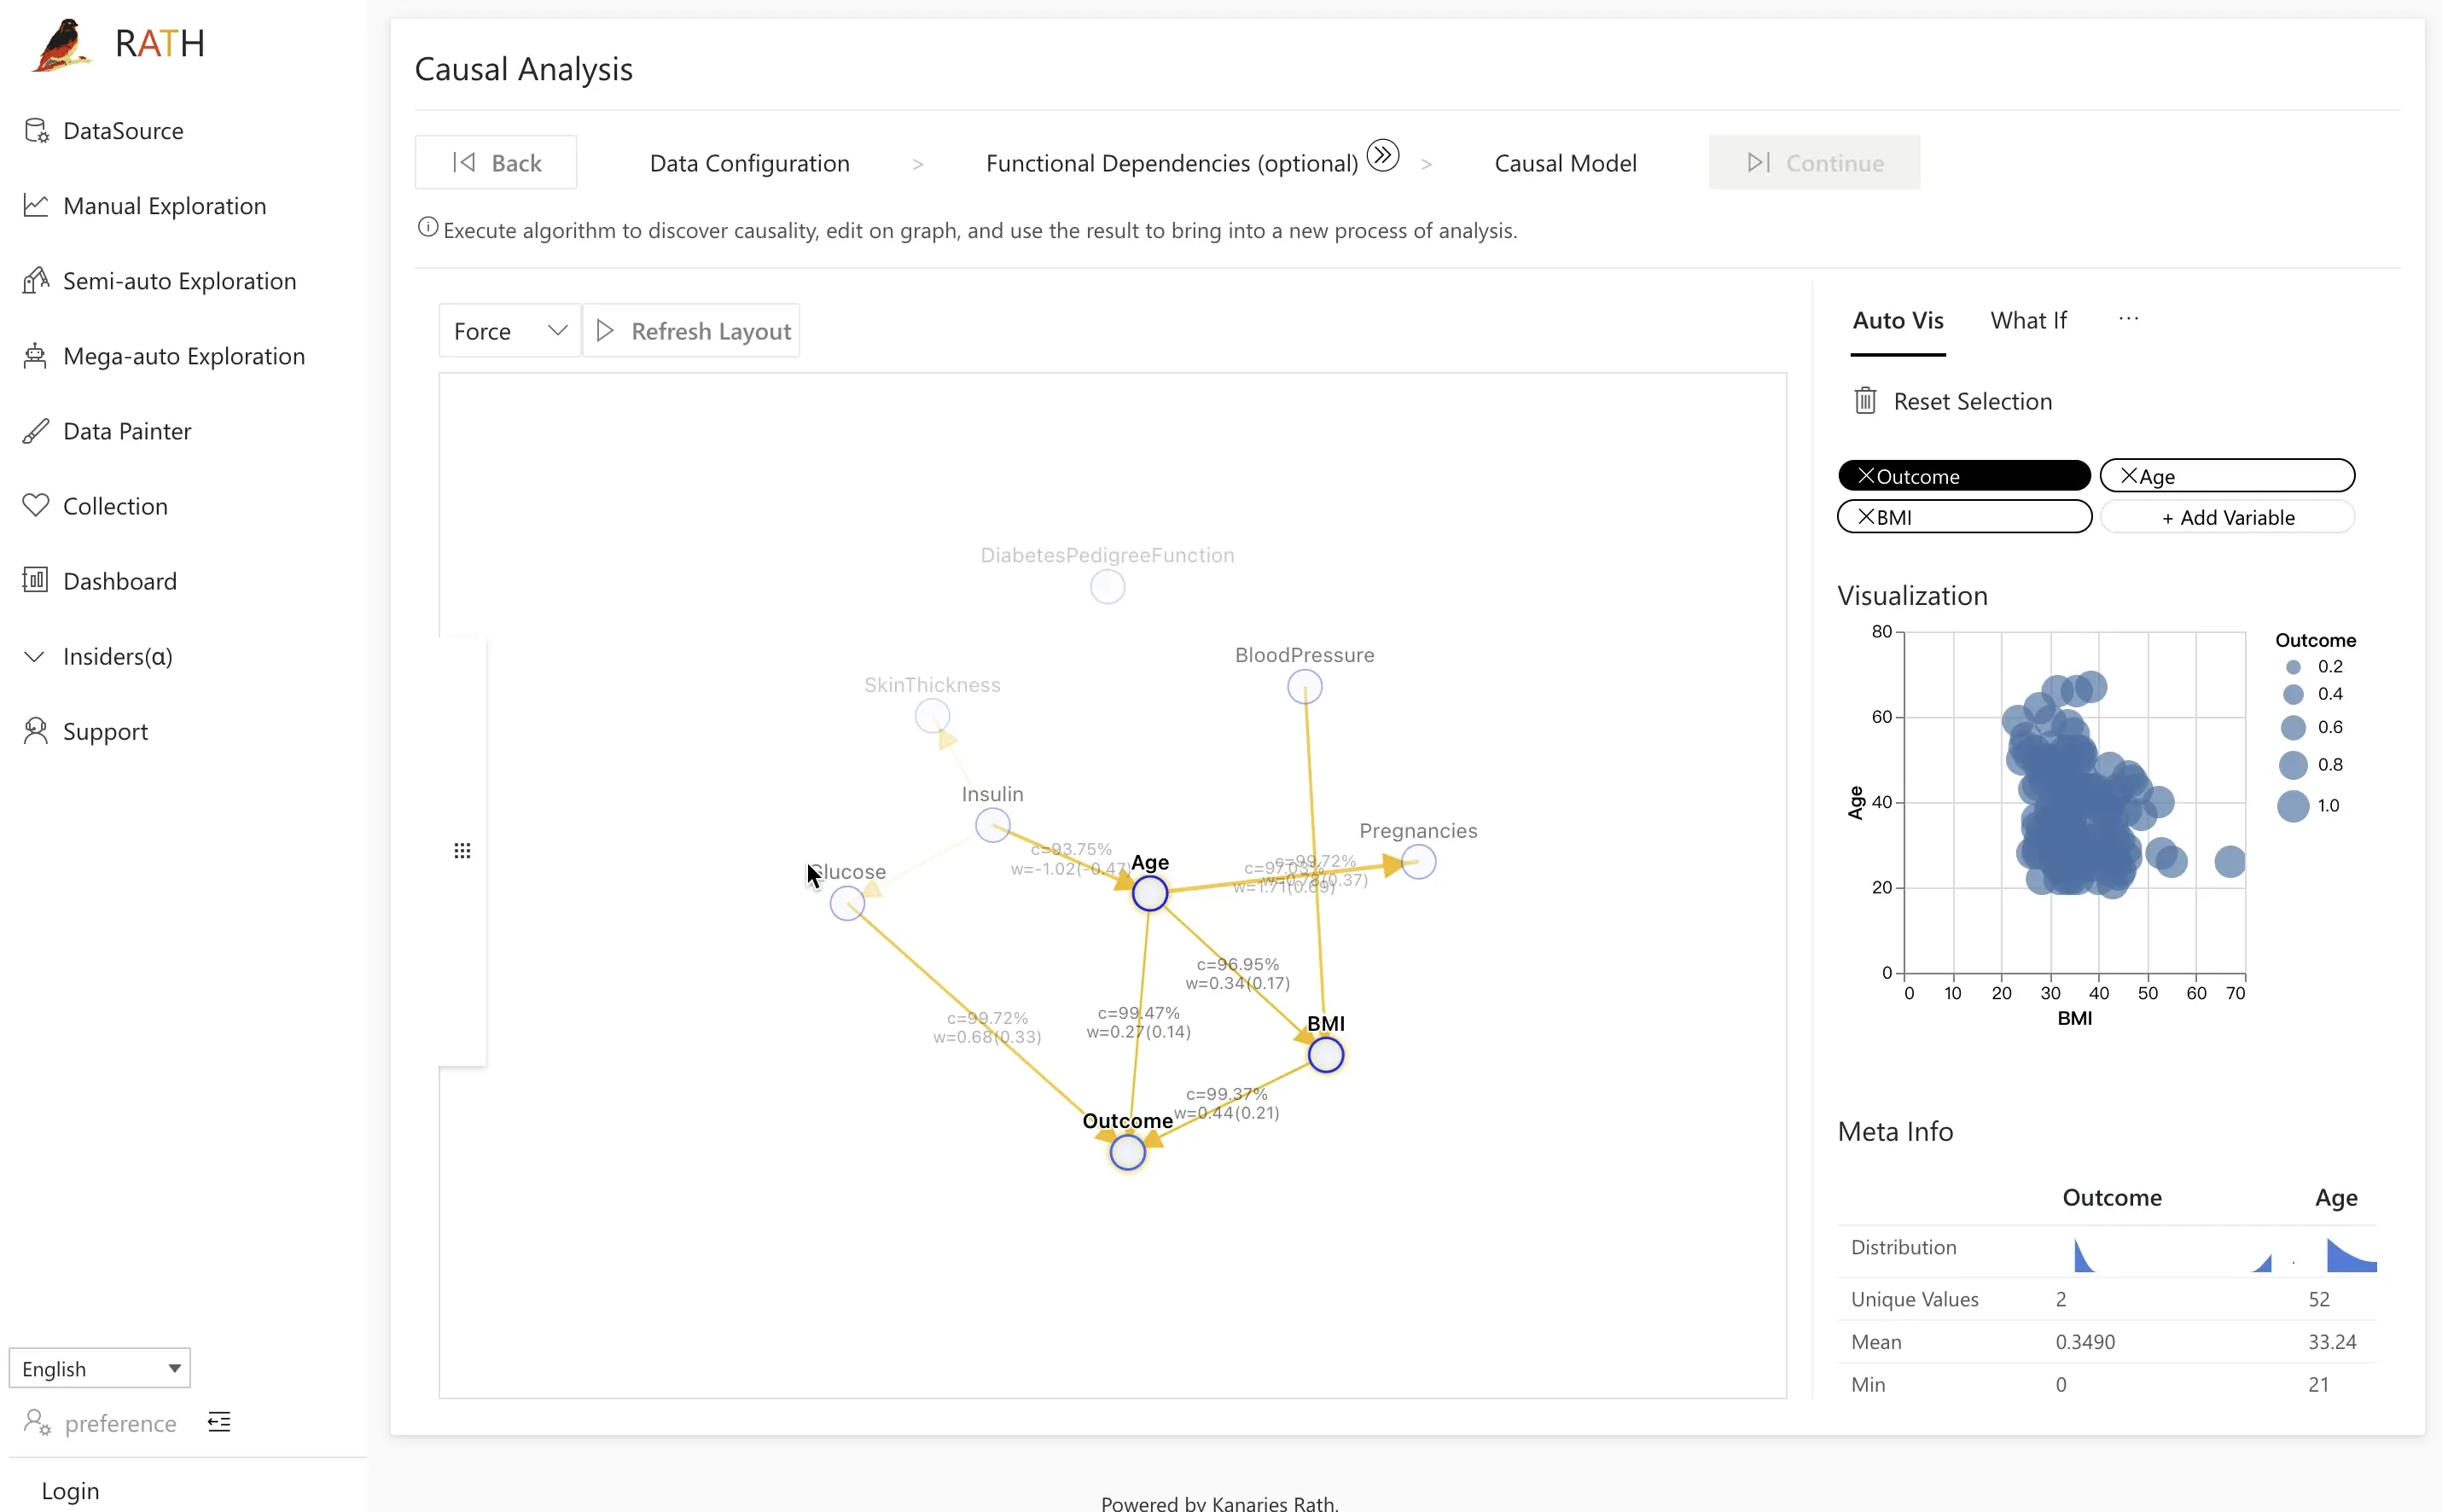 |
RATH (opens in a new tab) is Open Source. Visit RATH GitHub and experience the next-generation Auto-EDA tool. You can also check out the RATH Online Demo as your Data Analysis Playground!

DataPrep
DataPrep (opens in a new tab) is a Python library that automates data preparation and exploratory data analysis, saving you time and improving the accuracy of your insights. Explore the DataPrep repository on Github to learn more.
SweetViz
Sweetviz (opens in a new tab) is a Python library that automates the visualization of your exploratory data analysis, making it easier to communicate your findings and insights to others. Check out the Sweetviz repository on GitHub for more information.
Conclusion
EDA is a critical component of data analysis that helps organizations make informed decisions. Using automation and Github can enhance EDA by allowing for faster and more efficient analysis and collaboration. The software brand specializing in EDA can provide organizations with the tools necessary to conduct effective EDA. Overall, EDA is a powerful tool that can help organizations uncover valuable insights hidden within their data.
Citations
-
"Exploratory Data Analysis: What it is and How to Use it" by Dataquest (opens in a new tab). This article provides a detailed overview of EDA and its importance in data analysis, as well as practical tips and examples on how to perform EDA using various tools and techniques.
-
"Automated Exploratory Data Analysis with Python" by Towards Data Science (opens in a new tab). This article discusses the benefits and drawbacks of using automation in EDA, and provides a step-by-step guide on how to use the DataPrep and Pandas libraries for automated EDA.
-
"The Role of Exploratory Data Analysis in Data Science" by SpringerLink (opens in a new tab). This academic paper delves into the theoretical and practical aspects of EDA, including its history, concepts, techniques, and applications. It also discusses the challenges and opportunities of EDA in the context of big data and machine learning.
-
"Data Wrangling with Pandas" by Wes McKinney (opens in a new tab). This book is a comprehensive guide to using Pandas for data wrangling, cleaning, and analysis. It includes numerous examples and exercises that cover various aspects of EDA, from data loading and cleaning to visualization and statistical analysis.
-
"Best Practices for Data Exploration and Visualization" by Harvard Business Review (opens in a new tab). This article provides insights and best practices on how to perform effective and efficient EDA, including how to select the right data sources, visualize data, and communicate findings to stakeholders. It also highlights the importance of using automation and collaboration tools to enhance EDA.