Casual Analysis or Causal Analysis? Concepts Explained
When it comes to understanding relationships between variables, casual analysis and causal analysis are easy to mix up.
- Casual analysis is informal: a quick look at data, gut feelings, or simple charts.
- Causal analysis is systematic: it uses structured methods and models to uncover cause-and-effect relationships (for example, causal analysis in machine learning).
This article focuses on causal analysis—what it is, how it works, where it’s used, and how modern tools like RATH make it easier to explore causality visually.
- Runcell Science: An Open Source Alternative to Claude Science for Research Workflows
- How to Make Mac Not Sleep: Keep Codex, Claude Code, and AI Agents Running
- OpenClaw vs ZeroClaw vs Pi Agent vs Nanobot: Which AI Agent Stack Should You Choose in 2026?
- Can Claude Code Analyze Jupyter Notebooks for Data Science? What It Actually Does
- Claude Code Routines: Why AI Agent Cron Jobs Matter
- Claude Code Desktop Bypass Permissions: How to Enable It
- How to Build Two Python Agents with Google’s A2A Protocol - Step by Step Tutorial
- Top 10 growing data visualization libraries in Python in 2025
Casual vs. Causal Analysis at a Glance
Before diving deeper, let’s clear up the confusion:
| Aspect | Casual Analysis | Causal Analysis |
|---|---|---|
| Goal | Get a rough idea of what’s going on | Understand what actually drives an outcome |
| Rigor | Informal, often ad-hoc | Systematic, based on statistics and causal models |
| Typical tools | Simple charts, eyeballing trends | Experiments, regression, DAGs, counterfactual reasoning |
| When to use | Early exploration, brainstorming | Decisions, policy, product changes, scientific research |
Casual analysis is fine when you’re just exploring. But when the question is “If we change X, will Y really change?”, you’ve entered the world of causal analysis.
Causal Analysis Methods
There are several ways to do causal analysis, from classic experiments to modern observational techniques.
Experimental Designs
Randomized controlled trials (RCTs) are the gold standard for causal inference.
- You manipulate one or more variables (treatments).
- You randomly assign units (people, schools, markets) to treatment vs. control.
- Randomization helps eliminate confounding factors, so differences in outcomes can be attributed to the treatment.
Typical examples:
- Testing whether a new drug reduces blood pressure.
- Measuring the impact of a new website layout on conversion rates.
Observational Studies
In many real-world situations, experiments are too expensive, impossible, or unethical. That’s where observational causal analysis comes in.
You don’t control who gets which “treatment”—you only observe. To recover causal signals, you rely on statistical techniques such as:
- Regression analysis — controlling for confounders.
- Instrumental variables — using external “instruments” that affect the treatment but not the outcome directly.
- Propensity score matching / weighting — balancing treated and control groups to mimic a randomized trial.
- Causal graphs / DAG-based methods — modeling causal structure explicitly and reasoning about interventions.
Observational methods are more sensitive to assumptions, but they are essential in fields like economics, healthcare, and public policy.
Causal Analysis Examples
Causal thinking shows up in almost every domain:
- Psychology – How do childhood experiences influence adult behavior or mental health outcomes?
- Economics – What is the effect of a minimum wage increase on employment?
- Marketing – Does a new ad campaign really increase revenue, or were sales going up anyway?
- Product / UX – Did changing a signup flow actually improve activation rates?
In each case, the key question isn’t “do variables move together?” but “does changing one variable cause the other to change?”
Causal Analysis in Research, Statistics, and Writing
Causal Analysis in Research
For researchers, causal analysis is the backbone of evidence-based decision-making:
- Identify factors that contribute to specific outcomes.
- Design interventions that change those factors.
- Evaluate whether interventions work as intended.
Whether you’re studying clinical treatments, education programs, or software rollouts, a solid causal framework helps you avoid misleading conclusions.
Causal Analysis in Statistics
Statistics provides the tools to estimate and test causal claims.
Common techniques include:
- Linear / logistic regression
- Difference-in-differences
- Structural equation modeling
- Causal graph–based estimators
These models help you control for confounders, quantify uncertainty, and communicate causal effects in a rigorous way.
Causal Analysis in Writing
In writing, causal analysis means clearly explaining:
- What happened
- Why it happened
- What might happen next if conditions change
Good causal writing presents evidence, considers alternative explanations, and walks the reader through a logical chain of reasoning—whether it’s a research paper, blog post, or internal memo.
Causal Analysis in Psychology
In psychology, causal analysis is used to understand the mechanisms behind human behavior and mental processes. Examples include:
- Linking early-life stress to adult anxiety or depression.
- Testing whether specific therapy methods cause improvements in patient outcomes.
- Understanding which environmental factors trigger certain behaviors.
By uncovering these relationships, psychologists can design more targeted and effective interventions instead of relying on guesswork.
Causal Analysis in Python (and RATH)
Python is a popular choice for causal analysis thanks to its rich ecosystem:
- DoWhy (opens in a new tab) – focuses on causal graphs and a principled 4-step causal workflow (model → identify → estimate → refute).
- EconML (opens in a new tab) – from Microsoft, specialized in heterogeneous treatment effects and uplift modeling.
- CausalML (opens in a new tab) – practical tools for uplift / causal inference in business and marketing settings.
- Causalinference (opens in a new tab) – classic techniques like matching, IPW, and difference-in-differences.
If you prefer code-free or low-code workflows, you can also start from a visual causal analysis tool and combine it with Python when needed.
Visual Causal Analysis with RATH
A powerful alternative is RATH (opens in a new tab), which brings causal analysis into an interactive, no-code environment.
You can:
- Load a dataset (such as the Kaggle Diabetes dataset).
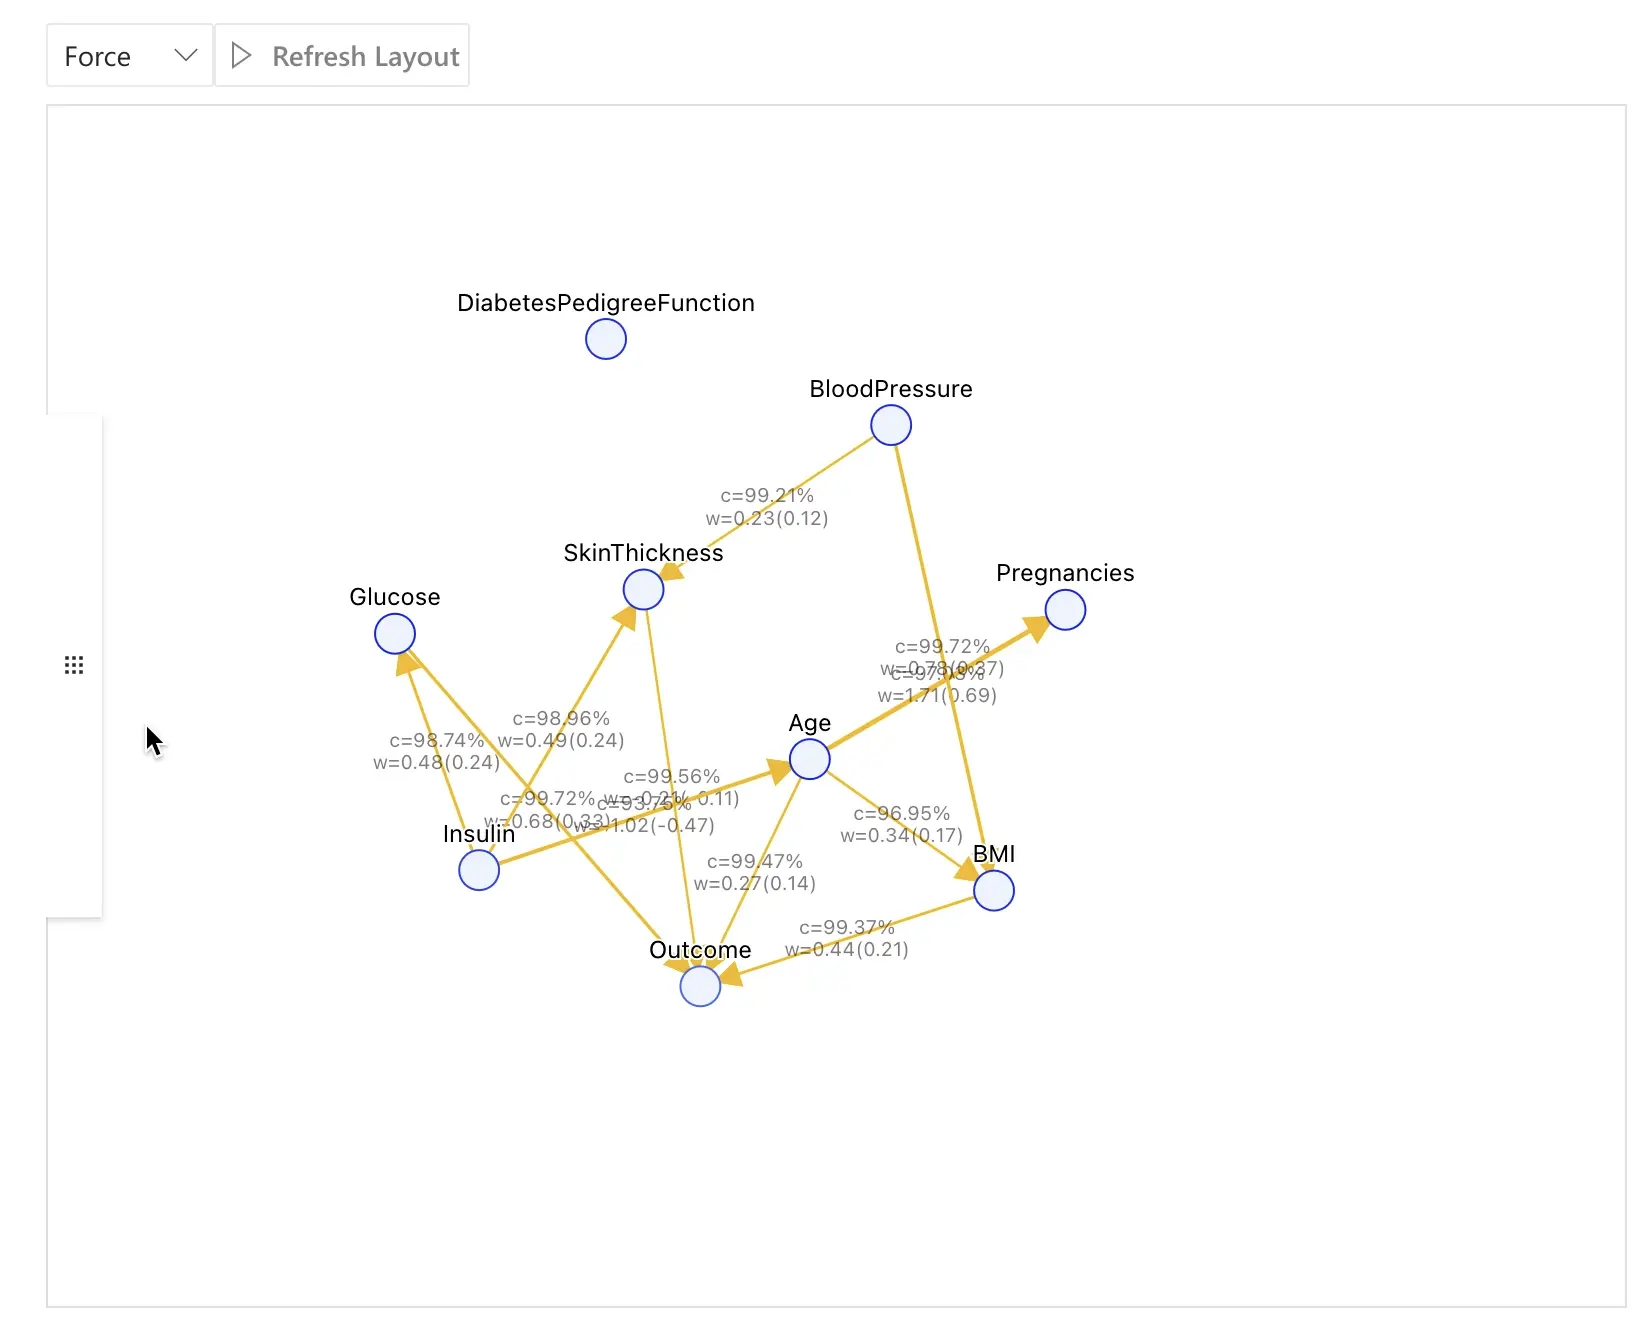
- Run causal discovery to automatically infer a causal graph.
- Click nodes to inspect relationships, run comparative analyses, and generate predictive models.
To see the full workflow in detail, check the step-by-step guide:
Causal Analysis in RATH.
Data Visualization and Causal Analysis
Causal models can quickly become complex. Good visualization is crucial to make sense of them.
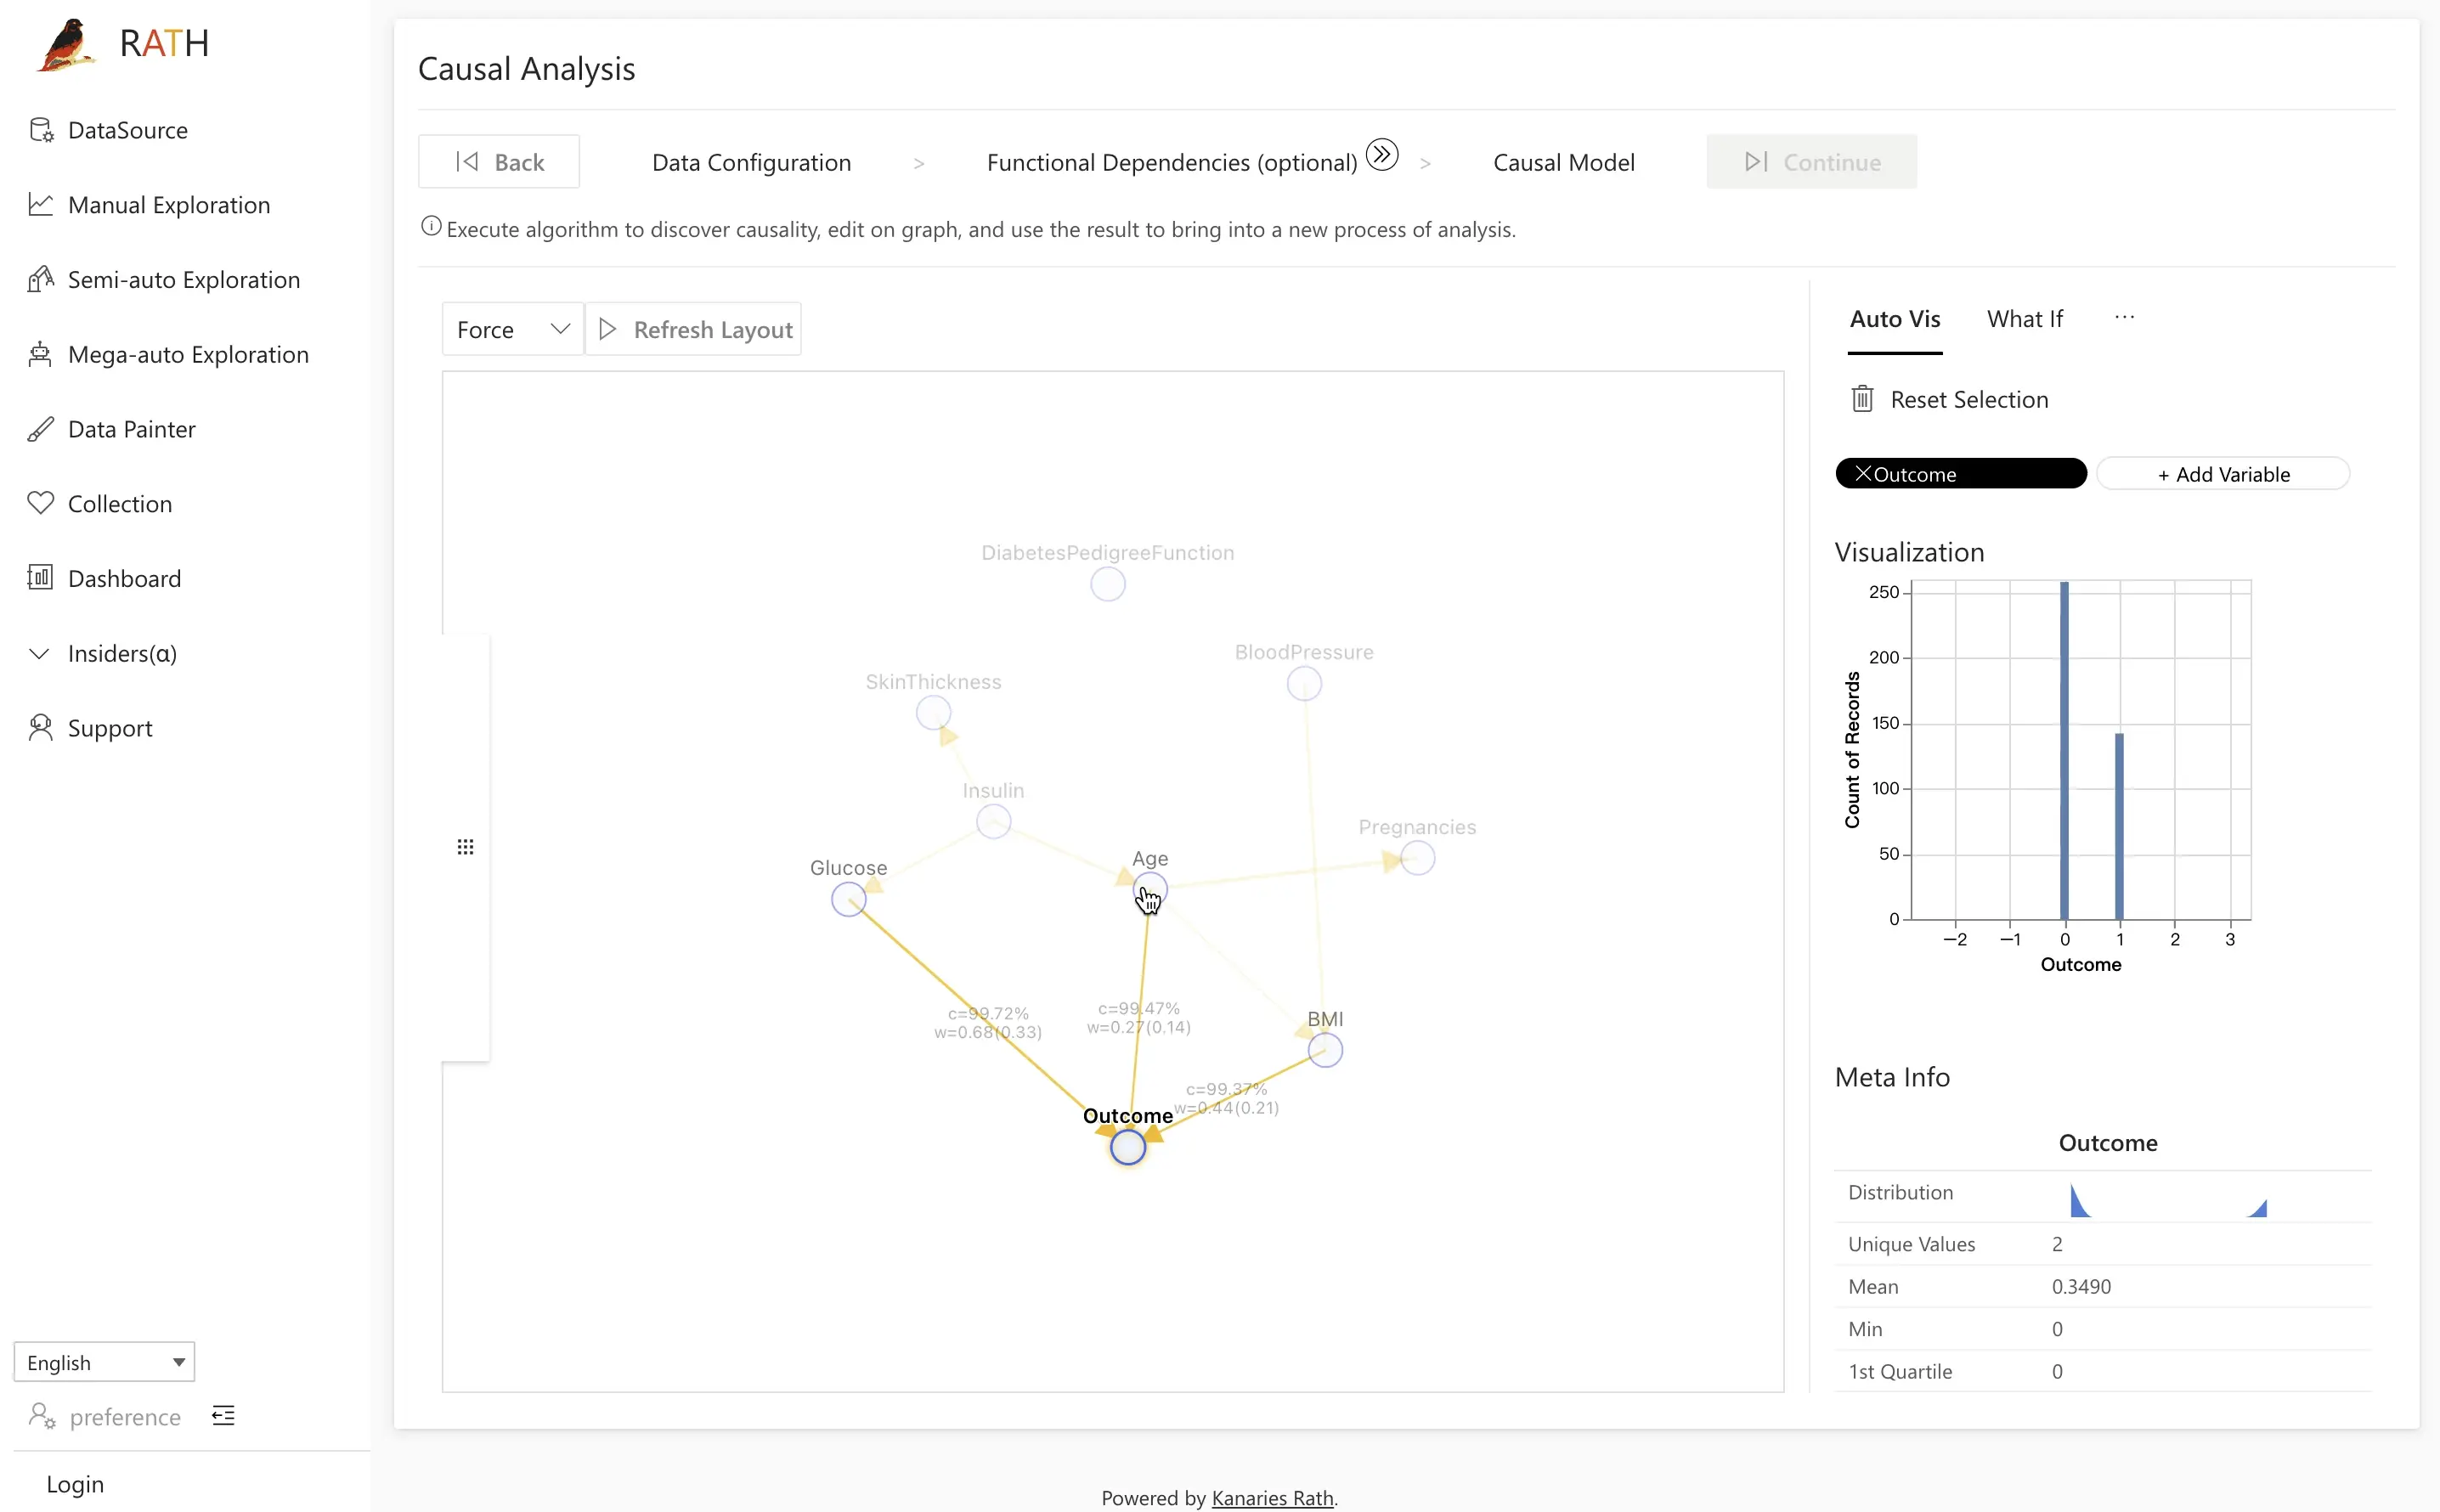
In RATH, the causal model is rendered as an interactive graph:
- Click a node to highlight direct causes and effects.
- Inspect edge strengths to see which factors matter most.
- Use side panels to explore distributions and related views.
Beyond the core graph, RATH offers specialized views that make causal thinking more intuitive:
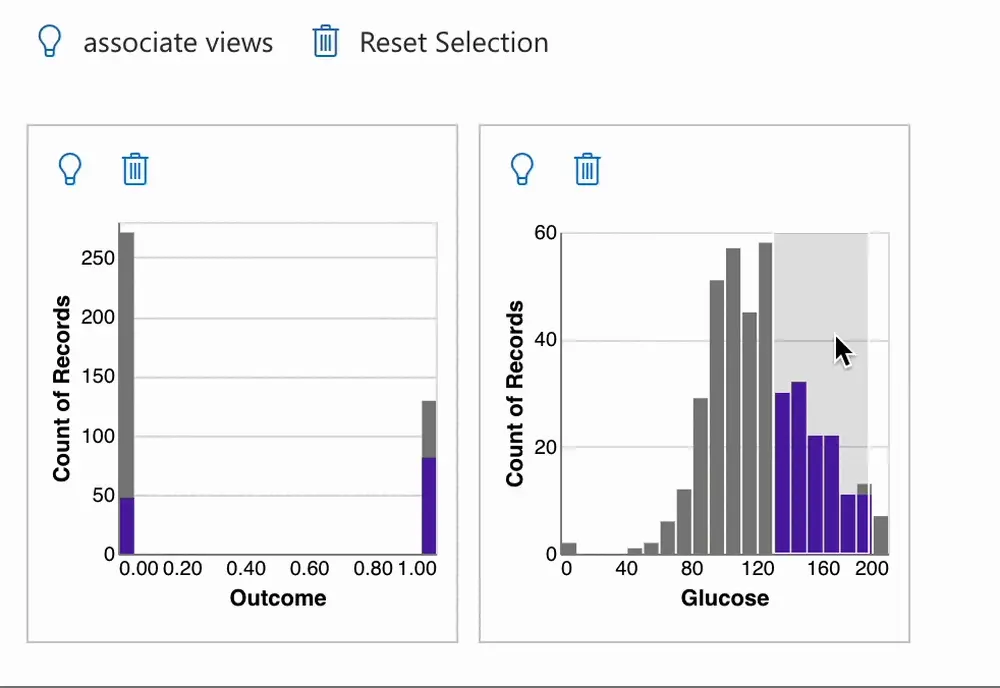
- Comparative Analysis – compare subgroups (e.g., diabetic vs non-diabetic patients) and see which variables drive the differences.
- Mutual Inspection – sweep through ranges of one variable (like
Glucose) and watch how the outcome distribution responds.
These visuals make it much easier to:
- Spot patterns that support or contradict your hypotheses.
- Explain findings to non-technical stakeholders.
- Decide which variables are worth targeting in experiments or interventions.
Tools like Graphic Walker’s Create Data Visualizations can complement this by providing flexible charting on top of your datasets.
Real-World Applications of Causal Analysis
Causal analysis has far-reaching implications across many sectors. Here are a few concrete scenarios.
Healthcare
- Does a new treatment actually reduce hospital readmissions?
- Are certain lifestyle factors causing higher risk for specific diseases?
By identifying causal drivers of health outcomes, clinicians and researchers can design targeted prevention strategies, test therapies properly, and allocate resources where they create the biggest impact.
You can, for example, build a causal model of the diabetes dataset in RATH and then use the Prediction Test feature to train models guided by that structure:
Education
- Which teaching methods most strongly influence student performance?
- Do smaller class sizes cause better outcomes, or are they just correlated with better-funded schools?
Causal analysis helps policymakers and educators distinguish what truly works from what merely looks good in descriptive stats, leading to fairer and more effective interventions.
Finance
- Does a new risk model or policy change actually reduce default rates?
- Are specific macro factors causing market movements, or are they just happening at the same time?
By focusing on causal links instead of raw correlations, investors and risk teams can build more robust strategies and avoid being misled by spurious patterns.
Conclusion
Causal analysis goes beyond “things that move together” and asks the harder question:
“If we change X, what happens to Y?”
By combining:
- rigorous methods (experiments, observational techniques),
- statistical tooling (Python libraries like DoWhy, EconML, CausalML),
- and modern visualization platforms (RATH, Graphic Walker),
you can:
- uncover genuine cause-and-effect relationships,
- design better interventions and products,
- and communicate insights clearly to decision-makers.
If you want to see causal analysis in action on a real dataset, your next stop should be:
👉 Causal Analysis in RATH – a hands-on walkthrough of building and exploring a visual causal model.