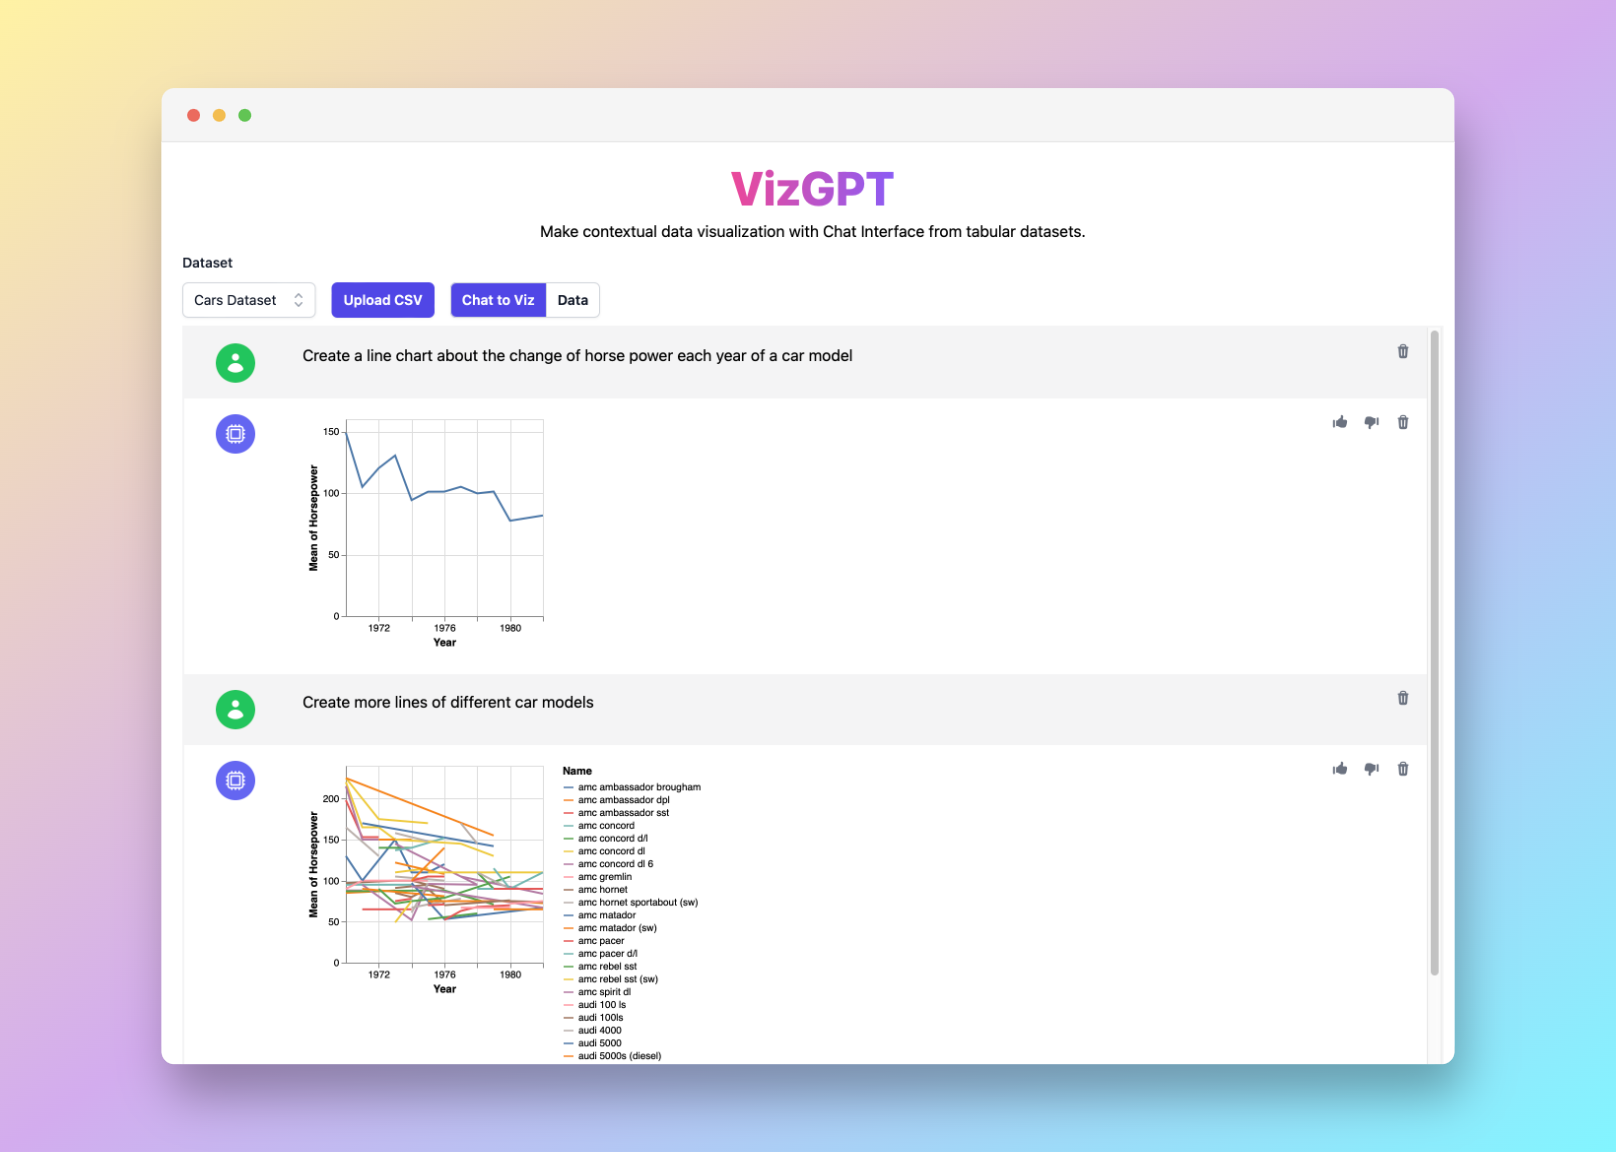
Line Chart Maker: Effortless Line Graph Creation
Here's how to get started:
- Press the Upload CSV button to input your data.
- Ask VizGPT to create a histogram.
- Click the Visualize button to watch your data transform into a meaningful histogram.
This user-friendly tool, powered by ChatGPT, makes line graph creation simple. You don't need any special skills or software knowledge to use it. The tool allows you to add multiple data points, adjust your line style and color, and even generate a best-fit line on your graph with just a few clicks.
The line chart maker offers a myriad of use cases. Teachers and students can use it to create line graphs for school projects or scientific reports. Business professionals can use it to visualize data trends and present them in reports or presentations. Data scientists and researchers can use it to visually interpret complex data sets.
Needs more power for your charts? We got more tools that are similar to VizGPT (opens in a new tab). Check them out!
Welcome to our Line Chart Maker, a dedicated tool offered as part of the VizGPT suite that makes the process of creating line graphs quick and effortless. Whether you're illustrating trends over time, comparing multiple variables, or showcasing the relationship between two sets of data, our line chart maker tool is the solution.
How to Use the Line Chart Maker
To use the Line Chart Maker:
- Click on the Upload CSV button to upload your data.
- Ask VizGPT to create a line chart.
- Click on the Visualize button.
Understand Line Charts
Line charts, also known as line graphs, are powerful visualization tools that display data points connected by straight line segments. These are often used to track changes or trends over time. However, they can also be used to compare multiple sets of data or to illustrate the relationship between two variables.
A line chart comprises several elements including the X and Y-axes, data points, and the line. The X-axis typically represents time intervals or categories, while the Y-axis represents the measured value. The data points are plotted on this graph, and the line is drawn to connect these points.
When you use our Line Chart Maker, you have the power to customize these elements to best represent your data.
Conclusion
With the Line Chart Maker, creating professional-looking line graphs has never been easier. Use this tool to make your data presentations more insightful and impactful. The Line Chart Maker, a part of the VizGPT suite, simplifies data visualization, making it accessible to everyone. Explore this tool now and take your data visualization to the next level.
Frequently Asked Questions
1. How can I make a line graph?
Making a line graph typically involves selecting your data and using a software tool or online platform to plot the data points. Common tools include Excel, Google Sheets, or specialized graphing software.
2. How do you make a free line graph?
You can make a free line graph using various online platforms like Google Sheets, which offers free graphing tools, or websites like Plotly and Desmos. Simply input your data and select the line graph option to visualize it.
3. How do I create a line chart in Excel?
To create a line chart in Excel:
- Highlight the data you want to include in the graph.
- Click on the 'Insert' tab.
- Choose the 'Line Chart' option.
- Select the style of line chart you prefer.
Excel will then generate the line chart for you.
4. Which app can I use to draw a line graph?
There are several apps for creating line graphs. Some popular options include Microsoft Excel, Google Sheets, Plotly, Desmos, and GraphPad Prism. The best app for you depends on your specific needs and platform preferences.

