
Top 10 growing data visualization libraries in Python in 2023
Python's robust visualization ecosystem means users have numerous libraries at their disposal. While this offers flexibility, it's crucial to understand each library's strengths and limitations. Let's delve deeper into the new trending of the top 10 data visualizatio Python libraries in 2023.
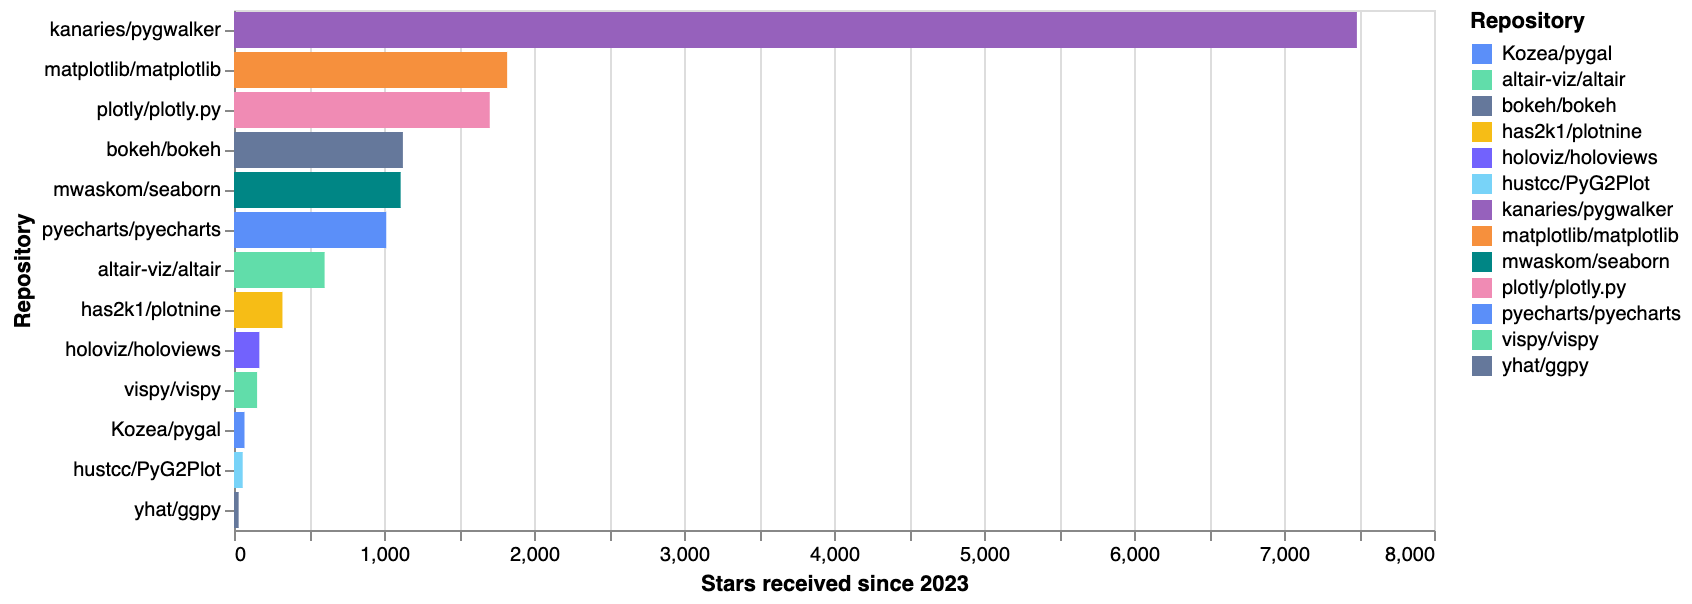
The ranking is based on the stars received by the library's github repo in 2023. The more stars it received, the higher it ranks.
No. 1 PyGWalker
Stars received by kanaries/pygwalker since 2023: 7486
The most popular data visualization python library in 2023. It turns your dataframe into a interactive data exploration app like tableau/powerBI with one line of code.
 (opens in a new tab)
It provides simple drag-and-drop/chat interface for you to build charts.
It can run in juypter notebook, which means you do not need to switch between your code and the visualization app.
Besides, you can also build interative spitial visualization on maps with it.
(opens in a new tab)
It provides simple drag-and-drop/chat interface for you to build charts.
It can run in juypter notebook, which means you do not need to switch between your code and the visualization app.
Besides, you can also build interative spitial visualization on maps with it.
(opens in a new tab)
And it also have Javascript and R version.
- Pros: Interactive data exploration app with one line of code; drag-and-drop/chat interface; interactive spitial visualization on maps.
- Cons: Not very flexible to customizable styles;
Github: https://github.com/Kanaries/pygwalker (opens in a new tab)
No. 2 Matplotlib
Stars received by matplotlib/matplotlib since 2023: 1821
Matplotlib is a very tradictional data visualization library in Python published in 2003. It is the foundation of many other libraries, such as seaborn, pygal, and so on. It is very flexible and customizable, but it is also very verbose and not very efficient, which usually requires extensive code for simple visualizations.

- Pros: Foundation for many other libraries; highly customizable.
- Cons: Steeper learning curve; can require extensive code for simple visualizations; aesthetics might seem outdated.
Github: https://github.com/matplotlib/matplotlib (opens in a new tab)
No. 3 Plotly
Stars received by plotly/plotly.py since 2023: 1705
Plotly is also a multi-platform data visualization library like pygwalker. Plotly's company also build Dash, which can turn your plotly charts code into a web app like a dashboard.
- Pros: Delivers interactive, web-ready visualizations; can be published as data apps with dash.
- Cons: Online mode requires an internet connection; the free version has limitations on the number of plots and public visibility.

Github: https://github.com/plotly/plotly.py (opens in a new tab)
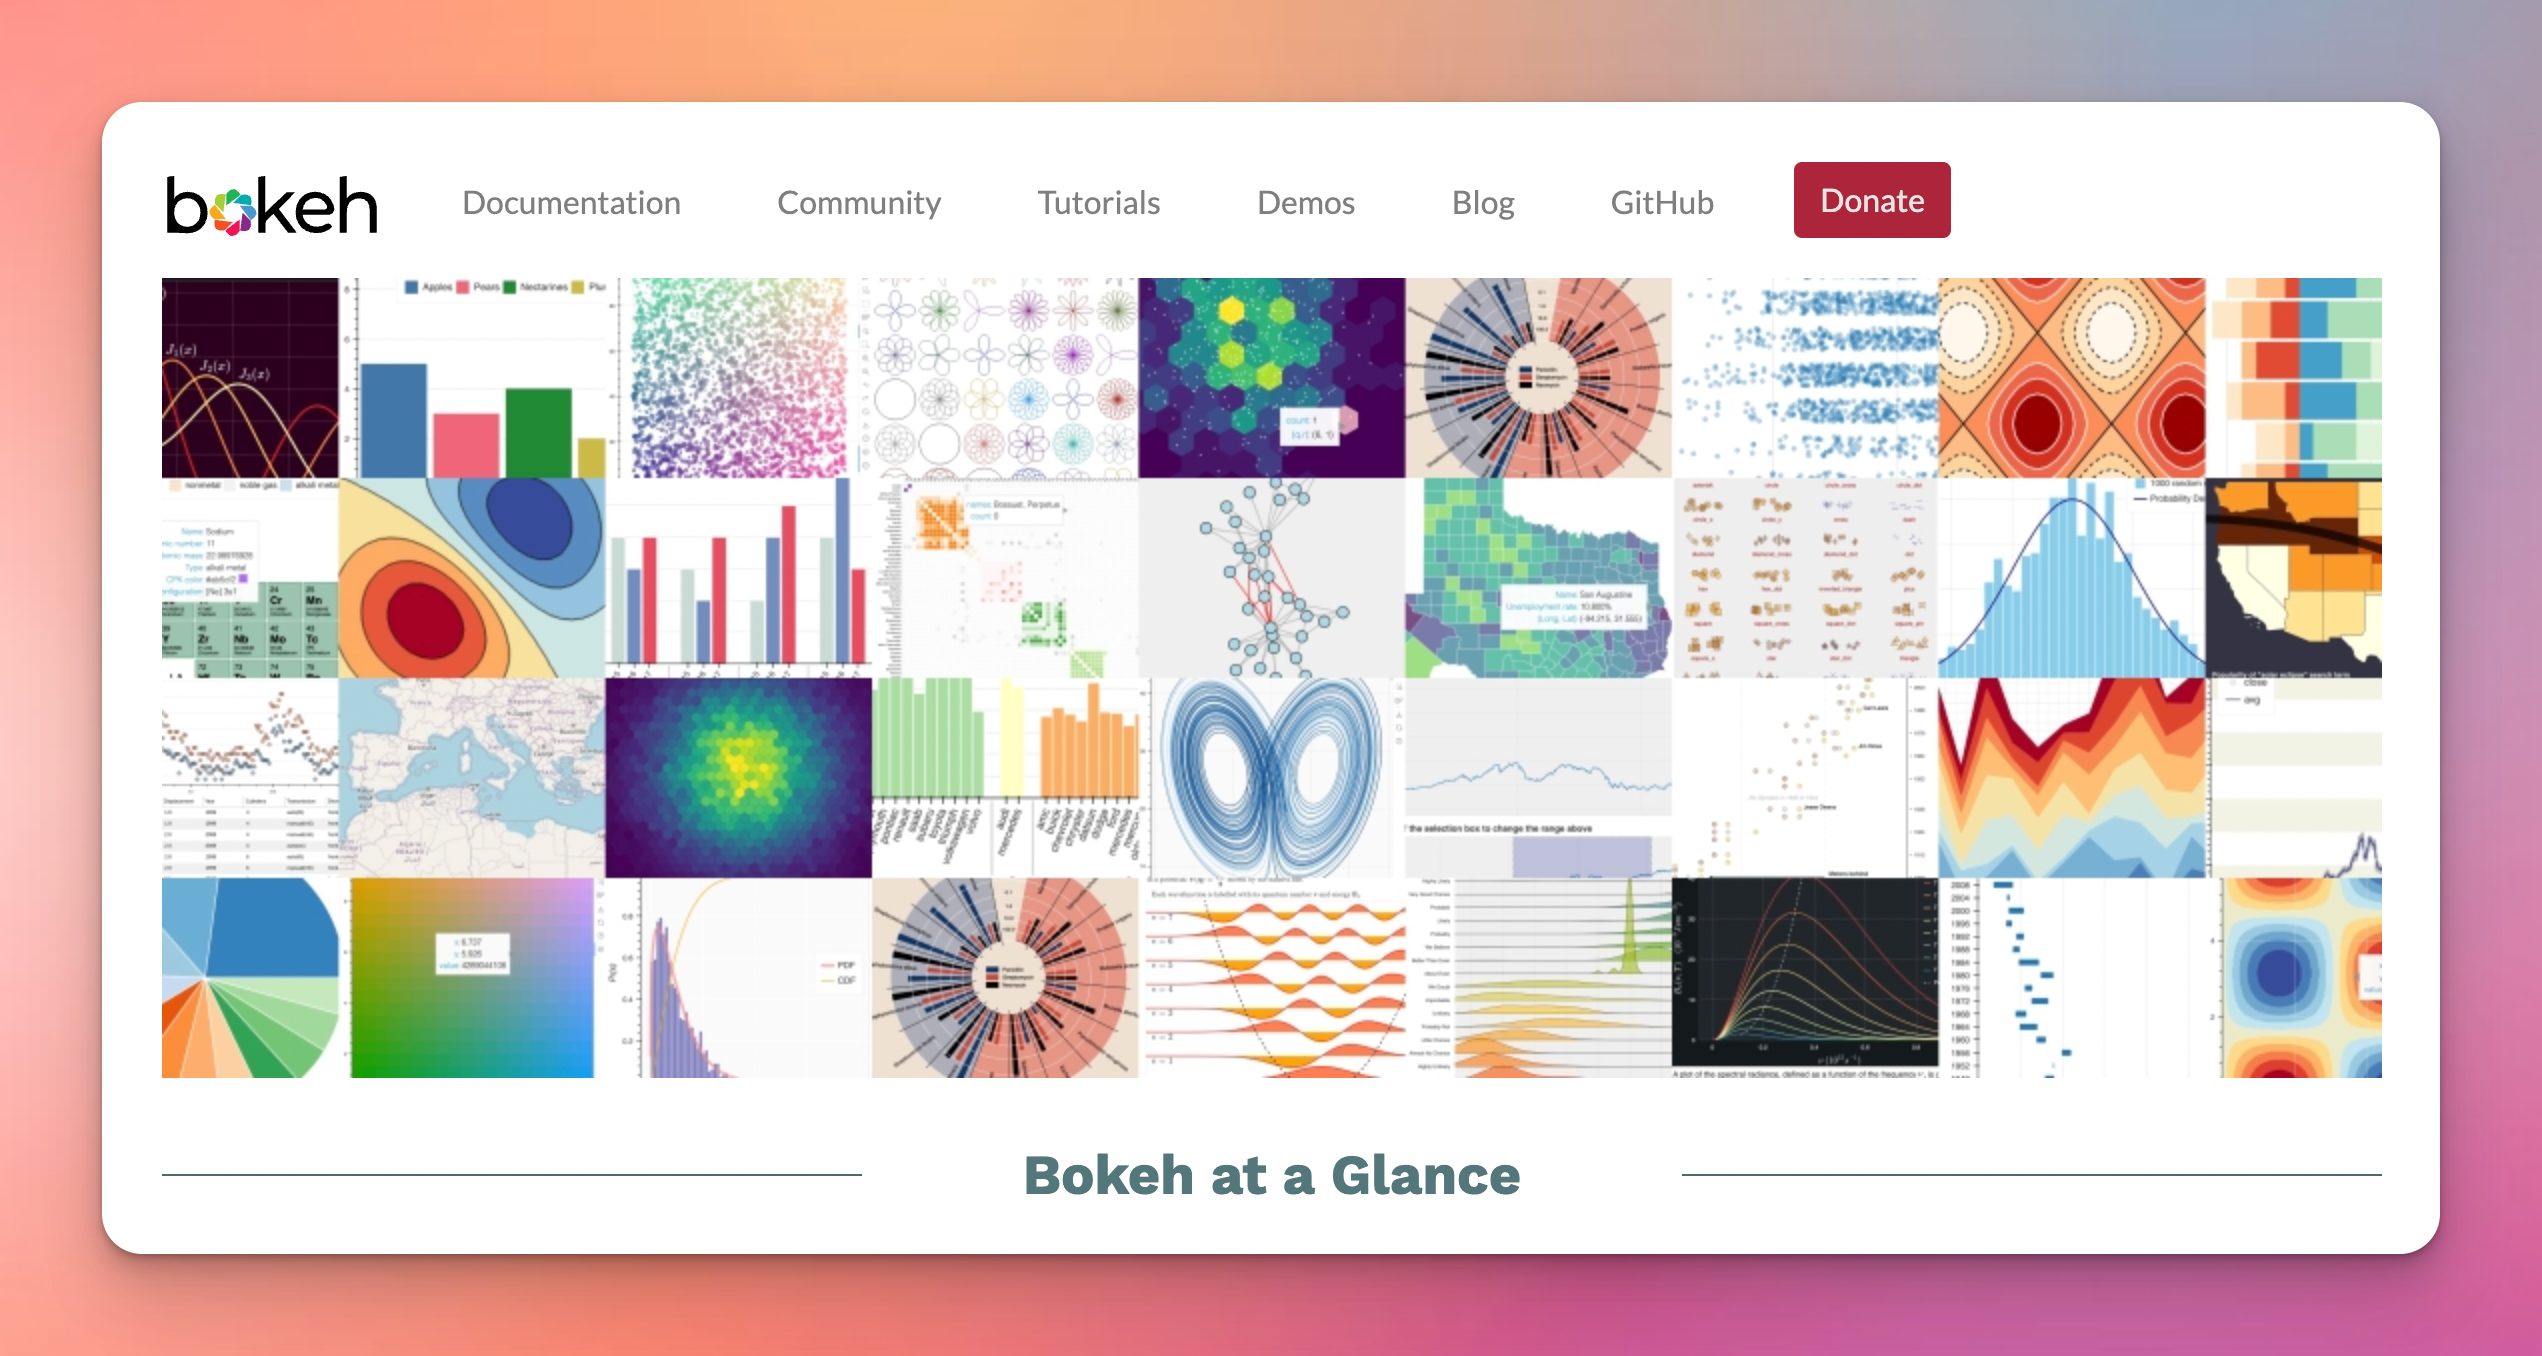
No. 4 Bokeh
Stars received by bokeh/bokeh since 2023: 1126
Bokeh is created by Anaconda, which is a very famous company in data science world. published date: 2013
- Pros: Built for interactive web visualizations; handles large datasets efficiently.
- Cons: Syntax may seem unfamiliar to Matplotlib users; more tailored to web applications than static plots.
Github: https://github.com/bokeh/bokeh (opens in a new tab)
No. 5 Seaborn
Stars received by mwaskom/seaborn since 2023: 1111
Seaborn is is build based on matplotlib, which means it benefits from the flexibility of matplotlib, but also inherits the verbosity of matplotlib.
- Pros: Built on Matplotlib with enhanced aesthetics; efficient for statistical plots.
- Cons: Less customizable than Matplotlib; might not be suitable for advanced or non-statistical plots.

Github: https://github.com/mwaskom/seaborn (opens in a new tab)
No. 6 pyecharts
Stars received by pyecharts/pyecharts since 2023: 1015
pyecharts is the python binding of the famous data visualization library apache/echarts in Javascript.
- Pros: support a wide range of chart types, even 3D and webGL.
- Cons: complex options config.
Github: https://github.com/pyecharts/pyecharts (opens in a new tab)
No. 7 Altair
Stars received by altair-viz/altair since 2023: 604
Altair is build based on vega-lite, which is a very famaous data visualization library in Javascript and academic world of visualization. It benefits almost all the advantages of vega-lite, such as declarative approach, web-ready outputs, and so on. The most important advatage is its declarative specification of interaction, which according to vega-lite's paper, as the grammar of interactive graphics.
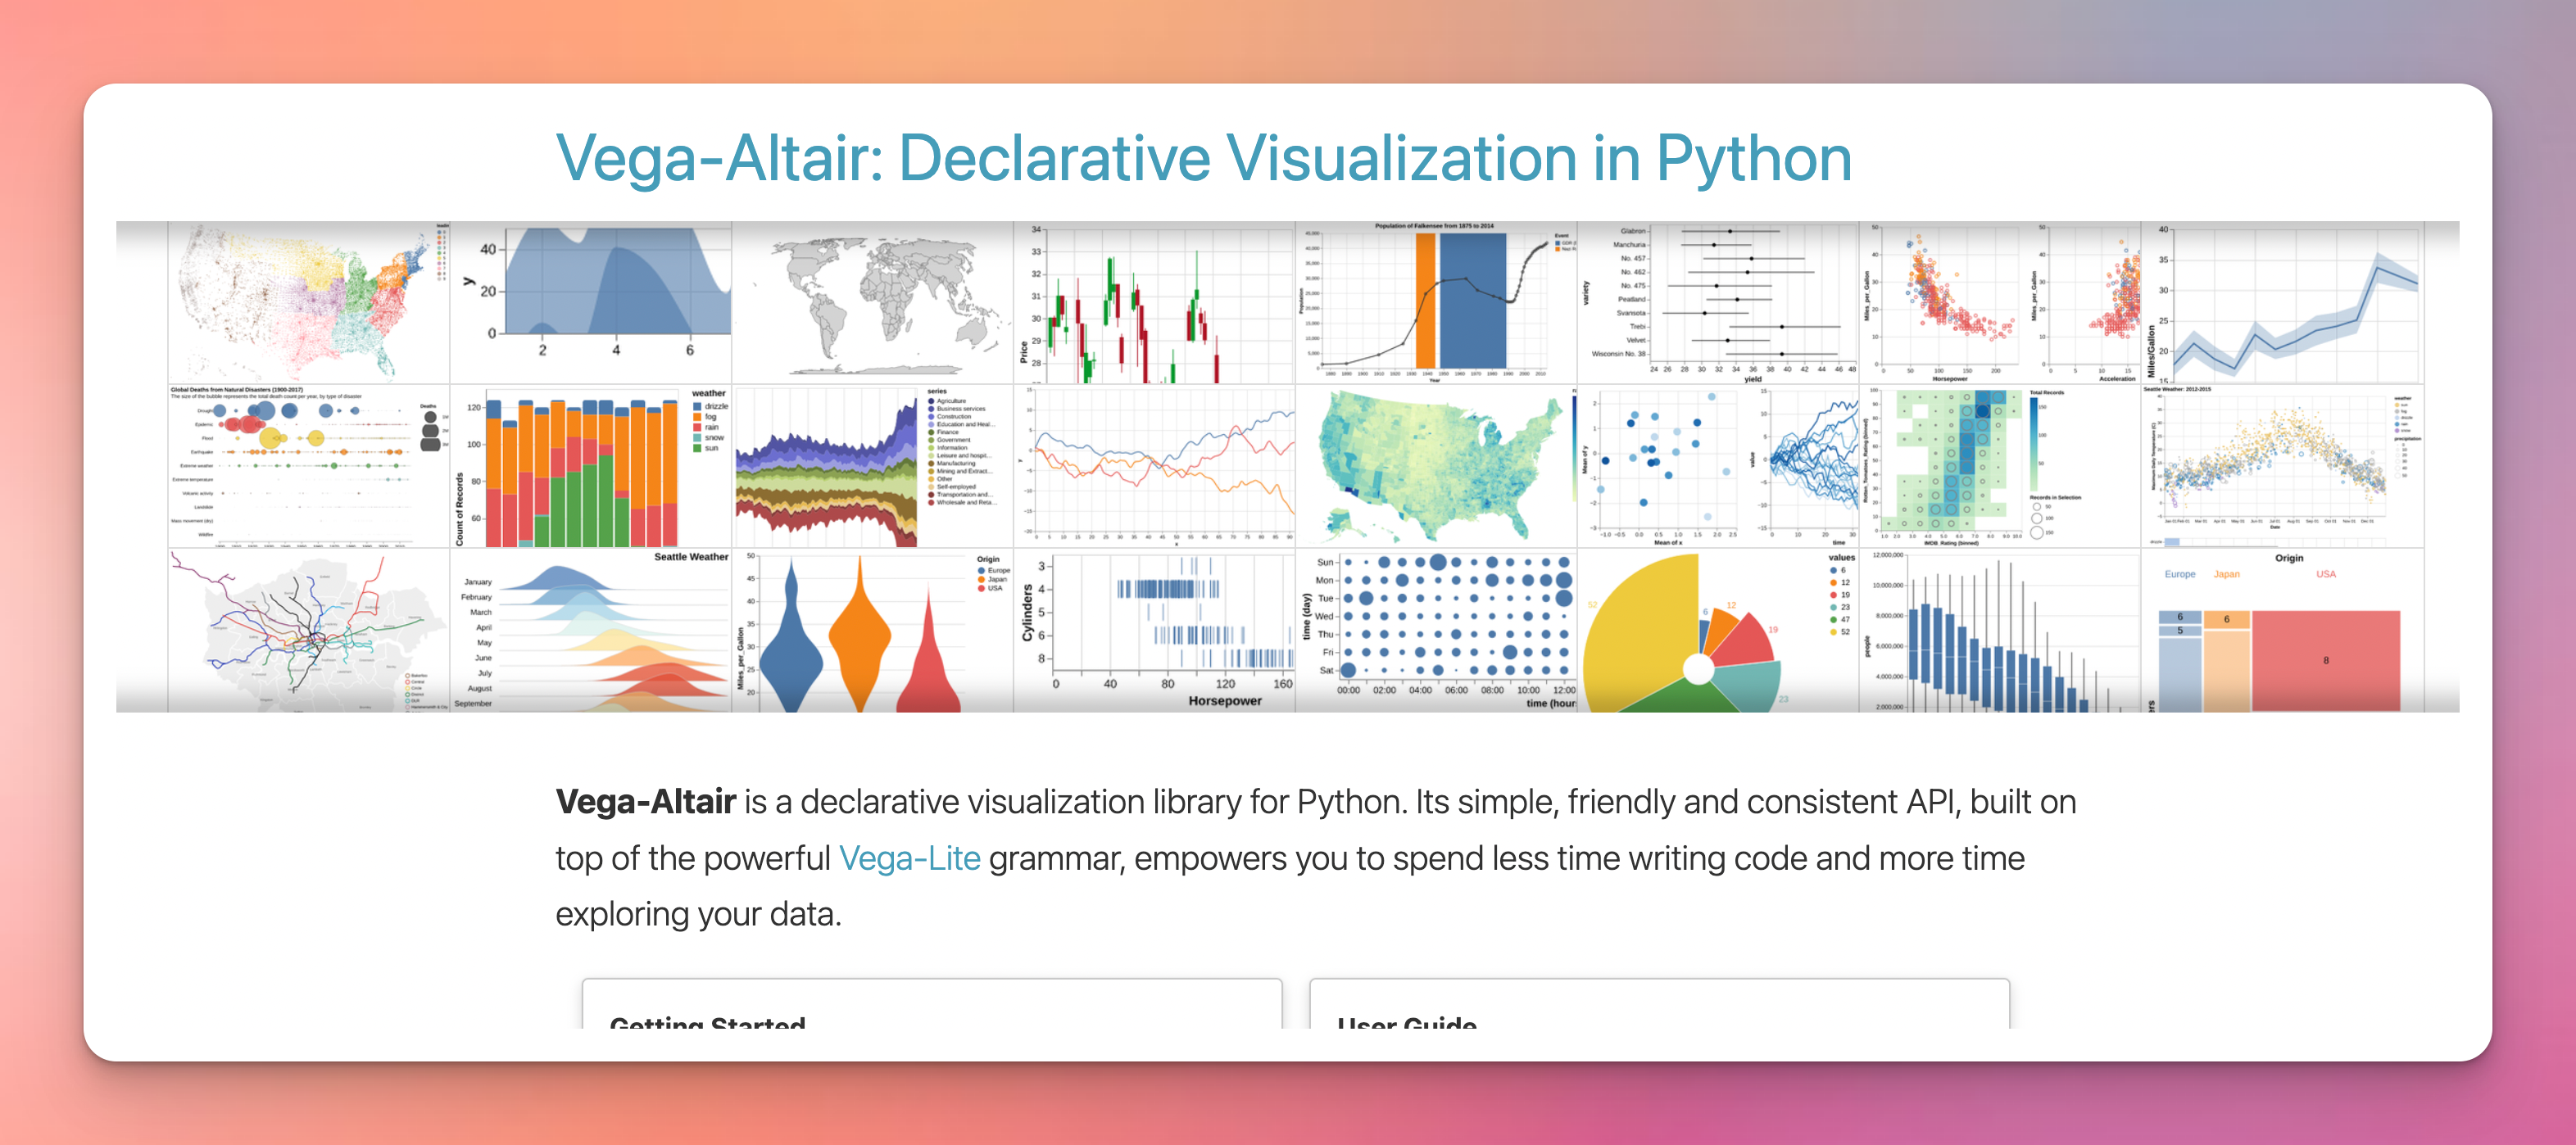
- Pros: Declarative approach simplifies code; generates web-ready outputs. More intuitive operators for making graphics.
- Cons: Due to vega-lite, there is a limit of customization/chart types. Making complex charts might require user to design complex signal flows.
Github: Altair (opens in a new tab)
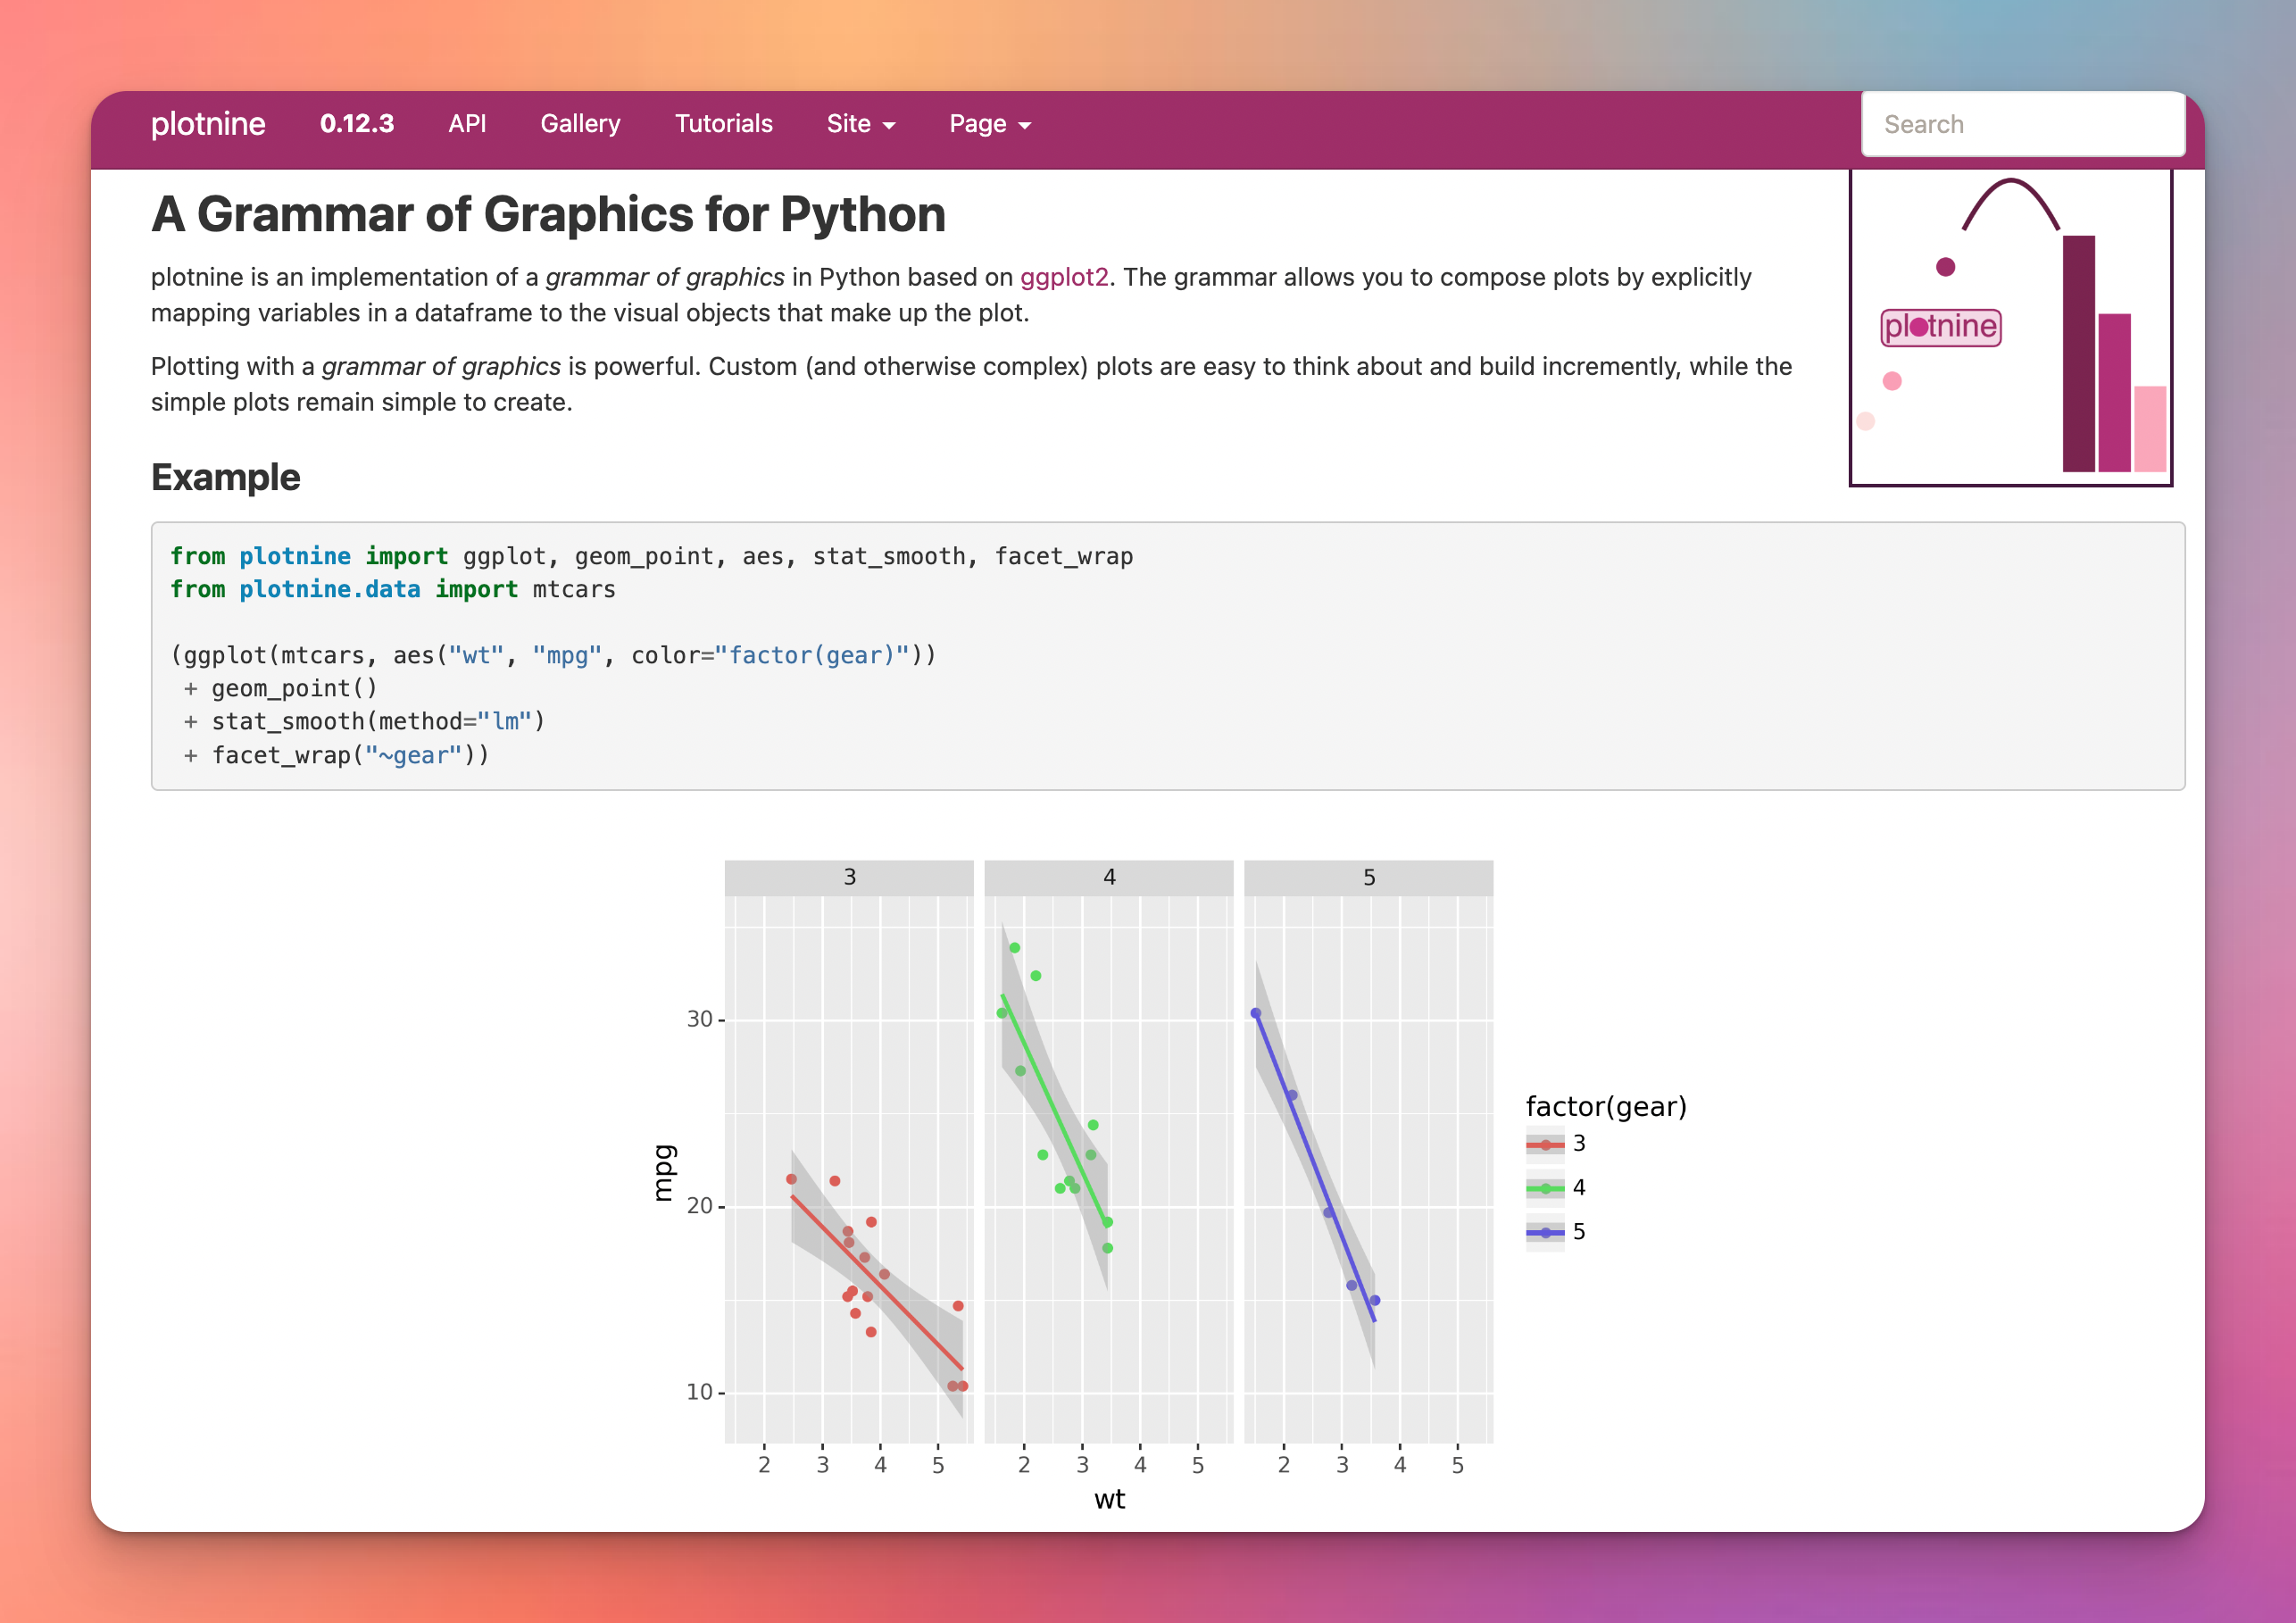
No. 8 plotnine
Stars received by has2k1/plotnine since 2023: 323
plotnine is designed based on the the grammar of graphics, which is a very famous theory in the academic world of visualization. The theory is also the foundation of ggplot2 in R.
Github: https://github.com/has2k1/plotnine (opens in a new tab)
No. 9 Holoviews
Stars received by holoviz/holoviews since 2023: 169
Holoviews is build based on bokeh, which means it benefits from the efficiency of bokeh, but also inherits the unfamiliar syntax of bokeh.
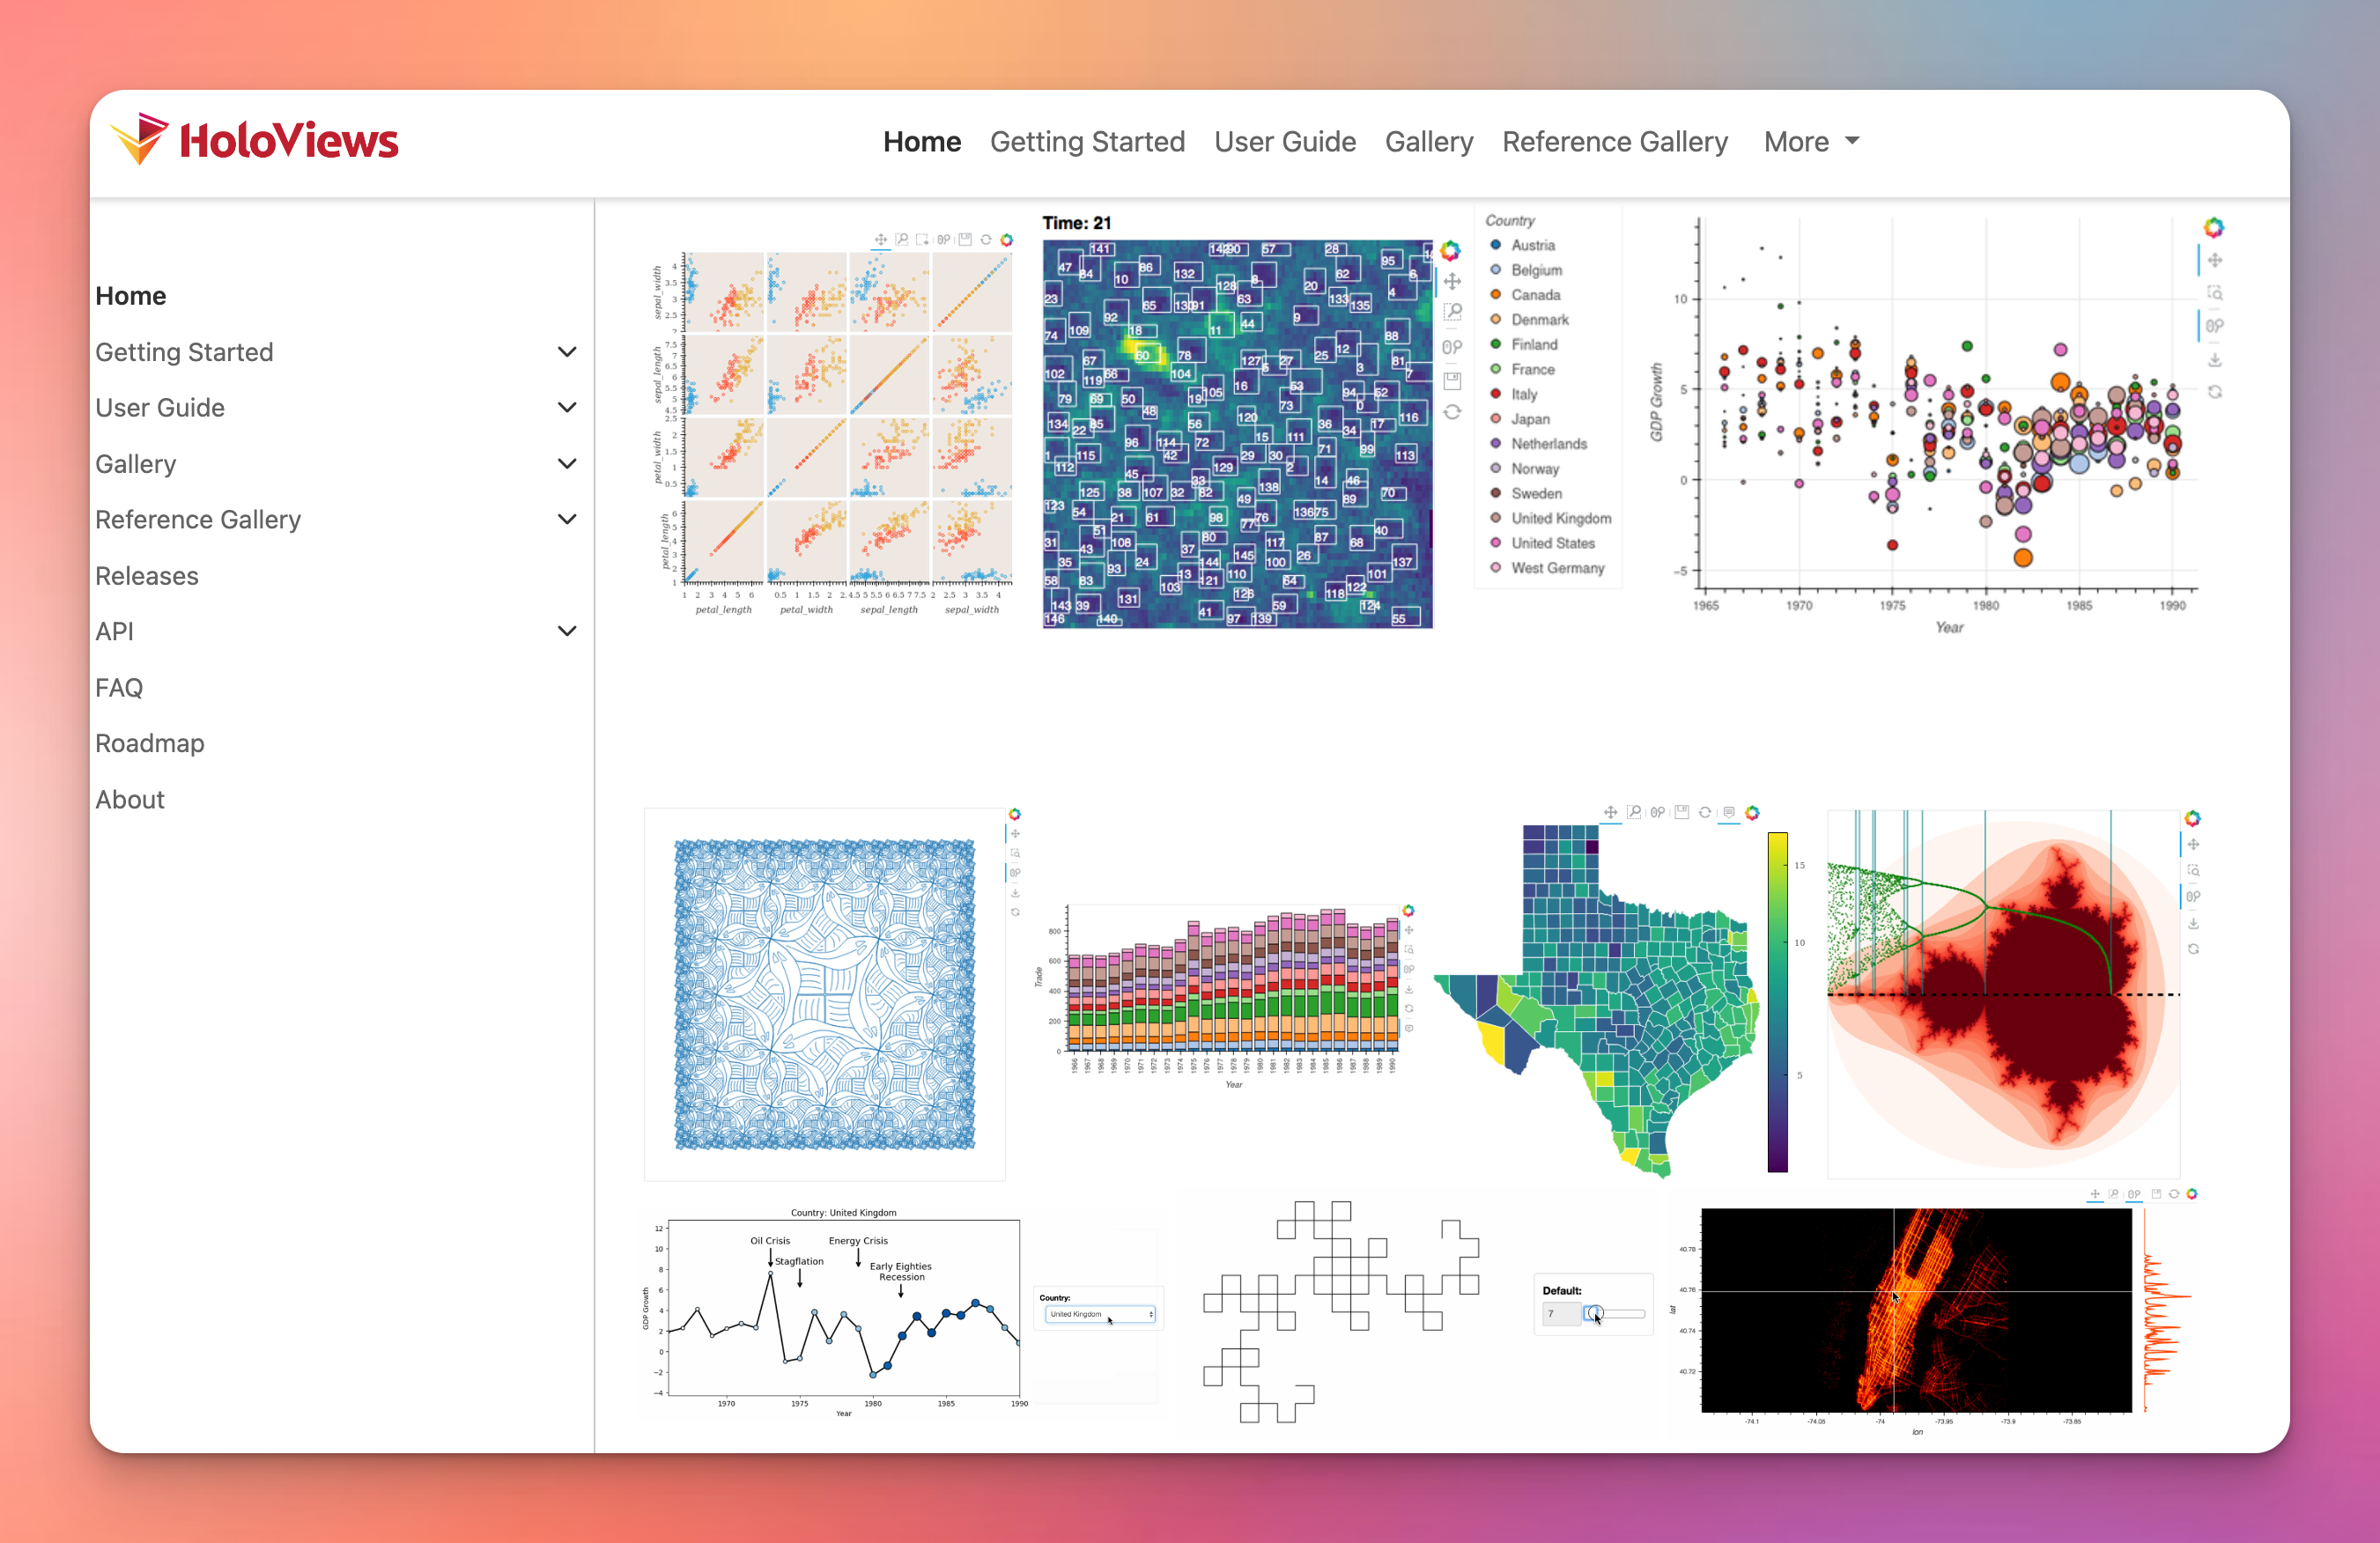
Github: https://github.com/holoviz/holoviews (opens in a new tab)
No. 10 vispy
Stars received by vispy/vispy since 2023: 154
vispy is targeted at users who are interested in OpenGL. It provides some low-level APIs for users to build more flexible and customizable graphics.
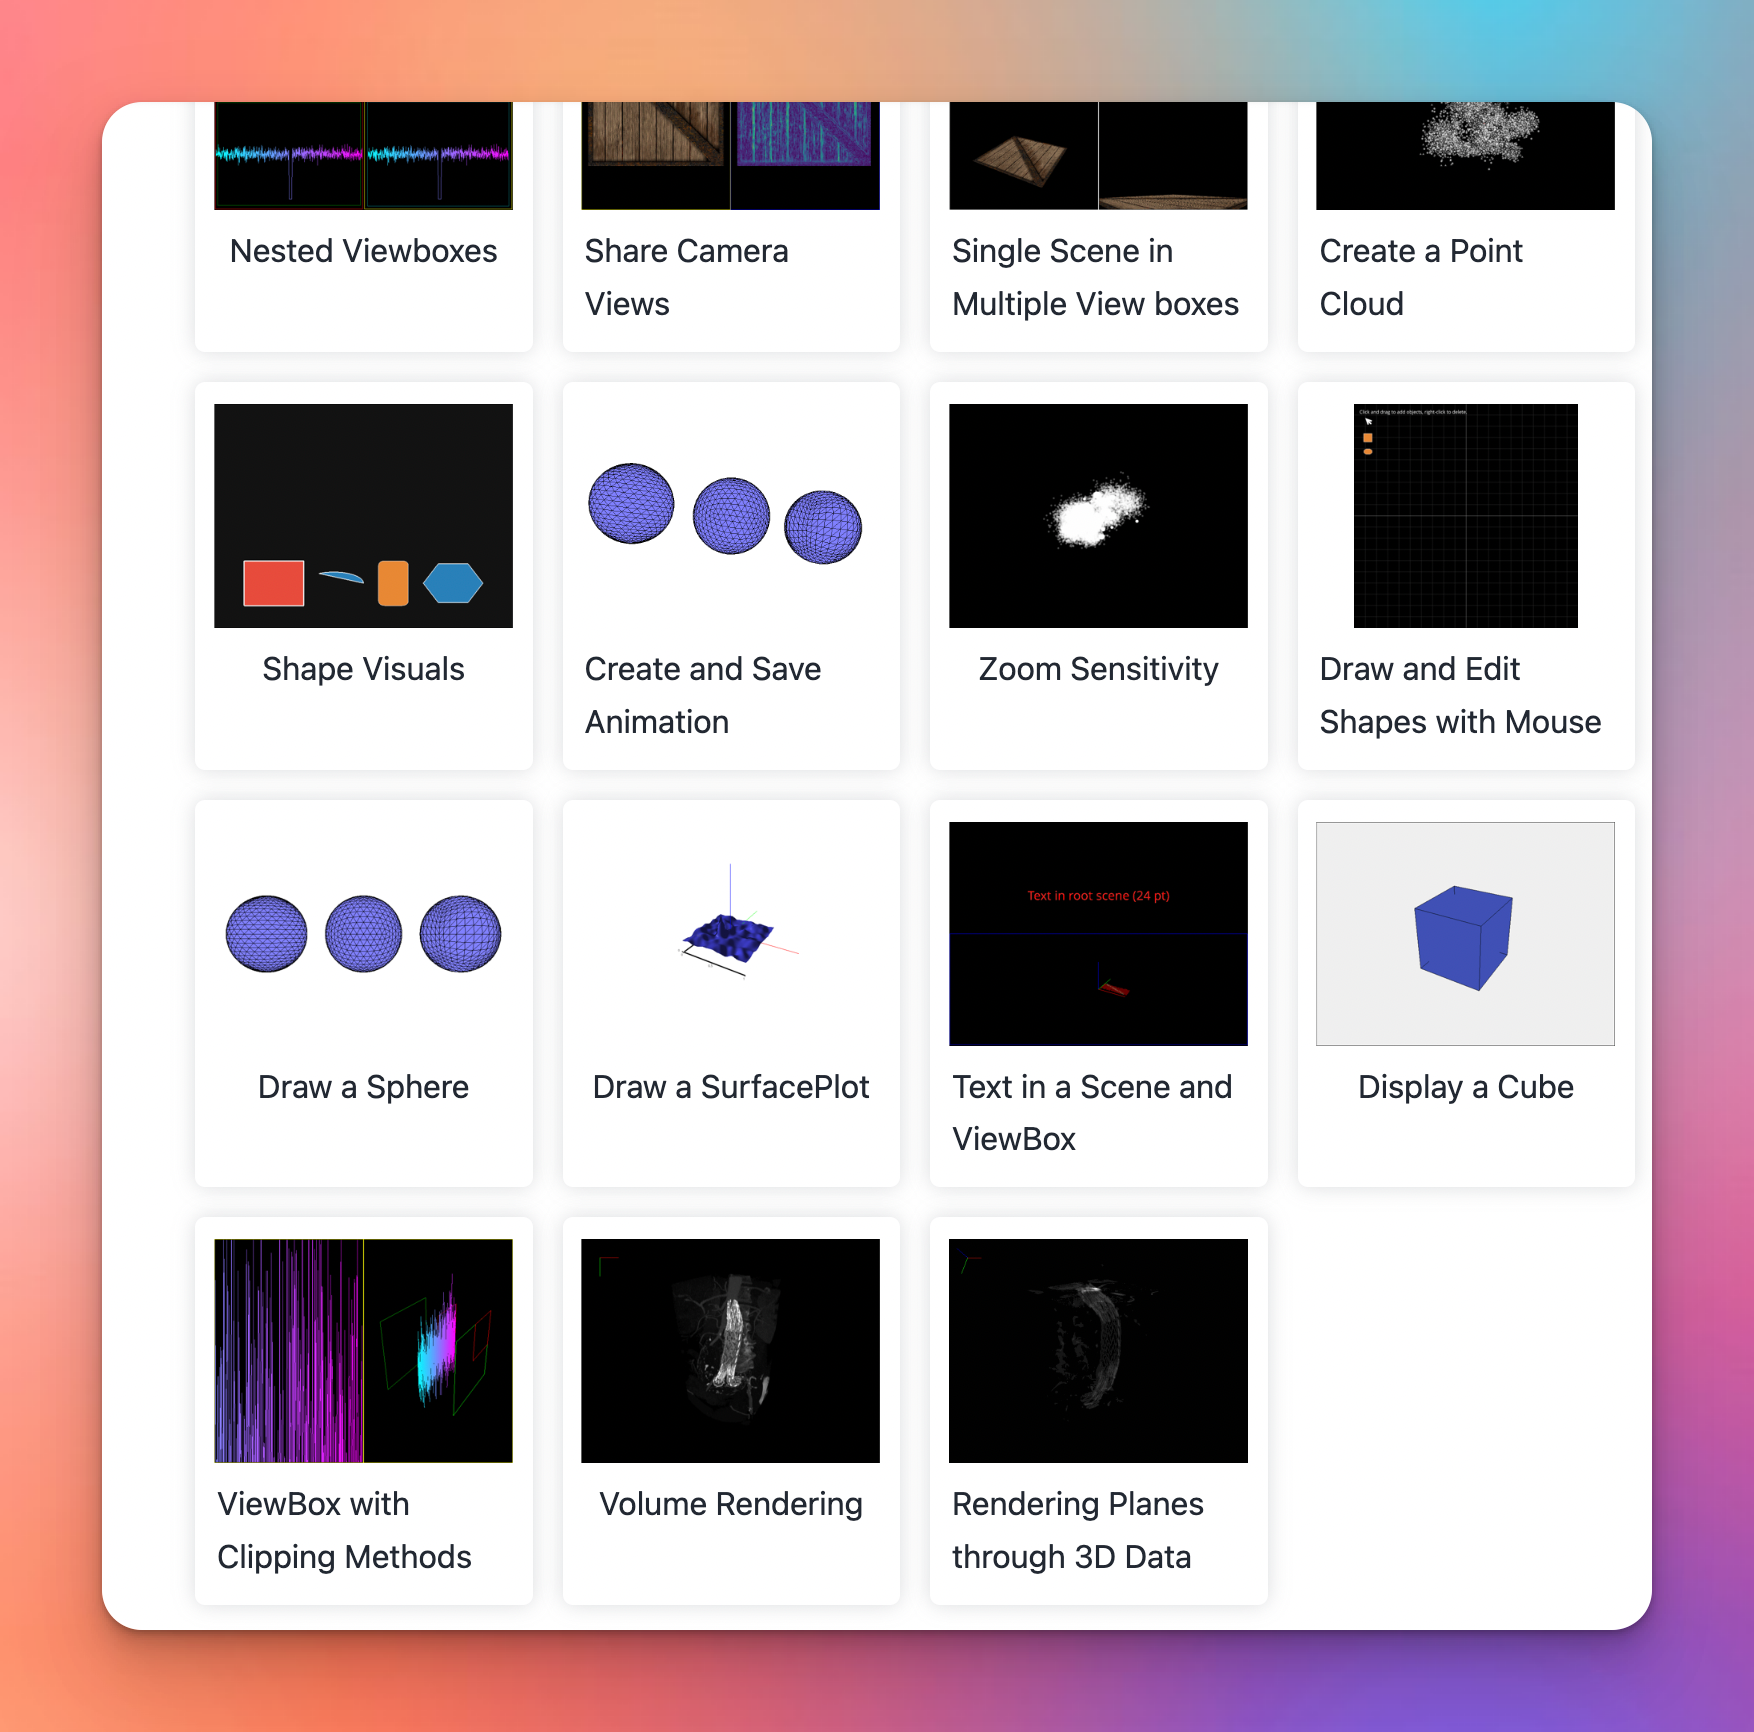
Github: https://github.com/vispy/vispy (opens in a new tab)
Conclusion
In 2023, Python's data visualization landscape is rich and varied, with PyGWalker (opens in a new tab) leading the charge towards intuitive, interactive exploration tools. While traditional powerhouses like Matplotlib remain relevant, there's a notable shift towards web-ready and interactive visualizations, as seen with Plotly and Bokeh. The diversity in this top 10 list indicates that the ideal library hinges on project specifics and personal preference.
Key Takeaways:
- PyGWalker's rise signifies the demand for user-friendly, interactive data tools.
- Web-ready visualizations are gaining traction.
- Traditional libraries like Matplotlib still hold importance due to their flexibility.
- The right choice depends on project needs and desired customization.