The Power of ChatGPT Code Interpreter (ADA): Create Data Visualizations Without Writing a Single Line of Code

For years, coding skill was the biggest barrier between raw data and useful insight. That changed when ChatGPT Code Interpreter, now called Advanced Data Analysis (ADA), made it possible to upload a file, describe the analysis you want, and let ChatGPT handle the Python work for you.
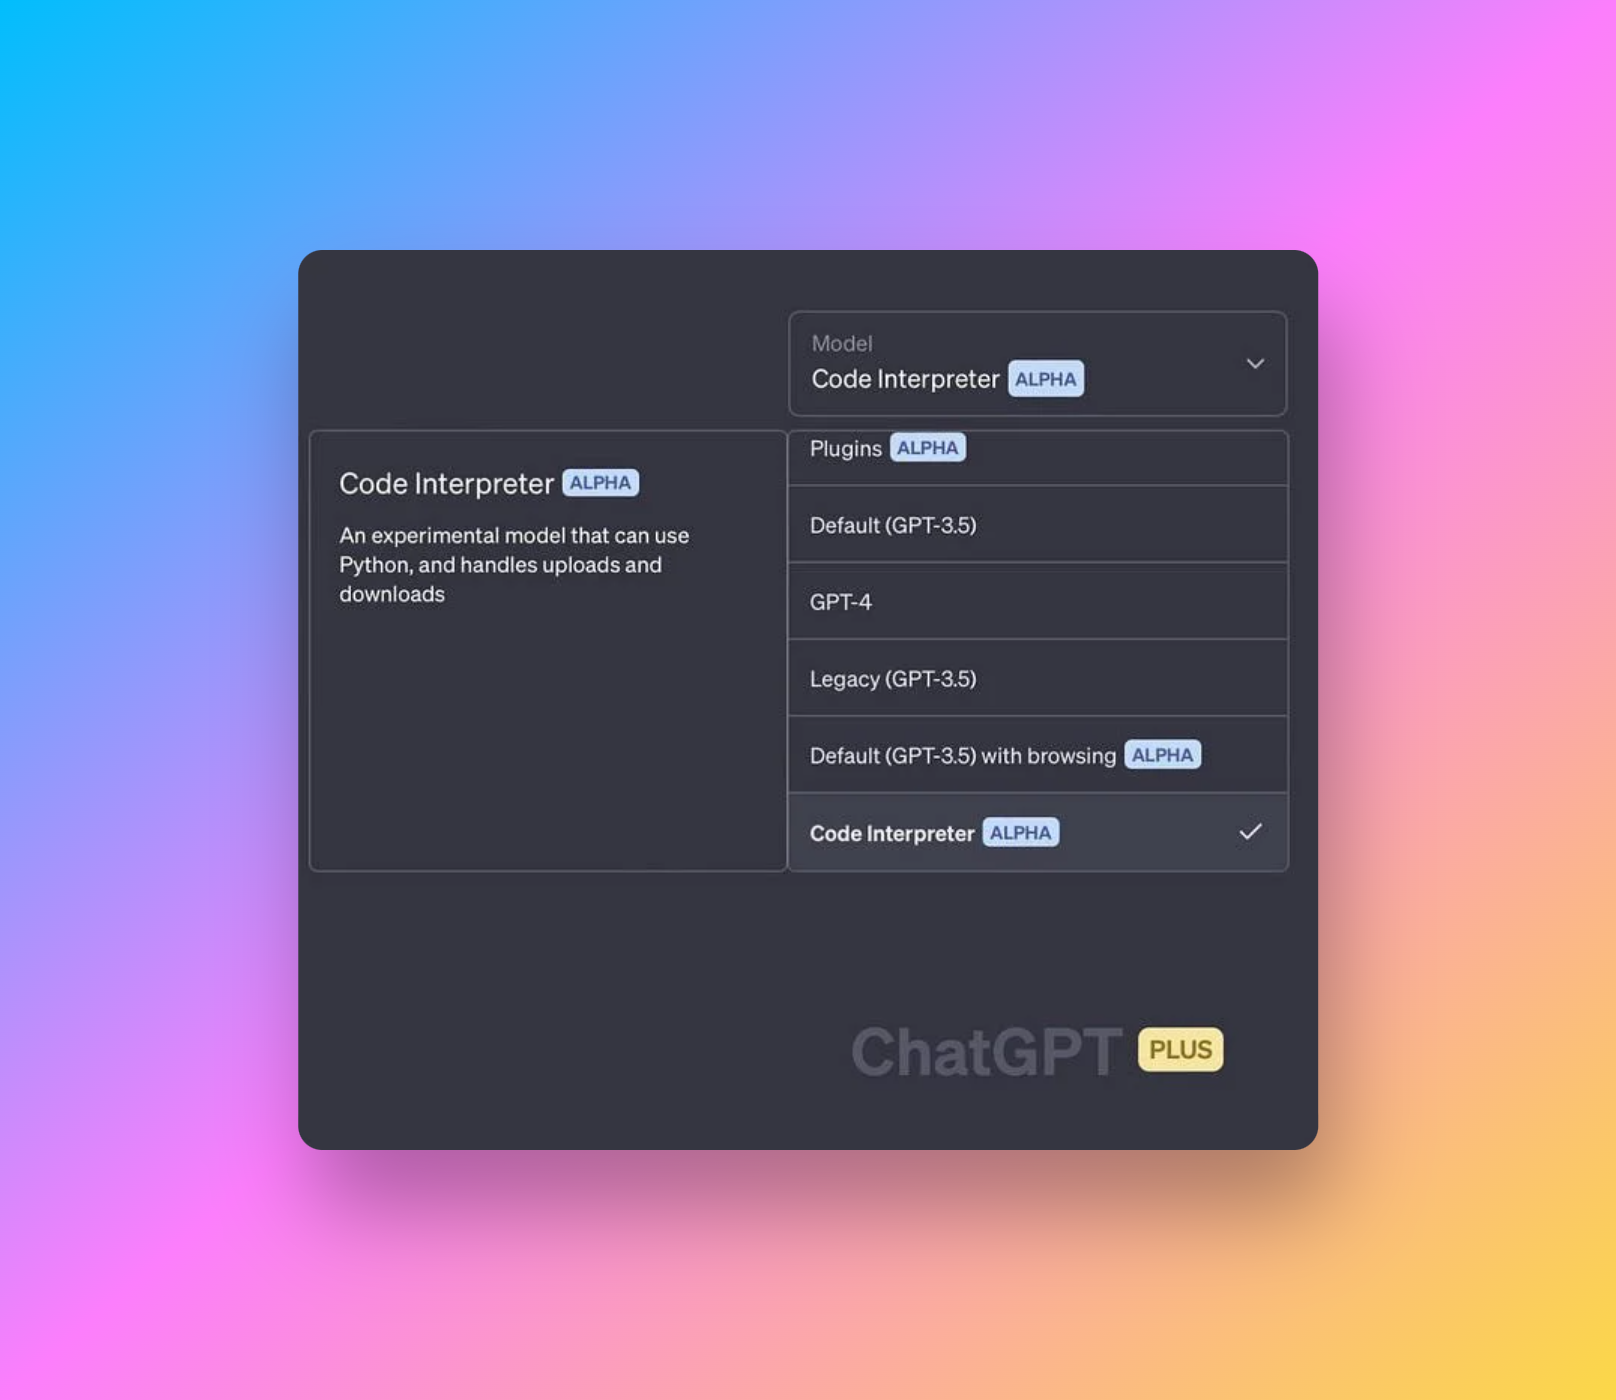
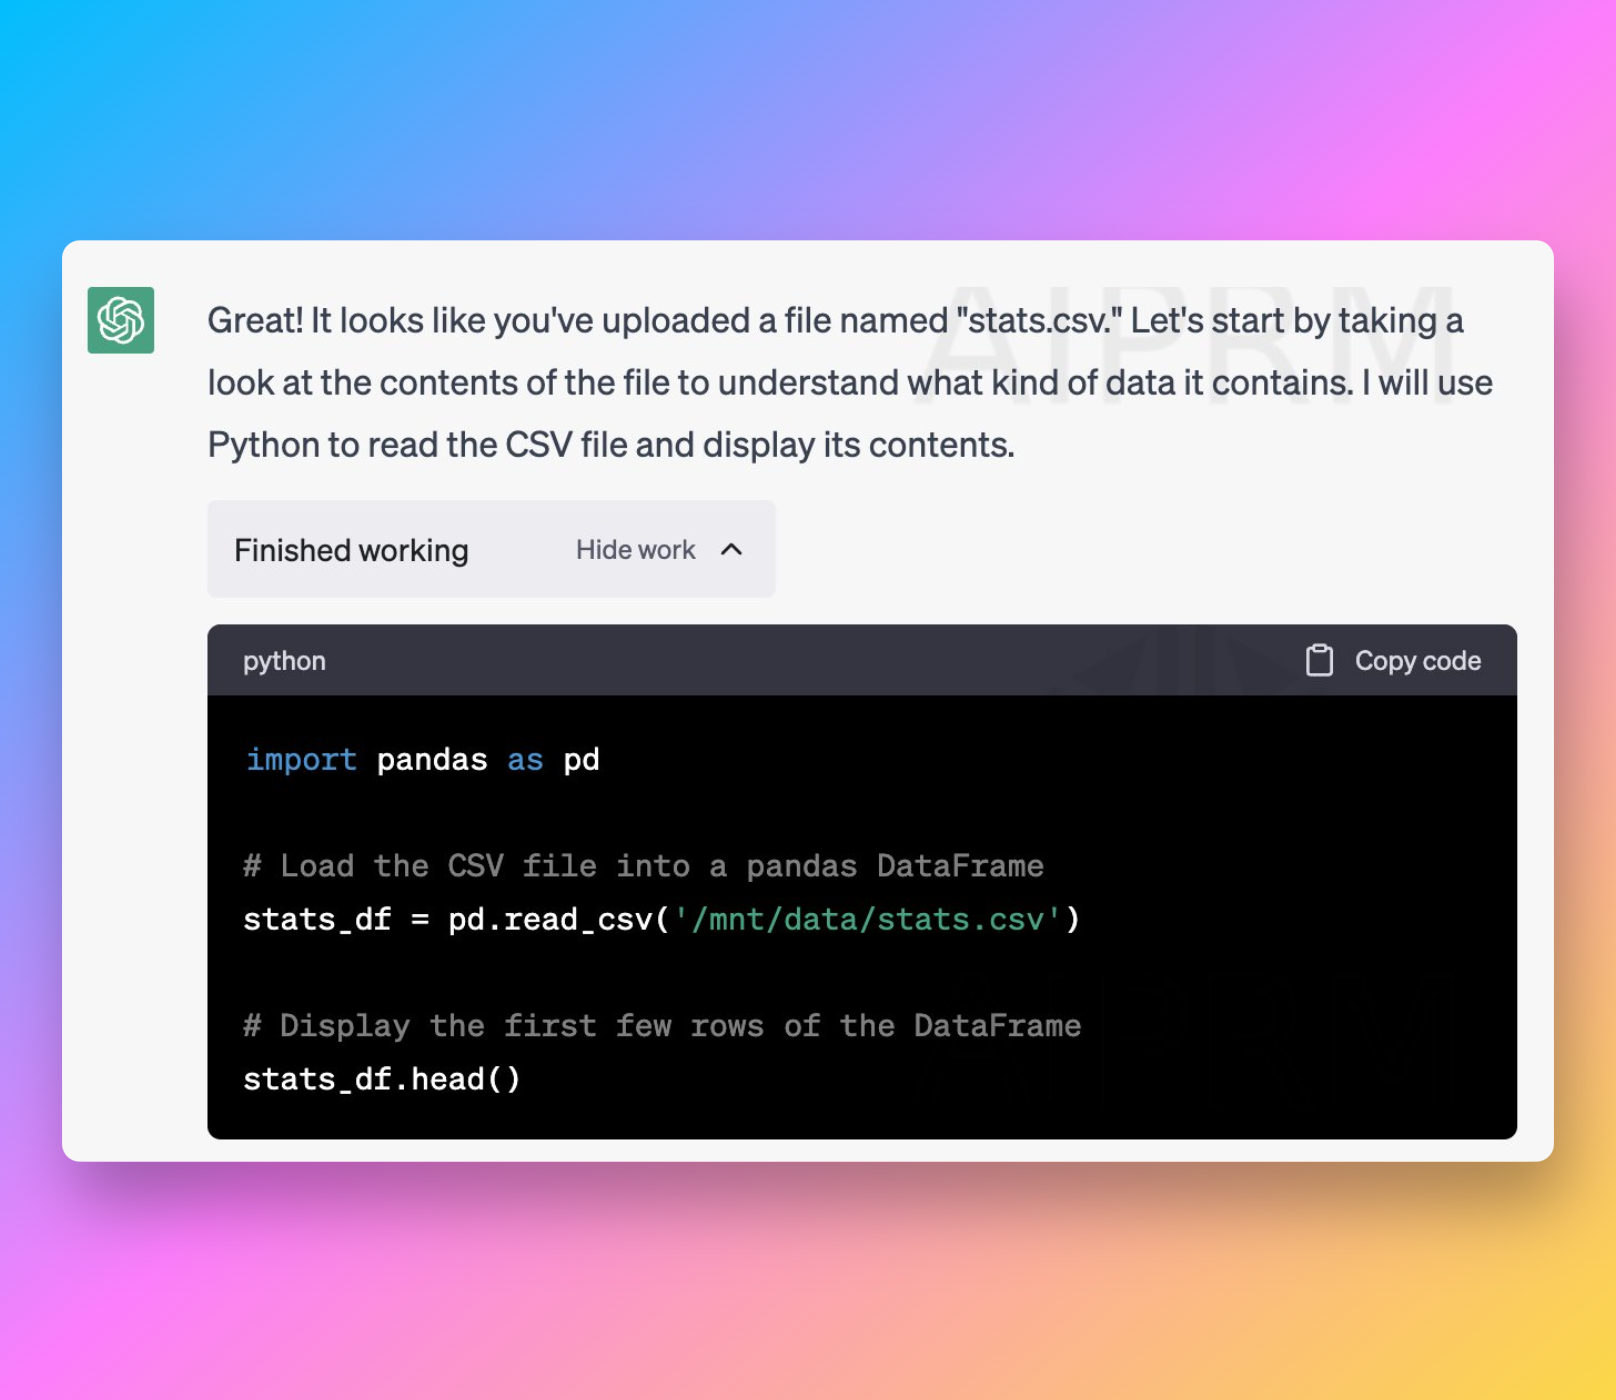
The core appeal is simple: ADA gives you a built-in analysis environment inside ChatGPT. You can ask for cleaning, charting, summarization, or quick modeling in plain language, and the model can write and run the code behind the scenes.
Think of it as a lightweight Python workspace with file handling, charting libraries, and data-wrangling tools embedded directly in the chat.
Quick takeaway: ADA is excellent for fast, one-off analysis in ChatGPT. But if your real work already lives in Jupyter notebooks, local files, and long-running notebook sessions, bringing an AI agent into that native environment can be a better fit.
- Runcell Science: An Open Source Alternative to Claude Science for Research Workflows
- How to Make Mac Not Sleep: Keep Codex, Claude Code, and AI Agents Running
- OpenClaw vs ZeroClaw vs Pi Agent vs Nanobot: Which AI Agent Stack Should You Choose in 2026?
- Can Claude Code Analyze Jupyter Notebooks for Data Science? What It Actually Does
- Claude Code Routines: Why AI Agent Cron Jobs Matter
- Claude Code Desktop Bypass Permissions: How to Enable It
- How to Build Two Python Agents with Google’s A2A Protocol - Step by Step Tutorial
- Top 10 growing data visualization libraries in Python in 2025
Simplifying data visualization with ChatGPT Code Interpreter
Turning data into visual insight matters in almost every team now. The old workflow usually meant:
- exporting data
- writing Python or SQL
- debugging scripts
- configuring charting libraries
For non-technical users, that is a lot of friction before the first useful chart appears.
That is exactly why ChatGPT Code Interpreter (ADA) matters. It can:
- read CSV, Excel, JSON, PDF, and other common file formats
- clean and preprocess data automatically
- run Python in a sandboxed environment
- generate charts with libraries like Matplotlib, Seaborn, and Plotly
- export results as images or downloadable files
All of that can start from a plain-language prompt.
Example:
You want to visualize product revenue over time. Traditionally, you would write SQL or Python.
With ADA, you can simply say:
“Create a bar chart showing revenue by product for 2024 Q1 using the file I uploaded.”
ChatGPT can then parse the file, prepare the data, plot the chart, format the axes, label the bars, and export the result.
This applies not only to bar charts, but also to:
- line charts
- scatter plots
- heatmaps
- interactive visualizations
- statistical plots such as histograms, box plots, and regression charts
It feels a lot like having a personal data analyst on demand. If you want more context on where ChatGPT fits into analytics work, see What GPT-4 means for data analytics.
If you like ADA, but want the same workflow inside Jupyter
ADA compresses a useful loop into one conversation: describe the task, let the model write code, run it, inspect the output, and keep going. That is exactly why people like it.
But for many analysts, researchers, and data scientists, the real day-to-day workflow does not happen in a separate cloud sandbox. It happens inside existing notebooks, with an active kernel, project dependencies, local files, and private datasets that already live in a Jupyter workflow.
That is why RunCell (opens in a new tab) is highly relevant here. RunCell is an AI agent built for Jupyter. It can understand notebook context, DataFrames, prior cells, and the current execution state, so you get an ADA-like interaction model in a more native notebook workflow.
RunCell: Bring an AI agent directly into your Jupyter notebook→In practice, the difference usually looks like this:
| Need | ADA | RunCell |
|---|---|---|
| Upload a file and do quick one-off analysis | Better fit | Possible, but not the main advantage |
| Continue working with an existing notebook, kernel, and in-memory variables | Limited | Better fit |
| Iterate on DataFrames, charts, and code cells inside Jupyter | Indirect | Stronger |
| Keep the workflow closer to a native local notebook environment | Less direct | More natural |
If most of your work already happens in notebooks, continue with RunCell for Jupyter AI workflows. If you are comparing broader coding tools, see 15 best AI coding tools in 2026.
How ChatGPT Code Interpreter changed the coding experience
Before ADA, users usually needed to:
- know Python
- install libraries
- manage environments
- debug errors manually
Now they can simply describe the outcome they want.
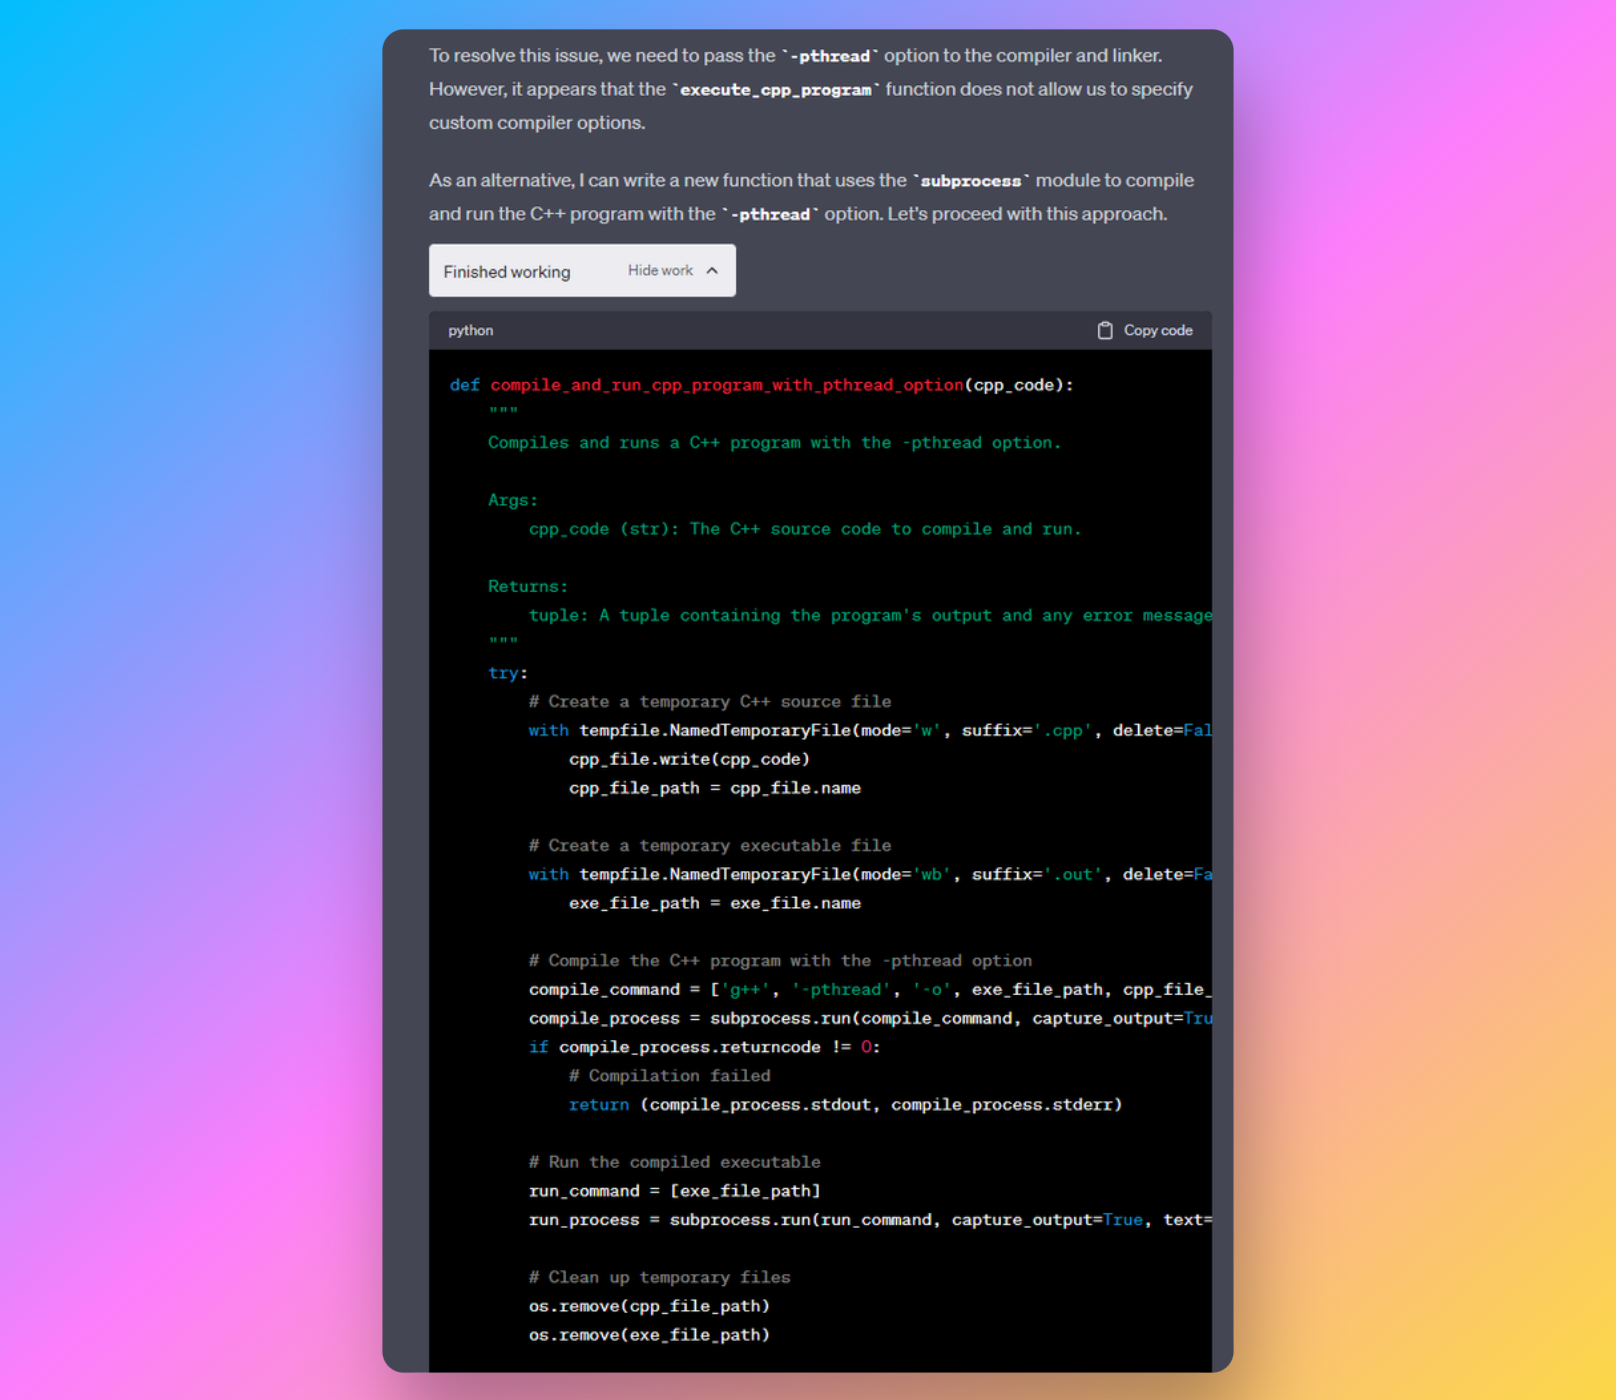
ADA can turn natural language into executable code and handle:
- data cleaning
- data transformation
- statistical modeling
- regression
- clustering
- visualization
All with much less manual setup.
It closes the gap between technical skill and analytical intent. That matters for everyone from marketers to students. Once that gap is smaller, the next question becomes: do you want to work inside ChatGPT, or do you want to bring the same interaction model into the environment where your real notebook work already happens?
Real-world examples of ChatGPT Code Interpreter for data visualization
Example 1: Descriptive analysis plus visualizations
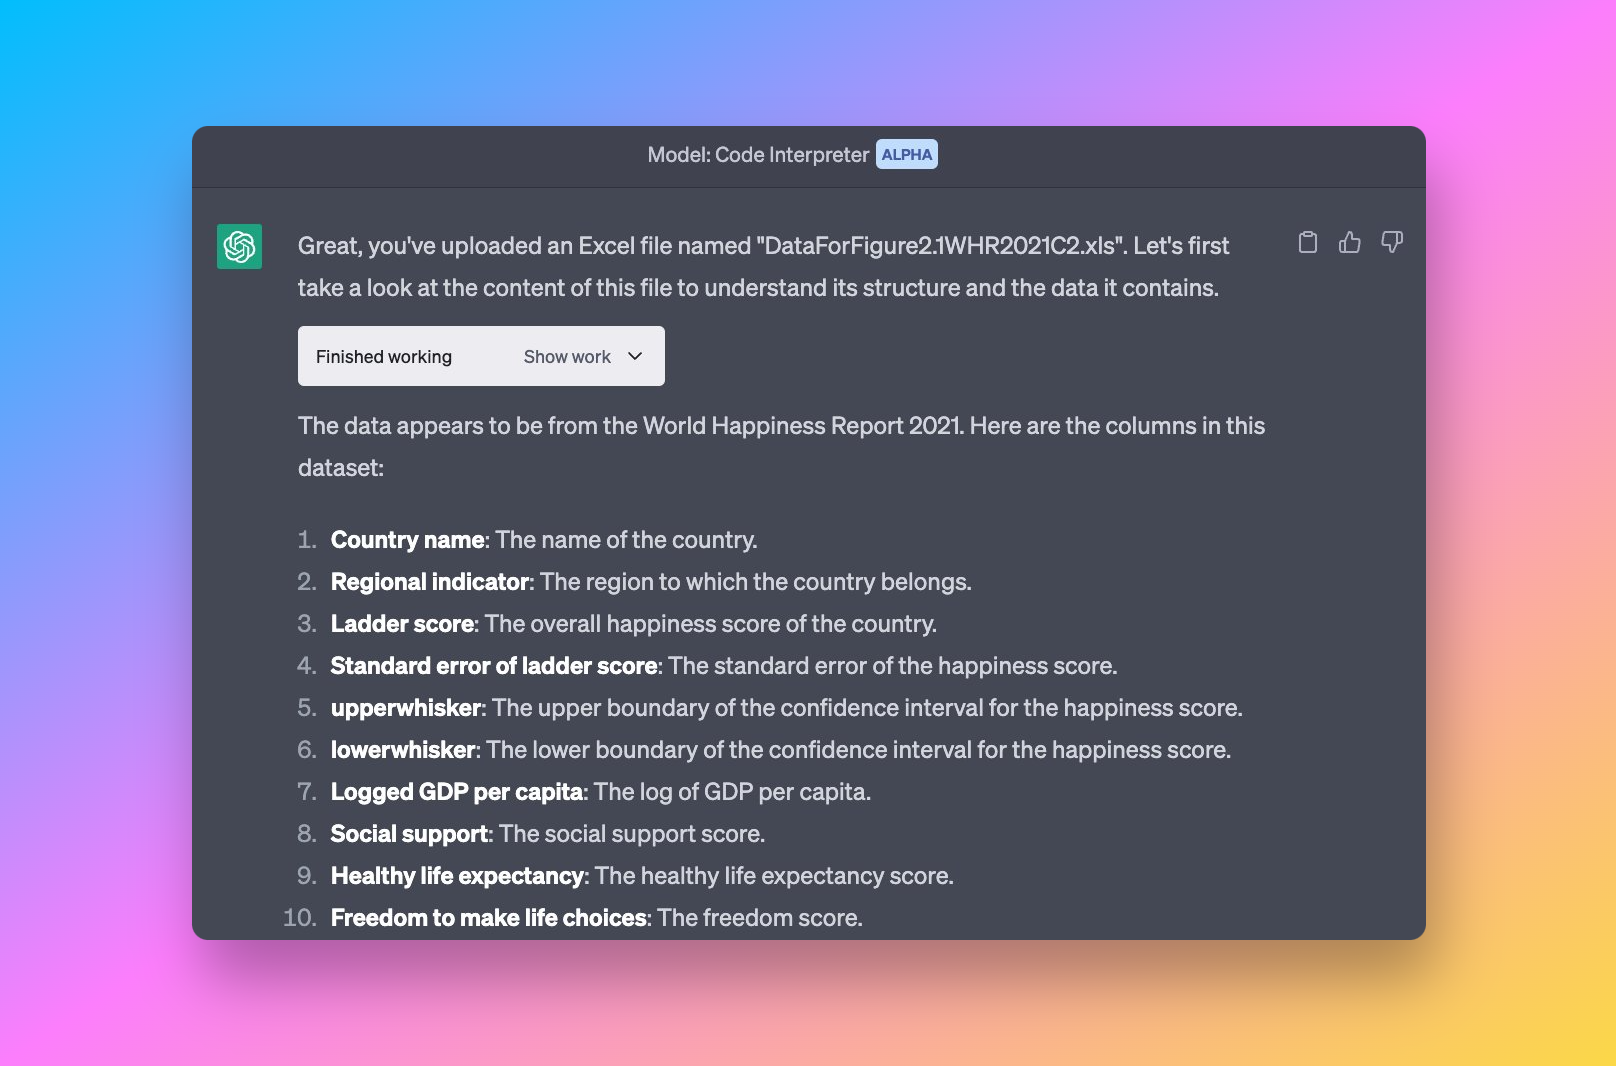
Ethan Mollick uploaded an XLS file and asked ADA:
- “Give me descriptive statistics.”
- “Visualize key patterns.”
- “Run regressions and diagnostics.”
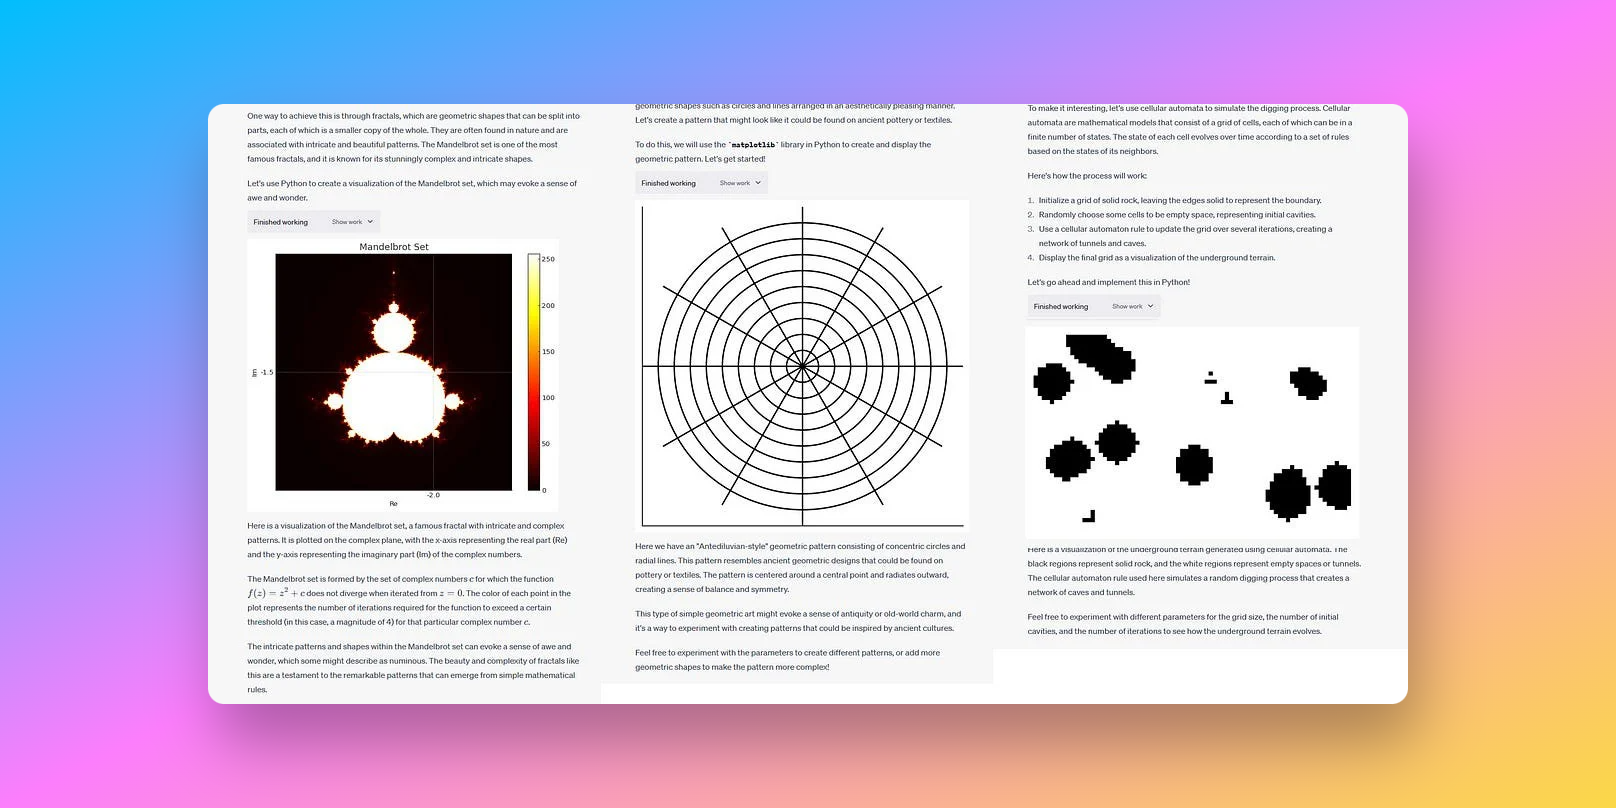
The model automatically produced:
- summary tables
- histograms
- scatter plots
- regression outputs
- explanations of the findings
This shows how ADA can handle a multi-step analysis workflow from natural-language prompts alone.
Example 2: Sensitivity analysis plus adaptive problem-solving
Even when session state was disrupted, ADA reconstructed the analysis logic and continued. That highlights its ability to:
- reason through missing context
- recover intermediate steps
- continue analysis without restarting everything
That kind of resilience is useful in messy, real analysis sessions.
Example 3: UFO sightings heatmap
Given a messy source dataset, ADA cleaned the data and generated:
- a heatmap
- a geographical visualization
- outlier detection output
All from a single instruction.
Together, these examples show how ADA turns a complicated analytics workflow into a conversational one.
How to use ChatGPT Code Interpreter for data visualization
Getting started is straightforward:
- Upload your dataset such as CSV, Excel, JSON, TSV, PDF tables, or ZIP files.
- Describe what you want to see.
“Create a scatter plot of price vs. quantity for each category.”
- Let ADA parse the data, generate the chart, and export the result.
- Keep iterating through follow-up questions.
No coding. No environment setup. No switching between several tools.
That makes ADA especially useful for:
- marketers reviewing campaign performance
- journalists exploring public datasets
- students working on coursework or research
- business teams reviewing metrics
- analysts building charts and reports faster
If your work is more reporting- or BI-heavy, you may also want AWS data visualization and Airtable charts.
Common use cases for ChatGPT Code Interpreter
ADA can help with:
✔ Exploratory data analysis
- summary statistics
- missing-value detection
- correlation heatmaps
✔ Data visualization
- charting with Matplotlib, Seaborn, Plotly, and Altair
- statistical plots
- time-series charts
✔ Data cleaning
- deduplication
- type correction
- outlier detection
✔ Data science tasks
- regression
- clustering
- forecasting
- feature engineering
✔ File automation
- CSV to Excel conversion
- file merging
- table extraction from PDFs
It is effectively a lightweight data-science toolkit accessible through plain language.
ChatGPT Code Interpreter and machine learning
ADA is powered by machine learning models that can:
- interpret user intent
- generate Python code
- inspect output
- correct errors
- iterate toward a better result
That creates a feedback loop similar to how a human analyst works through a task.
To understand more of the technical context behind ADA, read this Nature report (opens in a new tab).
The next step in conversational analysis: from cloud sandbox to native workflow
Tools like ADA merge several ideas:
- no-code
- low-code
- traditional programming
- AI-assisted reasoning
Instead of writing code manually, users describe the task and let the model write and run the code.
That shift is accelerating the broader no-code and AI-assisted analytics movement.
But the more important shift now is that many users no longer want AI analysis to live only in a separate cloud session. They want the agent in the place where the real work already happens: Jupyter notebooks, project files, local data directories, and ongoing notebook sessions.
That is where notebook-native tools like RunCell become compelling. ADA proved that natural language plus code execution is a useful interface. RunCell pushes that interface into a more native Jupyter workflow, which is often a better fit for iterative analysis, local development, and privacy-sensitive data work.
If notebook tooling is what you are comparing, see Top 10 data science notebooks.
Related Guides
- RunCell for Jupyter AI workflows
- 15 best AI coding tools in 2026
- What GPT-4 means for data analytics
- AWS data visualization
- Top 10 data science notebooks
FAQs
What is ChatGPT Code Interpreter (ADA)?
It is a Python execution environment inside ChatGPT that lets users analyze files, run calculations, and generate visualizations through natural-language prompts.
How do I use it?
Upload a file, describe the analysis you want, and ChatGPT can return charts, summaries, and code execution results.
What languages does it support?
Primarily Python, along with common data and visualization libraries such as Pandas, Matplotlib, Seaborn, Plotly, NumPy, and Scikit-Learn.
Is it free?
Usually not. Advanced Data Analysis is generally included in paid ChatGPT plans that support file analysis. Check OpenAI’s current plan details for exact availability.
What if ADA is not available to me?
If you mainly want fast one-off file analysis, ADA is the most direct option. But if you want an AI agent inside your existing Jupyter workflow, RunCell (opens in a new tab) is the more relevant alternative because it works directly with notebook context, cells, and local workflow state.
Conclusion
ChatGPT Code Interpreter (ADA) changed how many people approach data work. By combining natural-language interaction with Python execution, it makes data analysis and visualization much more accessible.
For quick analysis inside ChatGPT, it is still one of the most approachable tools available. But if your core workflow already lives in Jupyter, a notebook-native AI agent like RunCell is often the more natural next step.