The Ultimate Guide to Open Source BI Tools
Business Intelligence (BI) tools are essential for companies looking to gain insights from their data. Open source BI tools offer an affordable, flexible, and customizable solution for organizations of all sizes. In this comprehensive guide, we'll dive deep into open source BI tools, with a special focus on RATH, an automated data analysis and data visualization tool that leverages artificial intelligence. Let's get started!
- Runcell Science: An Open Source Alternative to Claude Science for Research Workflows
- How to Make Mac Not Sleep: Keep Codex, Claude Code, and AI Agents Running
- OpenClaw vs ZeroClaw vs Pi Agent vs Nanobot: Which AI Agent Stack Should You Choose in 2026?
- Can Claude Code Analyze Jupyter Notebooks for Data Science? What It Actually Does
- Claude Code Routines: Why AI Agent Cron Jobs Matter
- Claude Code Desktop Bypass Permissions: How to Enable It
- How to Build Two Python Agents with Google’s A2A Protocol - Step by Step Tutorial
- Top 10 growing data visualization libraries in Python in 2025
Open Source BI Tools: An Introduction
Open source BI tools are software applications that provide organizations with the means to analyze, visualize, and report on their data. These tools are distributed under an open source license, allowing users to modify, distribute, and utilize the software free of charge. Some popular open source BI tools include RATH, BIRT, and Pentaho.
Why Choose Open Source BI Tools?
There are several reasons organizations opt for open source BI tools:
- Cost-effectiveness: Open source tools are typically free or low-cost, making them an attractive option for budget-conscious organizations.
- Flexibility: Open source tools can be customized to fit an organization's unique needs, allowing for greater control over the end product.
- Community support: Open source tools often have active communities of users and developers who can provide valuable support and resources.
- Interoperability: Open source tools are designed to work with a variety of data sources and platforms, ensuring seamless integration with existing systems.
RATH: An AI-Driven Open Source BI Tool
RATH (opens in a new tab) is an open source BI tool that leverages AI for automated data analysis and visualization. Its innovative approach simplifies the process of extracting insights from data, making it a powerful tool for organizations of all sizes.
Key Features of RATH
RATH offers a range of features that set it apart from other open source BI tools:
- AI-powered data analysis: RATH uses machine learning algorithms to automatically analyze and visualize your data, removing the need for manual intervention.
- Customizable visualizations: RATH allows users to create personalized visualizations that can be easily shared with stakeholders.
- Seamless integration: RATH is designed to work with a variety of data sources, ensuring that it can be easily integrated into your existing data pipeline.
Here is a demo video for using RATH to generate data insights and visualizations with one simple prompt:
Interested? Unlock the insights of your data with one prompt: ChatGPT-powered RATH is Open for Beta Stage now! Get onboard and check it out!
Getting Started with RATH
To begin using RATH, follow these simple steps:
- Visit the RATH GitHub repository (opens in a new tab) and clone or download the source code.
- Install the necessary dependencies as outlined in the documentation.
- Launch the RATH application and follow the on-screen instructions to connect your data source.
- Start exploring your data with RATH's AI-driven data analysis and visualization capabilities!
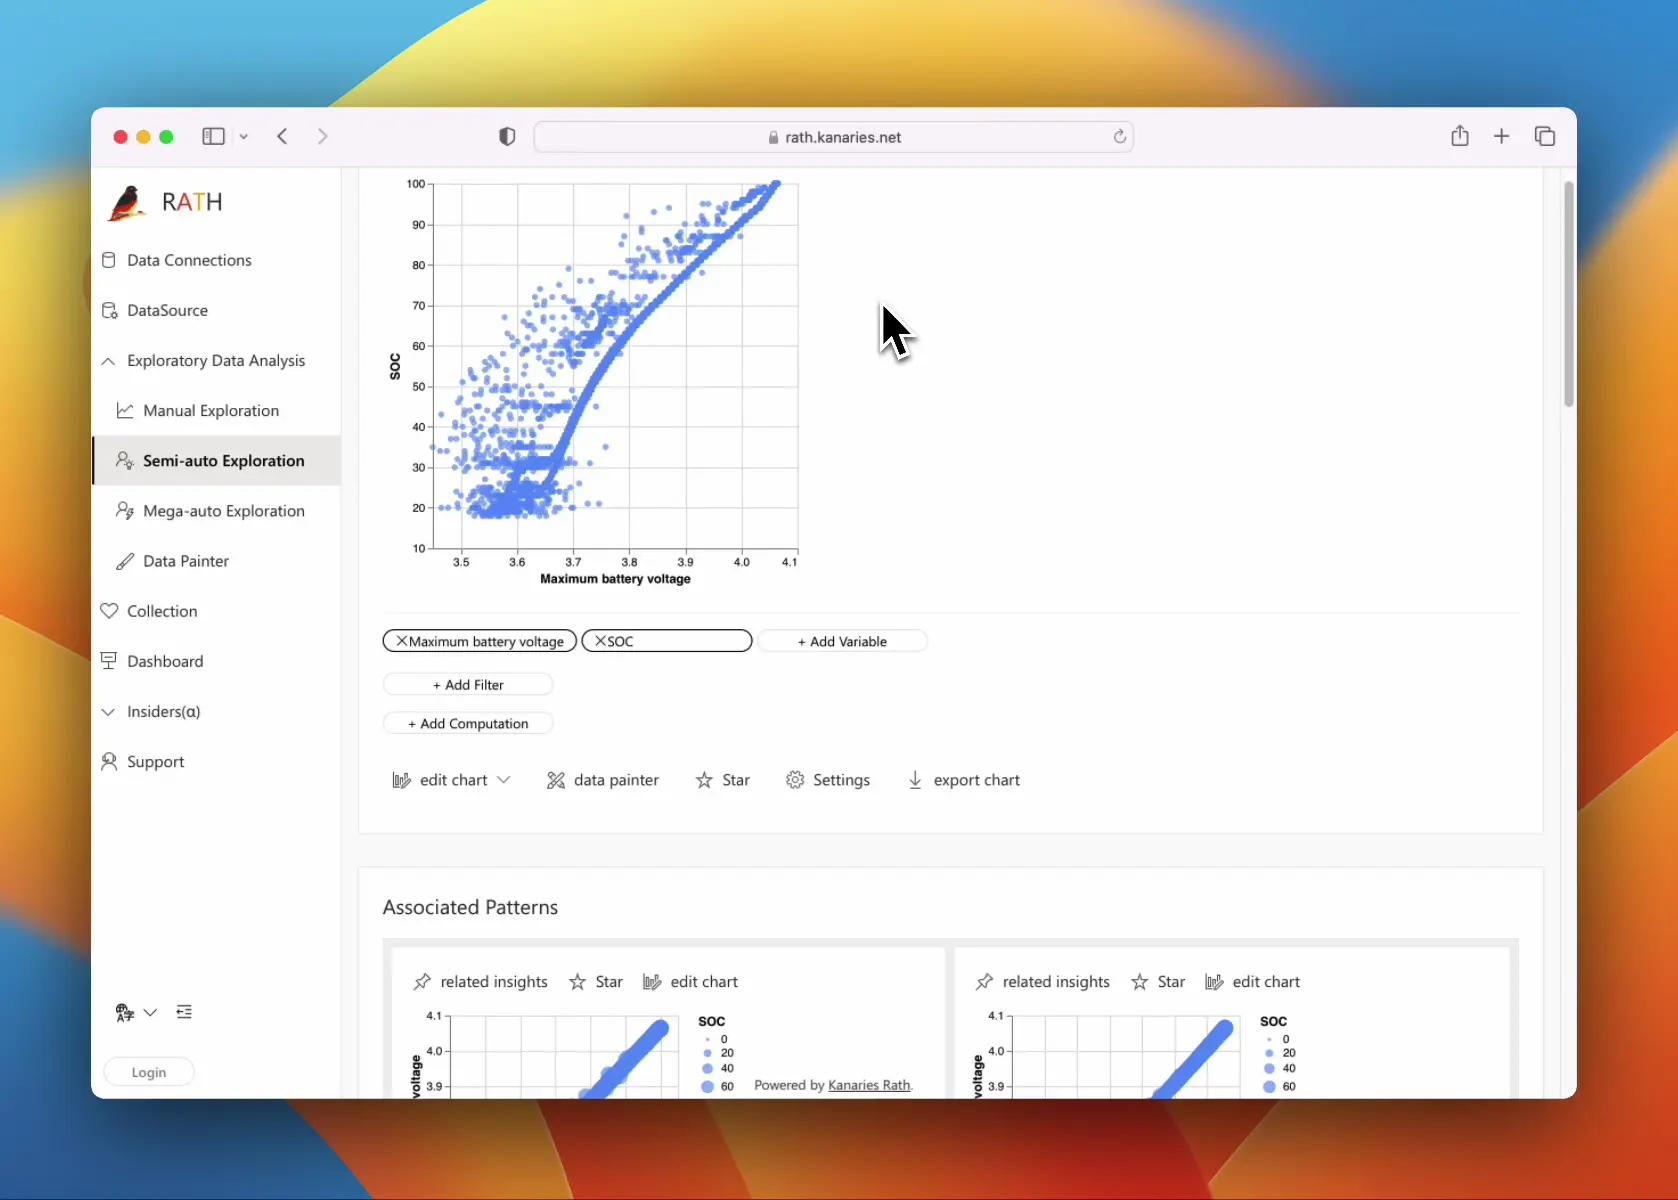
One of the highlight of RATH is that: you can extract insights from data at an incredibly fast pace. It even has a paint brush tool for data exploration:
Examples of RATH in Action
Let's explore a few examples of how RATH can be used to analyze and visualize data:
- Sales data analysis: RATH can be used to uncover patterns and trends in sales data, such as identifying top-selling products, determining seasonal fluctuations, and pinpointing areas for improvement.
- Customer segmentation: With RATH's AI-driven analysis, organizations can easily segment their customer base to better understand and target their audience.
- Predictive maintenance: RATH's machine learning capabilities can be utilized to predict equipment failure, allowing for proactive maintenance and reduced downtime.
Comparing RATH to Other Open Source BI Tools
While RATH is a powerful BI tool, it's essential to consider alternative options to find the best fit for your organization. Let's compare RATH to two other popular open source BI tools: BIRT and Pentaho.
RATH vs. BIRT
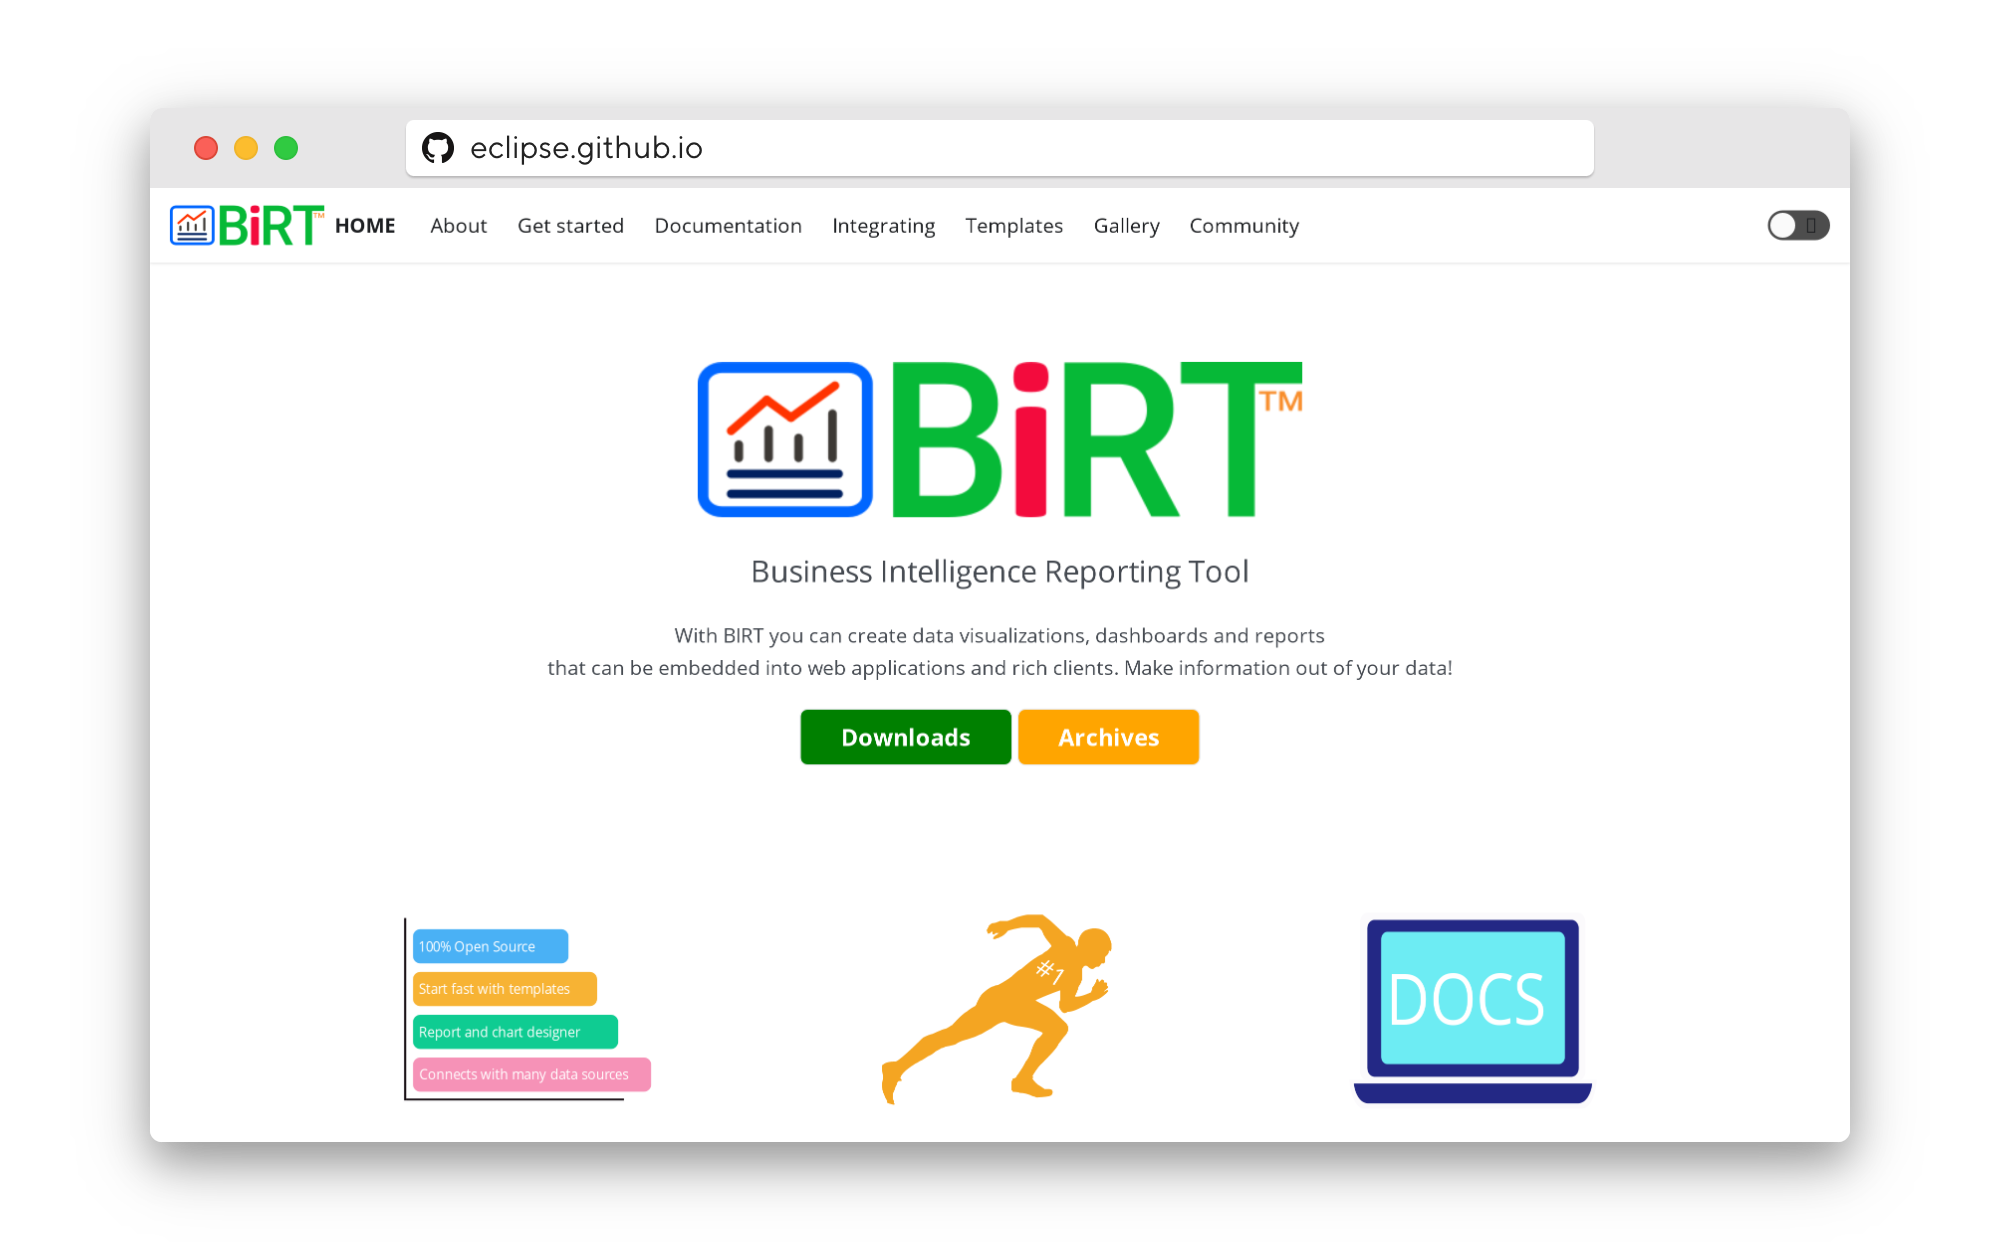
BIRT (opens in a new tab) (Business Intelligence and Reporting Tools) is an open source BI tool that focuses on reporting and data visualization. It's a mature project hosted by the Eclipse Foundation and offers a wide range of features, including an extensive library of charts and visualizations, a drag-and-drop report designer, and support for various data sources.
Key differences between RATH and BIRT include:
- AI-driven analysis: RATH utilizes AI-powered algorithms to automatically analyze data, while BIRT relies on users to manually define and apply analytical processes.
- Ease of use: RATH's user-friendly interface and automated analysis make it more accessible to users without extensive technical knowledge, while BIRT may require a steeper learning curve for non-technical users.
- Customization: BIRT offers extensive customization options for visualizations and reports, whereas RATH focuses more on AI-driven analysis and streamlined visualization options.
RATH vs. Pentaho
Pentaho (opens in a new tab) is another popular open source BI tool that provides a comprehensive suite of data integration, analysis, and reporting capabilities. It's part of the Hitachi Vantara product portfolio and offers a wide range of features, including data integration, dashboarding, and ad-hoc reporting.
Key differences between RATH and Pentaho include:
- AI-driven analysis: RATH's AI capabilities automate data analysis, while Pentaho focuses more on traditional BI techniques and manual data exploration.
- Complexity: Pentaho offers a robust set of features that cater to a wide range of use cases but may come with a steeper learning curve. RATH, on the other hand, focuses on simplicity and ease of use.
- Integration: Both RATH and Pentaho support integration with various data sources, but Pentaho's data integration capabilities are more extensive and mature, making it a better fit for organizations with complex data pipelines.
In Conclusion: The Power of Open Source BI Tools
Open source BI tools like RATH, BIRT, and Pentaho offer organizations powerful, flexible, and cost-effective solutions for analyzing and visualizing their data. RATH's unique AI-driven approach simplifies the process of extracting insights from data, making it an attractive option for organizations seeking a user-friendly and innovative BI tool. By comparing the features and capabilities of various open source BI tools, you can find the best solution to meet your organization's unique needs and unlock the full potential of your data.
Remember, the choice of BI tool depends on your organization's specific requirements, technical expertise, and budget constraints. Take the time to explore each option, and don't hesitate to experiment with different tools until you find the perfect fit. Happy data analyzing!
Frequently Asked Questions (FAQ)
Here are some frequently asked questions about open source BI tools:
1. What are some benefits of using an open source BI tool?
Open source BI tools are typically free or low-cost, can be customized to meet an organization's unique needs, have active communities for support and resources, and are designed to work with a variety of data sources and platforms.
2. Is there an open source alternative to Tableau?
Yes, there are several open source alternatives to Tableau, including RATH, QlikView, and BIRT.
3. Are all open source BI tools difficult to use for non-technical users?
No, some open source BI tools, like RATH, have user-friendly interfaces and automated analysis, simplifying the process of data analysis and visualization for non-technical users.
4. Can open source BI tools handle complex data pipelines?
It depends on the tool. While some open source BI tools like Pentaho have extensive data integration capabilities, others like RATH and BIRT focus on data analysis and visualization.
5. How can I choose the right open source BI tool for my organization?
Consider your organization's unique needs, technical expertise, budget constraints, and preferred features when comparing open source BI tools. It's also helpful to test and experiment with different options until you find the best fit.