PyGWalker 0.1.6. Update: Export Visualizations to Code
If you're a data scientist who has ever struggled with the cumbersome process of analyzing data and visualizing patterns, PyGWalker is here to help. This Python library can streamline your workflow by turning your pandas dataframe (and polars dataframe) into a user-friendly tableau-alternative interface for visual exploration.
Introducing PyGWalker: A Python Library for EDA and Visualization.
- Runcell Science: An Open Source Alternative to Claude Science for Research Workflows
- How to Make Mac Not Sleep: Keep Codex, Claude Code, and AI Agents Running
- OpenClaw vs ZeroClaw vs Pi Agent vs Nanobot: Which AI Agent Stack Should You Choose in 2026?
- Can Claude Code Analyze Jupyter Notebooks for Data Science? What It Actually Does
- Claude Code Routines: Why AI Agent Cron Jobs Matter
- Claude Code Desktop Bypass Permissions: How to Enable It
- How to Build Two Python Agents with Google’s A2A Protocol - Step by Step Tutorial
- Top 10 growing data visualization libraries in Python in 2025
What is PyGWalker?
PyGWalker (opens in a new tab) is an open-source Python library designed to simplify exploratory data analysis (EDA) and visualization. With PyGWalker, you can easily analyze and visualize data patterns using a simple drag-and-drop interface. PyGWalker is a Python binding of Graphic Walker, an open-source alternative to Tableau. PyGWalker integrates seamlessly with Jupyter Notebook and other jupyter-based notebooks.
PyGWalker supports a variety of environments, including Jupyter Notebook, Google Colab (opens in a new tab), Kaggle Code (opens in a new tab), Binder (opens in a new tab), and Graphic Walker Online Demo (opens in a new tab). To get started with PyGWalker, you'll need to install the library via pip or conda. After installation, you can import PyGWalker and pandas to your Jupyter Notebook to get started.
pip install pygwalker --upgrade
import pygwalker as pyg
Once imported, you can call up Graphic Walker with the dataframe (df) loaded in the following way:
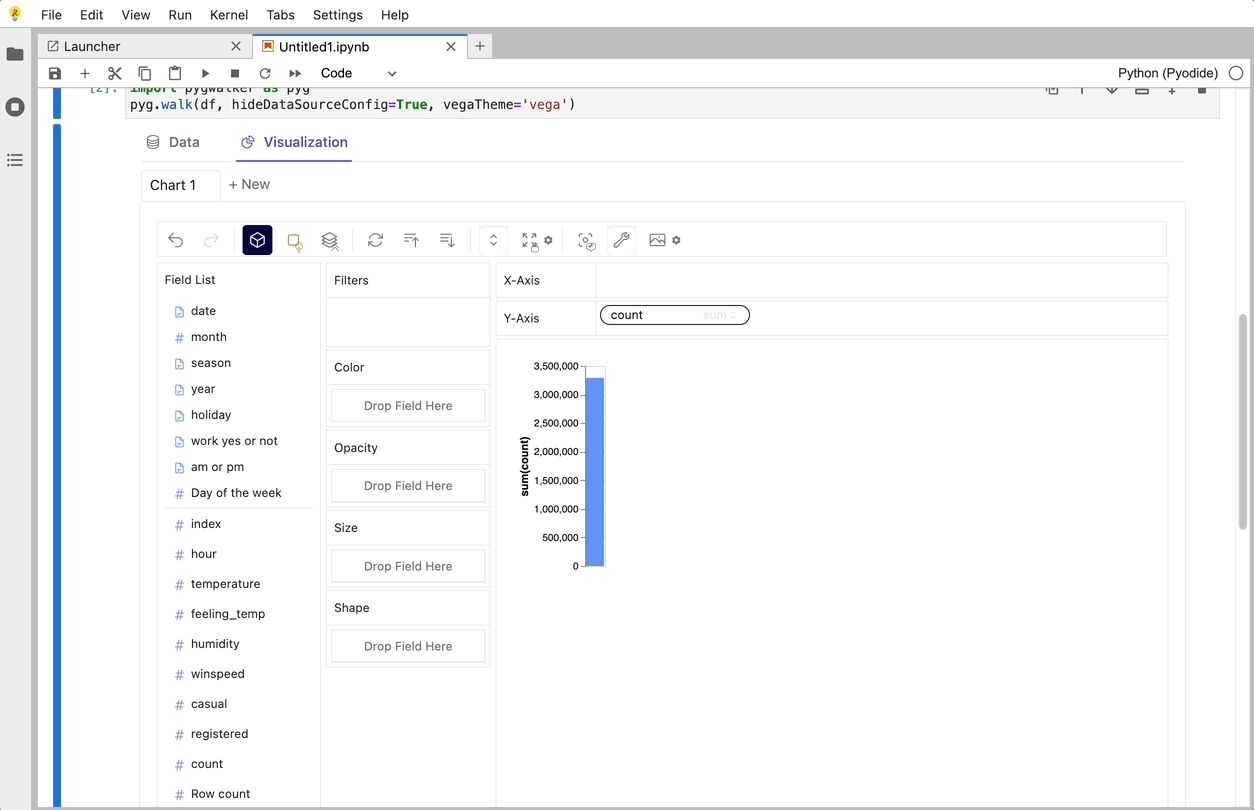
gwalker = pyg.walk(df)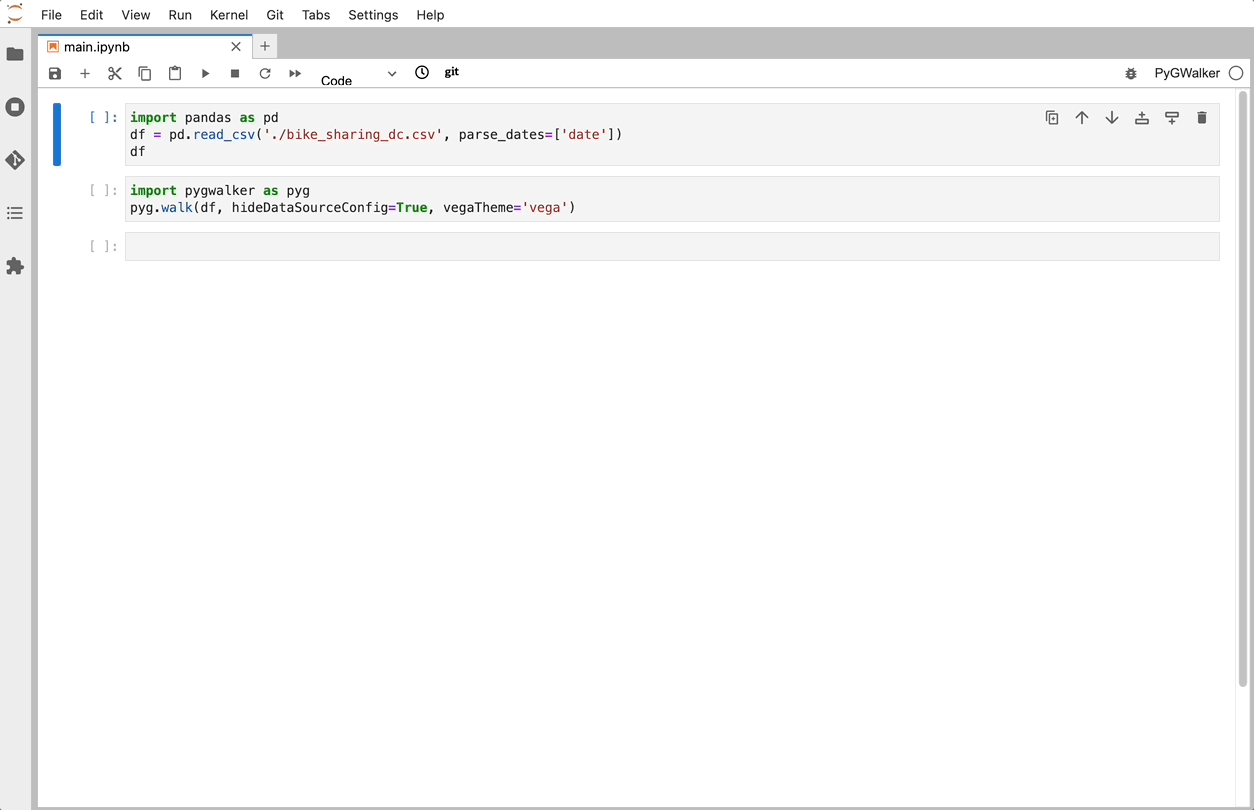
That's it. Now you have a tableau-alternative user interface to analyze and visualize data by dragging and dropping variables
Version 0.1.6. New Feature: Exporting Data Visualization to Code
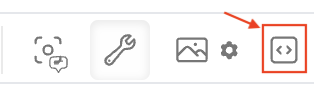
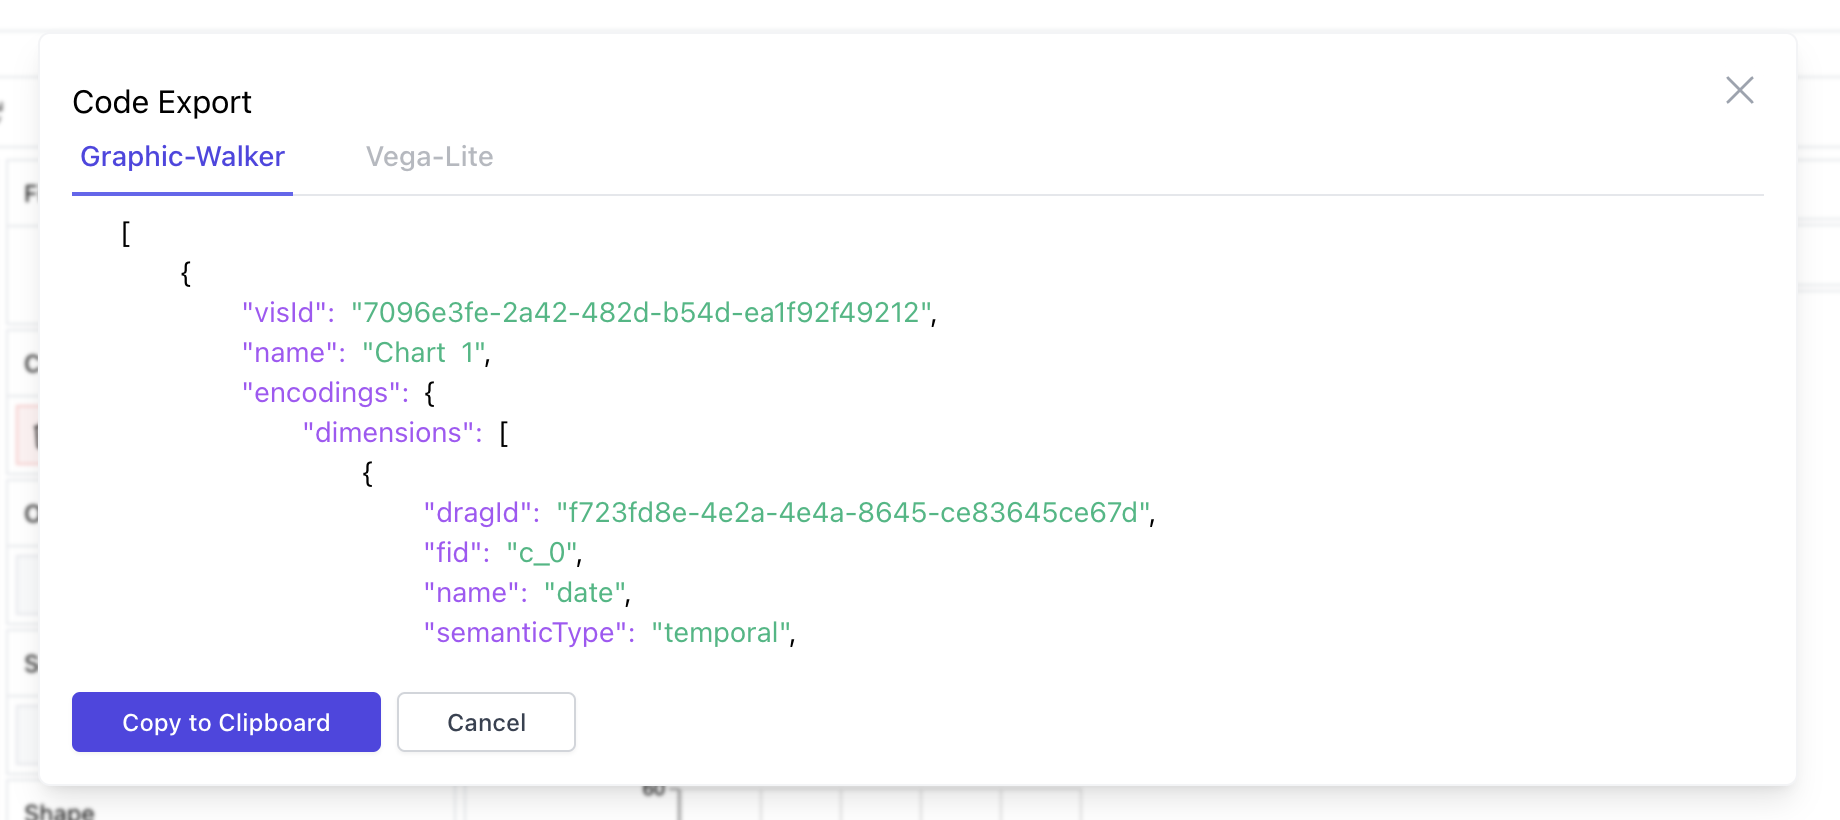
For the latest update(Version 0.1.6.) (opens in a new tab), PyGWalker included the feature to export Visualization to Codes.
Let's Take a Walk:
-
Click on the Export to Code button on the toolbar. The button is located next to the "Export to PNG/SVG" button.
-
The Visualization is available as code. Click on the Copy to Clickboard button to save the code.
-
To import the code in PyGWalker, simply import the code you just downloaded as
vis_spec, and load PyGWalker with thevis_spec:
vis_spec = """
[{"visId":"65b894b5-23fb-4aa6-8f31-d0e1a795d9de","name":"Chart 1","encodings":{"dimensions":[{"dragId":"9e1666ef-461d-4550-ac6a-465a74eb281d","fid":"gwc_1","name":"date","semanticType":"temporal","analyticType":"dimension"},{"dragId":"d2164142-30f7-41a3-a1df-0a0e4ebf1de2","fid":"gwc_2","name":"month","semanticType":"ordinal","analyticType":"dimension"},{"dragId":"7d40982e-4b76-45ed-91a8-25d25a0b4ae8","fid":"gwc_3","name":"season","semanticType":"nominal","analyticType":"dimension"},{"dragId":"28204432-cc53-4c17-9c3e-201bb1c6fd69","fid":"gwc_5","name":"year","semanticType":"nominal","analyticType":"dimension"},{"dragId":"75628c6d-4d67-4f95-96e9-0a614514d199","fid":"gwc_6","name":"holiday","semanticType":"nominal","analyticType":"dimension"},{"dragId":"b66191c8-8798-4355-87d5-0b65b014d703","fid":"gwc_14","name":"work yes or not","semanticType":"nominal","analyticType":"dimension"},{"dragId":"9abd2352-722c-494d-a605-05674c422142","fid":"gwc_15","name":"am or pm","semanticType":"nominal","analyticType":"dimension"},{"dragId":"c61bd371-dcc8-43c6-af41-e80bf20eb457","fid":"gwc_16","name":"Day of the week","semanticType":"ordinal","analyticType":"dimension"}],"measures":[{"dragId":"d4e3d4f4-d9ad-47cb-9774-8eacc608501a","fid":"gwc_0","name":"index","analyticType":"measure","semanticType":"quantitative","aggName":"sum"},{"dragId":"a42d4ea2-c74c-4e6c-81f3-fa58145d9fc4","fid":"gwc_4","name":"hour","analyticType":"measure","semanticType":"quantitative","aggName":"sum"},{"dragId":"d72e7d5d-cc1e-46d3-988c-b0f25c68e069","fid":"gwc_7","name":"temperature","analyticType":"measure","semanticType":"quantitative","aggName":"sum"},{"dragId":"82e03549-2840-4779-8c87-9bd642d15cbe","fid":"gwc_8","name":"feeling_temp","analyticType":"measure","semanticType":"quantitative","aggName":"sum"},{"dragId":"615fafa5-9c75-43b5-a7b7-a797309064fa","fid":"gwc_9","name":"humidity","analyticType":"measure","semanticType":"quantitative","aggName":"sum"},{"dragId":"9da93314-e617-4fbc-9e88-eeef46275083","fid":"gwc_10","name":"winspeed","analyticType":"measure","semanticType":"quantitative","aggName":"sum"},{"dragId":"0bee609f-6a15-4dfc-8196-e55a7fab6085","fid":"gwc_11","name":"casual","analyticType":"measure","semanticType":"quantitative","aggName":"sum"},{"dragId":"4170fac2-46a6-43e7-be73-fd3dd39ffe7a","fid":"gwc_12","name":"registered","analyticType":"measure","semanticType":"quantitative","aggName":"sum"},{"dragId":"bd1b1e87-aecd-41de-8888-9ccbe13f2e5f","fid":"gwc_13","name":"count","analyticType":"measure","semanticType":"quantitative","aggName":"sum"},{"dragId":"b49622a7-5acf-4925-a817-8ad4ae7bc4c8","fid":"gw_count_fid","name":"Row count","analyticType":"measure","semanticType":"quantitative","aggName":"sum"}],"fields":[{"dragId":"61b1cac3-c58d-49f5-8cbe-282357895bc6","fid":"gwc_0","name":"index","aggName":"sum","analyticType":"measure","semanticType":"quantitative"},{"dragId":"db165342-0017-4fa3-89f0-efffaedf5087","fid":"gwc_1","name":"date","analyticType":"dimension","semanticType":"temporal"},{"dragId":"ee625e2d-958a-425b-b13e-0cc59d286fc6","fid":"gwc_2","name":"month","analyticType":"dimension","semanticType":"ordinal"},{"dragId":"c73d0141-998f-4caf-ad03-23849d42f025","fid":"gwc_3","name":"season","analyticType":"dimension","semanticType":"nominal"},{"dragId":"c4a3743c-6400-4466-928f-a2b40f7de920","fid":"gwc_4","name":"hour","aggName":"sum","analyticType":"measure","semanticType":"quantitative"},{"dragId":"c0acb711-2f54-41b5-a4f0-d355d8f6998f","fid":"gwc_5","name":"year","analyticType":"dimension","semanticType":"nominal"},{"dragId":"9ad81c68-5329-42eb-9b3a-a813a9482e9b","fid":"gwc_6","name":"holiday","analyticType":"dimension","semanticType":"nominal"},{"dragId":"f135914b-7a58-4f69-bf6e-4328a42c76a0","fid":"gwc_7","name":"temperature","aggName":"sum","analyticType":"measure","semanticType":"quantitative"},{"dragId":"4eda6f67-0d64-4b85-9895-ff8dd7c4dab5","fid":"gwc_8","name":"feeling_temp","aggName":"sum","analyticType":"measure","semanticType":"quantitative"},{"dragId":"cfa84897-13c9-45ec-addb-2a3135d0113d","fid":"gwc_9","name":"humidity","aggName":"sum","analyticType":"measure","semanticType":"quantitative"},{"dragId":"abe15c87-7364-4687-beda-ba11d30c2262","fid":"gwc_10","name":"winspeed","aggName":"sum","analyticType":"measure","semanticType":"quantitative"},{"dragId":"5ca1464d-3dc6-4a80-b78c-a6f91ef11e72","fid":"gwc_11","name":"casual","aggName":"sum","analyticType":"measure","semanticType":"quantitative"},{"dragId":"a6e553e7-32a2-4aed-b590-02308fb7cac1","fid":"gwc_12","name":"registered","aggName":"sum","analyticType":"measure","semanticType":"quantitative"},{"dragId":"37f8fc74-06c2-43bb-98dc-135efdad6a69","fid":"gwc_13","name":"count","aggName":"sum","analyticType":"measure","semanticType":"quantitative"},{"dragId":"c5916915-203b-457c-ba6a-2e28c21694b2","fid":"gwc_14","name":"work yes or not","analyticType":"dimension","semanticType":"nominal"},{"dragId":"ac293432-2c09-4104-bb95-8027f94a310e","fid":"gwc_15","name":"am or pm","analyticType":"dimension","semanticType":"nominal"},{"dragId":"0020d11e-6bcd-44cb-919b-6cb3f6d5fa0f","fid":"gwc_16","name":"Day of the week","analyticType":"dimension","semanticType":"ordinal"},{"dragId":"9ffc9ee4-3413-432f-9606-6c44ea3717da","fid":"gw_count_fid","name":"Row count","aggName":"sum","analyticType":"measure","semanticType":"quantitative"}],"rows":[{"dragId":"cc52d32f-1438-4523-b20a-b7c8346327d1","fid":"gwc_7","name":"temperature","analyticType":"measure","semanticType":"quantitative","aggName":"sum"},{"dragId":"7a693f90-6e5a-4032-a800-f3162efeb2c6","fid":"gwc_10","name":"winspeed","analyticType":"measure","semanticType":"quantitative","aggName":"sum"}],"columns":[{"dragId":"0170fb40-aa10-4378-ab79-3a35aad936ce","fid":"gwc_9","name":"humidity","analyticType":"measure","semanticType":"quantitative","aggName":"sum"}],"color":[{"dragId":"0e30a2e3-d670-42d5-b0c8-fed4befeb92c","fid":"gwc_3","name":"season","semanticType":"nominal","analyticType":"dimension"}],"opacity":[],"size":[],"shape":[],"radius":[],"theta":[],"details":[],"filters":[]},"config":{"defaultAggregated":false,"geoms":["auto"],"stack":"stack","showActions":false,"interactiveScale":false,"sorted":"none","size":{"mode":"auto","width":320,"height":200},"exploration":{"mode":"none","brushDirection":"default"}}}]
"""
pyg.walk(df, spec=vis_spec)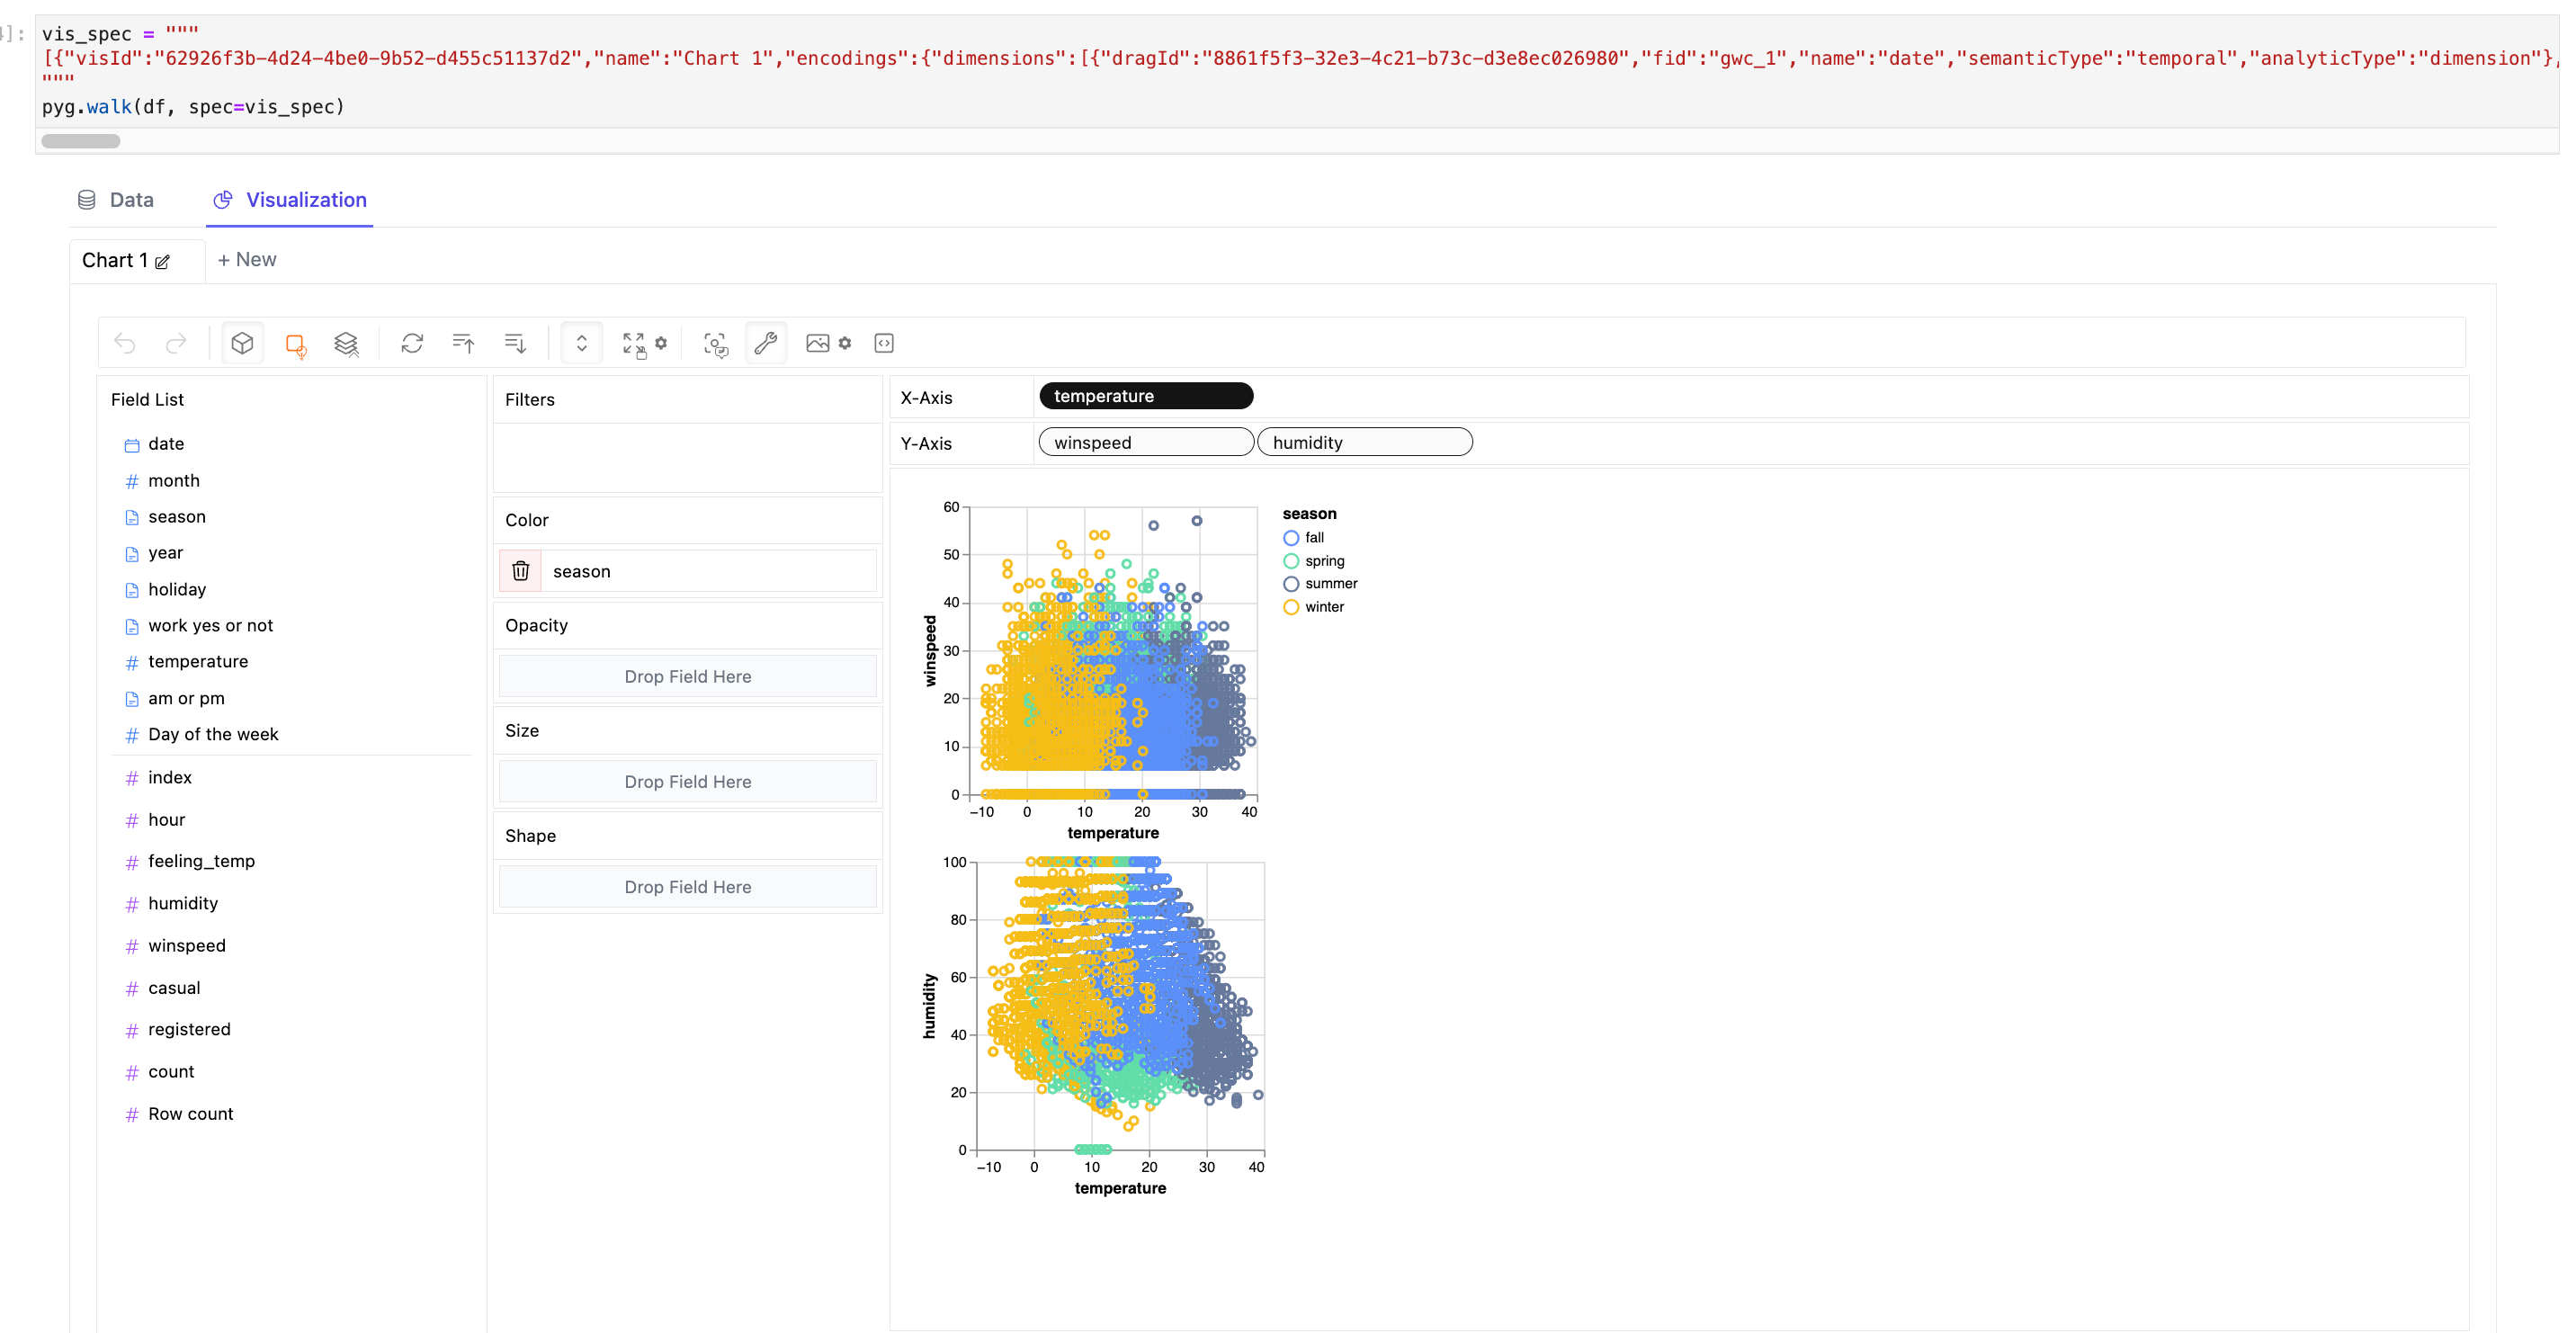
PyGWalker also has other enhancements and bug fixes for the latest update. Most notably:
- Bump Graphic-Walker to 0.2.15 (opens in a new tab)
- Add support for Databricks (opens in a new tab)
- Add support for Jupiter Extension for VSCode (opens in a new tab)
- Support Streamlit environment and make Jupyter and Streamlit (opens in a new tab)
- Change JS module format to support Kaggle Notebooks (opens in a new tab)
- Support dark themes (opens in a new tab)
- More concise API (opens in a new tab)
For a full list of the update, refer to the PyGWalker changelog.
Summary
If you are a data scientist, analyst, student, or anyone else who needs to visualize data, PyGWalker is an excellent tool that you should consider using. You can use the exporting data visualizations to code features, create complex visualizations and integrate their visualizations into other tools.
If you have more suggestions and feature requests about PyGWalker, please feel free to drop an issue at PyGWalker GitHub (opens in a new tab)!
Further Readings
- PyGWalker: A Python Library for Exploratory Data Analysis with Visualization
- How to Create Data Visualizations in PyGWalker