High Dimensional Data Visualization: Techniques for Visualizing Complex Data

When dealing with high dimensional data, it can be challenging to effectively represent and communicate the underlying structure and insights. High dimensional data visualization techniques offer a way to explore and understand complex, multidimensional data sets. In this article, we will discuss various techniques for high dimensional data visualization and how tools like Kanaries RATH (opens in a new tab) can streamline the process.
- Runcell Science: An Open Source Alternative to Claude Science for Research Workflows
- How to Make Mac Not Sleep: Keep Codex, Claude Code, and AI Agents Running
- OpenClaw vs ZeroClaw vs Pi Agent vs Nanobot: Which AI Agent Stack Should You Choose in 2026?
- Can Claude Code Analyze Jupyter Notebooks for Data Science? What It Actually Does
- Claude Code Routines: Why AI Agent Cron Jobs Matter
- Claude Code Desktop Bypass Permissions: How to Enable It
- How to Build Two Python Agents with Google’s A2A Protocol - Step by Step Tutorial
- Top 10 growing data visualization libraries in Python in 2025
Understanding High Dimensional Data
High dimensional data refers to data sets that have a large number of variables or dimensions. In contrast to two or three-dimensional data sets, high dimensional data sets may have dozens, hundreds, or even thousands of dimensions. These dimensions may represent various features or attributes of the data points, such as age, income, location, and more.
For instance, in finance, high dimensional data may include stock prices, earnings reports, and other financial indicators that influence stock market behavior. In genetics, high dimensional data may include information about a person's DNA sequence, gene expression, and other biological factors. Similarly, in marketing, high dimensional data may include customer demographics, purchasing history, website engagement data, and more.
The challenge with high dimensional data is that it can be difficult to visualize and understand the complex relationships between these dimensions. With so many dimensions, it can be challenging to identify patterns or clusters of data points that may have some underlying relationship. High dimensional data visualization techniques offer a solution to this challenge by providing methods to explore and understand these complex, multidimensional data sets.
Techniques for High Dimensional Data Visualization
There are several techniques for visualizing high dimensional data, each with its own set of advantages and disadvantages. We'll discuss some of the most popular methods below.
-
Parallel Coordinates: A technique that represents each data point as a polyline with vertices on parallel axes. Each axis corresponds to a dimension, and the position of the vertex on the axis represents the value of that dimension. This method allows for visualization of relationships between dimensions and identification of patterns and clusters in the data.
-
Scatterplot Matrix: A grid of scatterplots, where each plot represents the relationship between two dimensions. By examining the entire matrix, we can identify correlations, clusters, and outliers. Scatterplot matrices can become overwhelming as the number of dimensions increases, but techniques like dimensionality reduction can help mitigate this issue.
-
Dimensionality Reduction: Dimensionality reduction techniques, such as Principal Component Analysis (PCA) and t-Distributed Stochastic Neighbor Embedding (t-SNE), project high dimensional data onto lower-dimensional spaces while preserving important structures and relationships. These projections can then be visualized using traditional methods like scatterplots or heatmaps.
-
Glyphs and Chernoff Faces: Glyphs are visual representations of data points using geometric shapes, colors, and sizes. Chernoff faces are a specific type of glyph that represents data points as human-like faces with varying features, such as eye size or mouth shape. These techniques allow for the encoding of multiple dimensions in a single, intuitive visualization.
-
Radial Coordinates and Star Plots: Radial coordinates and star plots represent data points in a polar coordinate system, with each dimension corresponding to a radial axis. The value of each dimension determines the distance from the center of the plot. This method can effectively represent high dimensional data but may become cluttered as the number of dimensions increases.
Advanced Technique for High Dimensional Data Visualization
Another option is to use Kanaries RATH (opens in a new tab) as an Automated Exploratory Data Analysis tool to generate Data Visualizations. Kanaries RATH is a powerful tool designed to simplify the process of creating high dimensional data visualizations. With an intuitive drag-and-drop interface, users can create complex visualizations without coding knowledge.

Step-by-Step Guide to Creating High Dimensional Visualizations
After logging into the Kanaries RATH portal (opens in a new tab), click on the Manual Exploration tab to create customized High Dimensional Visualizations.
Create a basic chart
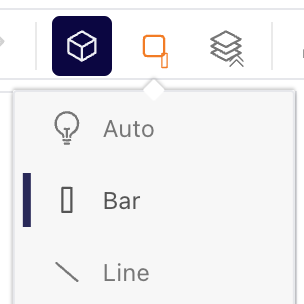
We can try to create a basic bar chart. Select Bar Chart from the Mark Types button on the tools bar.
Drag and drop measures
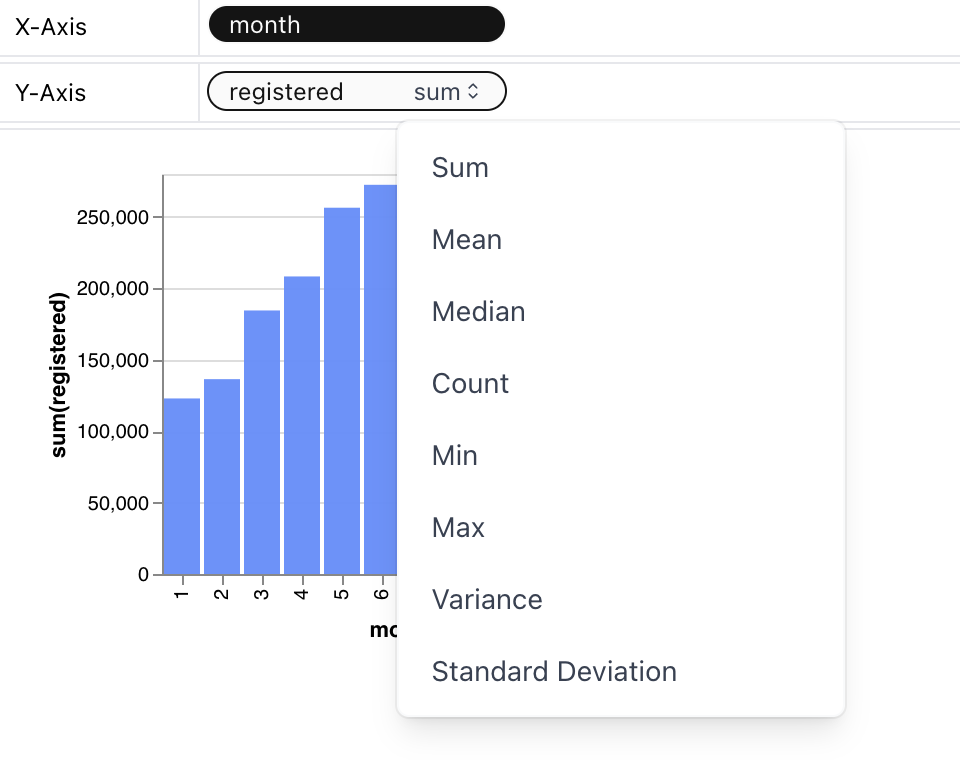
From the Field List shelf on the left, drag and drop registered to the "Rows" shelf. Drag and drop month to the "Columns" shelf.
Note that the registered has been changed to SUM(registered). This is because the Aggregation button is on, and the default aggregation for this measure is SUM. You can click on the downward arrow on the right side of registered to view to change the aggregation.
To mark the month measure with different colors, drag and drop month to the Color shelf.
Change the chart type
A line chart might demonstrate the trends of the registered user numbers better than a bar chart. To switch the existing chart to a line chart, click on the Mark Types option on the Tools bar and choose Line.
Create a Concat View
You may want to compare the differences between registered and casual users. Simply add more measures to the rows/columns and compare them.
Data Exploration
Graphic Walker not only has the capacity to build highly-customizable charts. It is also a powerful tool for data exploration to uncover the underlying patterns, trends, and insights.
On the tools bar, select the Exploration Mode option and choose one of the Data Exploration options:
With the point mode, you can explore data by pointing their mouse cursor at a specific segment of the data. Simply clicking on the selected segment allows for the retrieval of insights.
With the brush mode, you can explore data with the following steps:
- Select a segment of the data by dragging and dropping.
- Drag the data segment, Graphic Walker will give you insights.
Get Insights
You can also use the Explainer feature to get insights from data.
In the given example, we aim to investigate the reason behind the lower number of registered users in January than what was expected. To do so, make sure Exploration mode is off, and simply double-click on January, and the explainer will attempt to identify potential explanations.
By following these steps, you can create engaging and informative high dimensional data visualizations that effectively communicate complex data insights.
FAQ
Why is high dimensional data a problem?
High dimensional data is a problem because it is difficult to visualize and interpret. It can also lead to overfitting, which can result in poor predictive performance.
Why does high dimensionality lead to overfitting?
High dimensionality leads to overfitting because as the number of dimensions increases, the number of possible models that can fit the data also increases. This increases the risk of finding models that fit the data well but are not generalizable to new data.
What problems does high-dimensional data come within clustering?
Some of the problems associated with clustering high-dimensional data include the curse of dimensionality, sparsity, and the difficulty of identifying meaningful clusters.
Can Tableau handle high-dimensional data?
Yes, Tableau can handle high-dimensional data by using techniques such as data blending, aggregation, and filtering.
What are the topics in high-dimensional data analysis?
Topics in high-dimensional data analysis include feature selection, dimensionality reduction, clustering, classification, and visualization.
Conclusion
Visualizing high dimensional data can be a daunting task, but a variety of techniques and tools are available to help you effectively represent and communicate complex, multidimensional data sets. Techniques like parallel coordinates, scatterplot matrices, and dimensionality reduction can reveal hidden patterns and relationships in high dimensional data.
The best option over all is by using Kanaries RATH (opens in a new tab) to generate high-dimensional visualizations. Kanaries RATH is a powerful tool that simplifies the process of creating high dimensional data visualizations, offering an intuitive interface and a range of built-in visualization techniques. By using Kanaries RATH, you can streamline your EDA workflow and create engaging, informative visualizations that convey complex data insights.