How to Effortlessly Create a Pivot Table in Pandas
Updated on

What is a Pivot Table?
A Pivot Table is a data summarization tool used in data analysis. It allows you to transform data from rows into columns and vice versa, and perform calculations on the data. Pivot Tables are useful for summarizing and analyzing large datasets, making it easier to identify patterns and trends.
Advantages of using Pivot Tables in data analysis
Pivot Tables provide many advantages in data analysis, including:
- Flexibility: Pivot Tables can easily be adjusted to analyze different dimensions of data. Users can add, remove or reorganize rows, columns, and filters to gain different insights into the data.
- Efficiency: Pivot Tables can quickly summarize large amounts of data, making it easier to analyze and draw insights from the data.
- Aggregation: Pivot Tables can perform complex calculations on data, including sum, count, average, and more.
- Visualization: Pivot Tables can display data in a visually appealing way, making it easier to interpret and communicate insights to others.
Creating a Pivot Table in Pandas
Basic syntax for creating Pivot Table
To create a Pivot Table in Pandas, you can use the pivot() method. The basic syntax for creating a Pivot Table is as follows:
import pandas as pd

df = pd.read_csv('filename.csv')

pivot_table = df.pivot(index='column1', columns='column2', values='column3')
Using the pivot_table() method in Pandas
Another way to create a Pivot Table in Pandas is to use the pivot_table() method. This method provides more flexibility and allows you to perform more complex calculations. The basic syntax for using the pivot_table() method is as follows:
pivot_table = pd.pivot_table(df, values='column3', index='column1', columns='column2', aggfunc='mean')Examples of Pivot Tables in Pandas
1. Multi level pivot table
A multi level pivot table is a Pivot Table that has more than one level of row or column labels. This allows you to group and summarize data in multiple ways. Here is an example of creating a multi level pivot table in Pandas:
pivot_table = df.pivot_table(values='column3', index=['column1', 'column2'], columns='column4', aggfunc='sum')2. Pivot table without aggregation
Sometimes you may want to create a Pivot Table without performing any aggregation. This is useful for creating a table of unique values or for checking the distribution of data. Here is an example of creating a Pivot Table without aggregation:
pivot_table = df.pivot_table(index='column1', columns='column2', fill_value=0)3. Pivot table with multiple columns
You can also create a Pivot Table with multiple columns. This allows you to perform calculations on multiple columns of data. Here is an example of creating a Pivot Table with multiple columns:
pivot_table = df.pivot_table(values=['column3', 'column4'], index='column1', columns='column2', aggfunc='sum')4. Exporting Pivot Table to Excel
After creating a Pivot Table in Pandas, you may want to export it to Excel for further analysis or sharing with others. Pandas make it easy to export a Pivot Table to Excel using the to_excel() method.
The to_excel() method exports a DataFrame to an Excel file. By default, the method writes the DataFrame to the first sheet of the Excel file, but you can specify a sheet name using the sheet_name parameter. You can also customize the formatting of the Excel file by passing additional parameters such as float_format, header, and index.
To export a Pivot Table to Excel, you can simply call the to_excel() method on the DataFrame returned by the pivot_table() method. Here is an example:
import pandas as pd

# create a DataFrame
df = pd.read_csv('sales_data.csv')

# create a Pivot Table
pivot_table = df.pivot_table(index='Region', columns='Product', values='Sales', aggfunc='sum')

# export the Pivot Table to Excel
pivot_table.to_excel('sales_pivot_table.xlsx')
In this example, we read a CSV file containing sales data into a DataFrame. We then create a Pivot Table using the pivot_table() method, with the index set to 'Region', columns set to 'Product', values set to 'Sales', and aggregation function set to 'sum'. Finally, we export the Pivot Table to an Excel file named 'sales_pivot_table.xlsx'.
By default, the to_excel() method writes the row and column labels to the Excel file, along with the data values. If you want to exclude the row or column labels, you can set the index or columns parameter to False, respectively.
# export the Pivot Table to Excel without row labels
pivot_table.to_excel('sales_pivot_table.xlsx', index=False)

# export the Pivot Table to Excel without column labels
pivot_table.to_excel('sales_pivot_table.xlsx', columns=False)
In addition, you can use other parameters such as float_format, header, and index to customize the formatting of the Excel file. For example, you can specify the number of decimal places to display for the data values using the float_format parameter:
# export the Pivot Table to Excel with two decimal places for data values
pivot_table.to_excel('sales_pivot_table.xlsx', float_format='%.2f')
Visualize Pivot Tables in Python Pandas with PyGWalker
If you want to visualize your data within Python Pandas, there is an Open Source Data Analysis & Data Visualization package that can get you covered: PyGWalker. PyGWalker can simplify your Jupyter Notebook data analysis and data visualization workflow. By bringing a lightweight, easy-to-use interface instead of analyzing data using Python.
PyGWalker is Open Source. You can check out PyGWalker GitHub page (opens in a new tab) and read the Towards Data Science Article (opens in a new tab) of it.
To test out PyGWalker right now, you can run PyGWalker in Google Colab (opens in a new tab), Binder (opens in a new tab) or Kaggle (opens in a new tab).
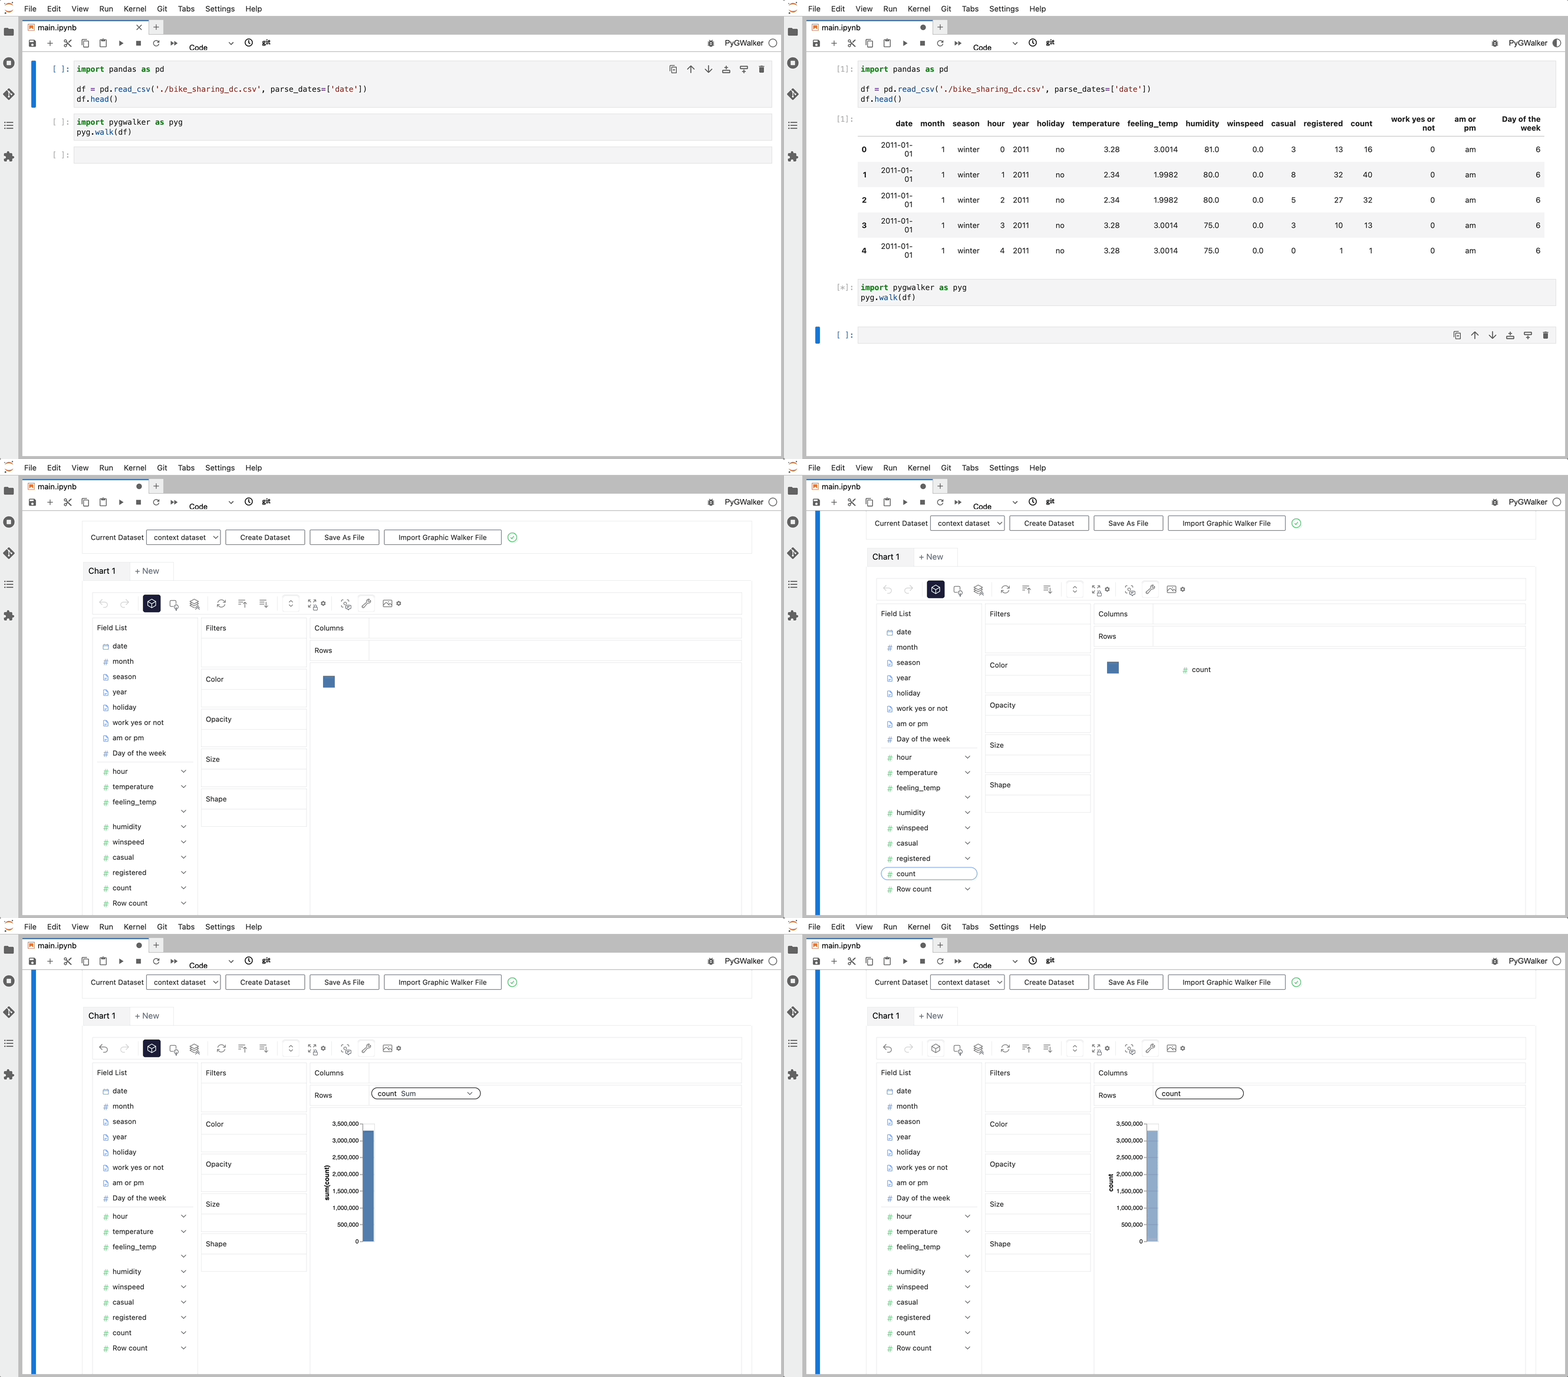
To get started with PyGWalker, import pygwalker and pandas to your Jupyter Notebook:
import pandas as pd
import pygwalker as pyg
You can use pygwalker without changing your existing workflow. For example, you can call up Graphic Walker with the dataframe loaded in this way:
df = pd.read_csv('./bike_sharing_dc.csv', parse_dates=['date'])
gwalker = pyg.walk(df)
Now you can export your Pandas Dataframe, and visualize your table with a user-friendly UI!
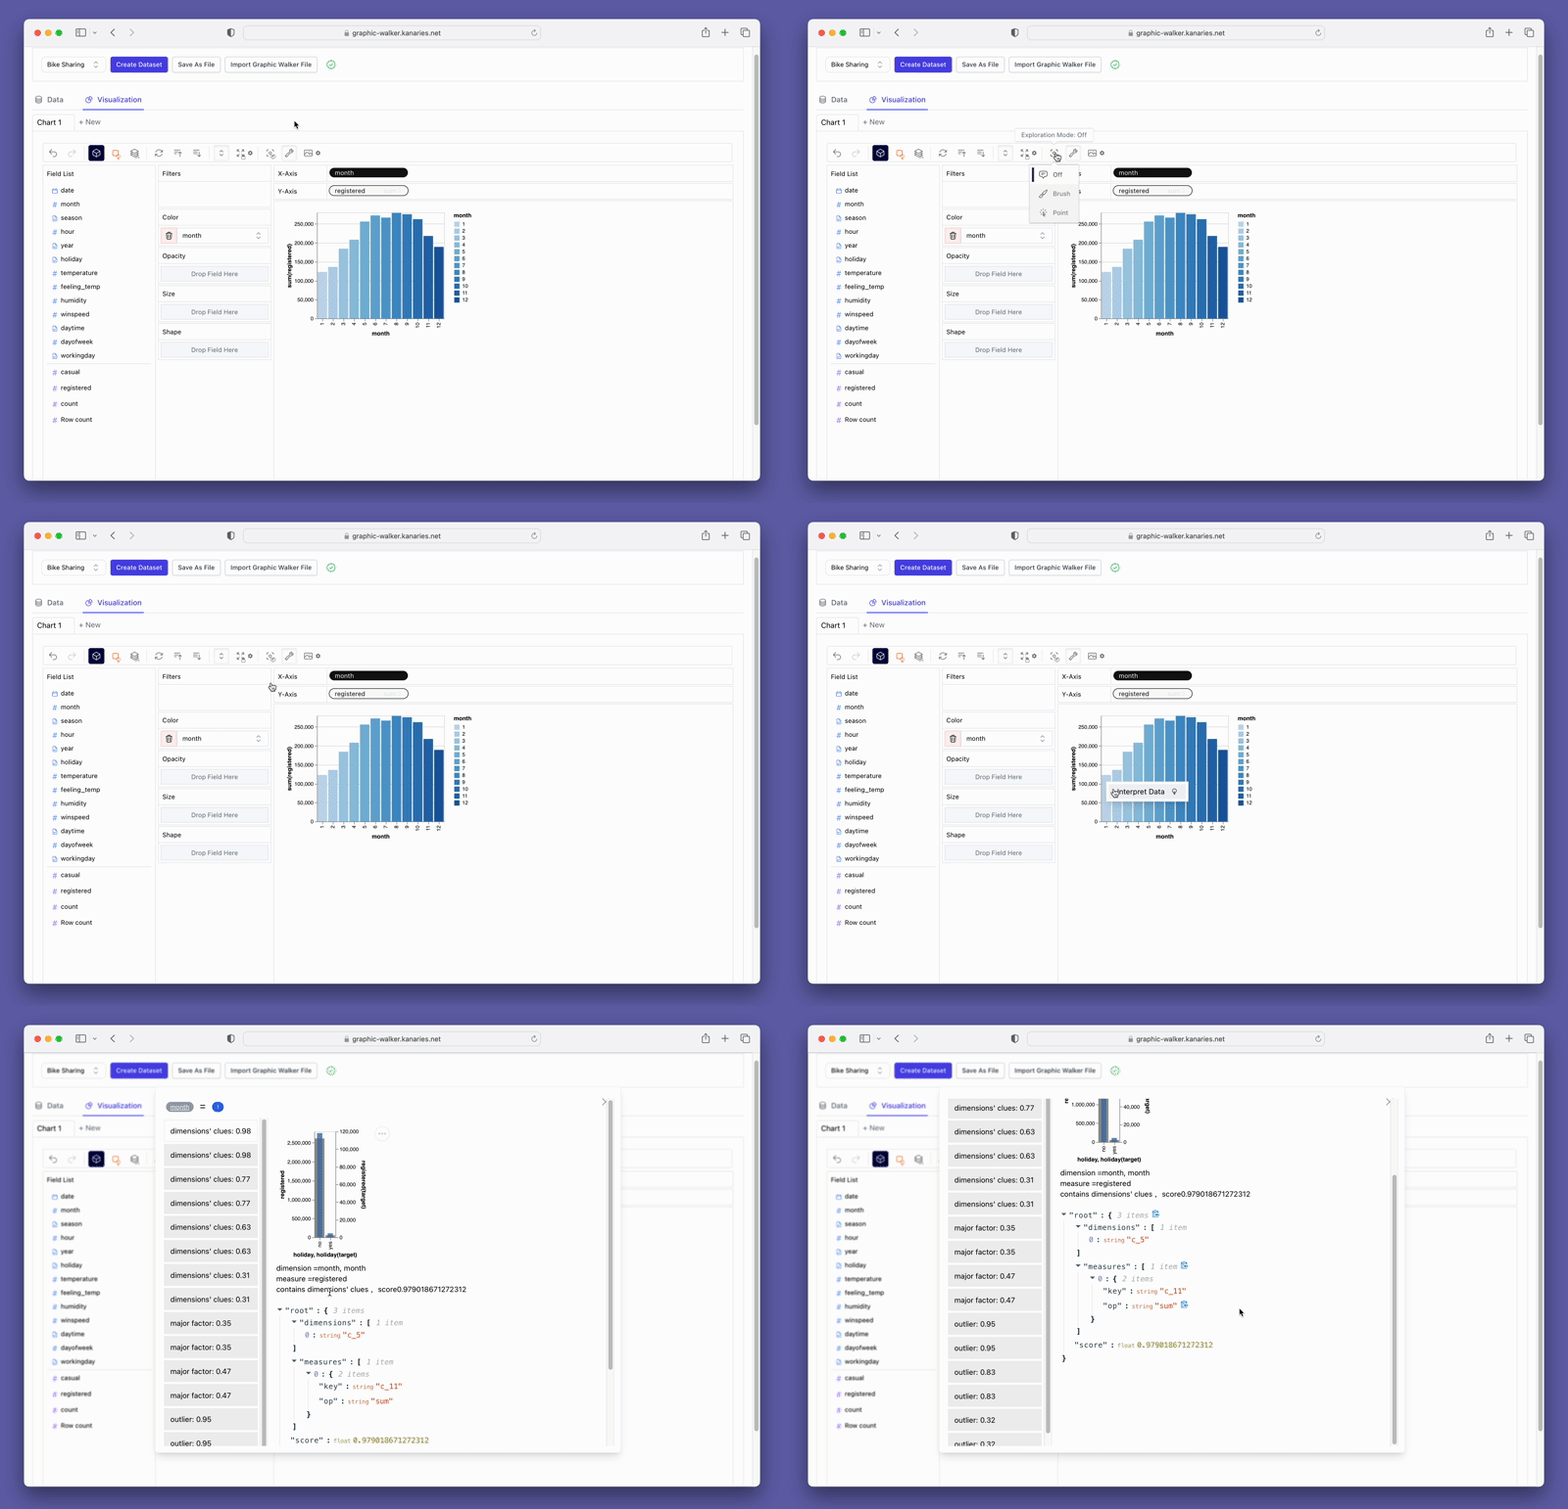
Beyond merely visualizing data, you can also use PyGWalker for Data exploration by simply clicking on the visualization and get auto-generated insights:

Don't forget to check out a more advanced, AI-empowered Automated Data Analysis tool: RATH (opens in a new tab). RATH is also open-sourced and hosted its source code on GitHub (opens in a new tab).
Conclusion
In this article, we have discussed the importance of CSV files in data analysis and how to create Pivot Tables in Pandas. We have covered the basic syntax for creating Pivot Tables, how to use the pivot_table() method, and examples of different types of Pivot Tables in Pandas. Additionally, we have answered some common questions about Pivot Tables and how to customize them.
We hope that this article has helped introduce you to the world of Pivot Tables in Pandas. There are many resources available online to help you continue your learning journey, including the official Pandas documentation and various online courses and tutorials. Keep exploring and experimenting with Pivot Tables to gain new insights into your data.
