Exploratory Data Analysis with ClickHouse - Clickhouse Standard Deviation Explained

- Runcell Science: An Open Source Alternative to Claude Science for Research Workflows
- How to Make Mac Not Sleep: Keep Codex, Claude Code, and AI Agents Running
- OpenClaw vs ZeroClaw vs Pi Agent vs Nanobot: Which AI Agent Stack Should You Choose in 2026?
- Can Claude Code Analyze Jupyter Notebooks for Data Science? What It Actually Does
- Claude Code Routines: Why AI Agent Cron Jobs Matter
- Claude Code Desktop Bypass Permissions: How to Enable It
- How to Build Two Python Agents with Google’s A2A Protocol - Step by Step Tutorial
- Top 10 growing data visualization libraries in Python in 2025
What is Exploratory Data Analysis (EDA)?
Exploratory Data Analysis (EDA) is an approach to analyzing data sets to summarize their main characteristics, often with visual methods. EDA is an important step in the data analysis process as it allows us to understand the data, uncover patterns and relationships, and identify potential issues or outliers.
Clickhouse Standard Deviation
One of the key aspects of EDA is to understand the distribution of the data, which is where measures of central tendency and dispersion come into play. The most common measure of central tendency is the mean, which is the sum of all the values in a dataset divided by the number of values. However, the mean alone does not provide a complete picture of the data distribution, which is where measures of dispersion such as the standard deviation come into play.
The standard deviation is a measure of how much a set of values deviates from the mean of that set of values. In ClickHouse, which is an open-source columnar database that is powerful for performing EDA on large datasets, has the standard deviation of a set of values can be calculated using the built-in function stddev(). This function takes a column name as an argument and returns the standard deviation of the values in that column.
The syntax for calculating the standard deviation of a column in ClickHouse is as follows:
stddev(column_name)For example, to calculate the standard deviation of the values in a column named "value", the query would be:
stddev(value)It is important to note that the stddev() function only returns the population standard deviation and not the sample standard deviation. In cases where the sample standard deviation is needed, the sampleStddev() function can be used instead.
Get the most out of the ClickHouse database with RATH
For connecting ClickHouse database for automated data exploration and data visualization, RATH (opens in a new tab) is the best Open Source option for that purpose. You can visit RATH GitHub and experience the next-generation Auto-EDA tool. You can also check out the RATH Online Demo as your Data Analysis Playground!

Major RATH features include:
| Feature | Description | Preview |
|---|---|---|
| AutoEda | Augmented analytic engine for discovering patterns, insights, and causals. A fully-automated way to explore your data set and visualize your data with one click. |  |
| Data Visualization | Create Multi-dimensional data visualization based on the effectiveness score. | 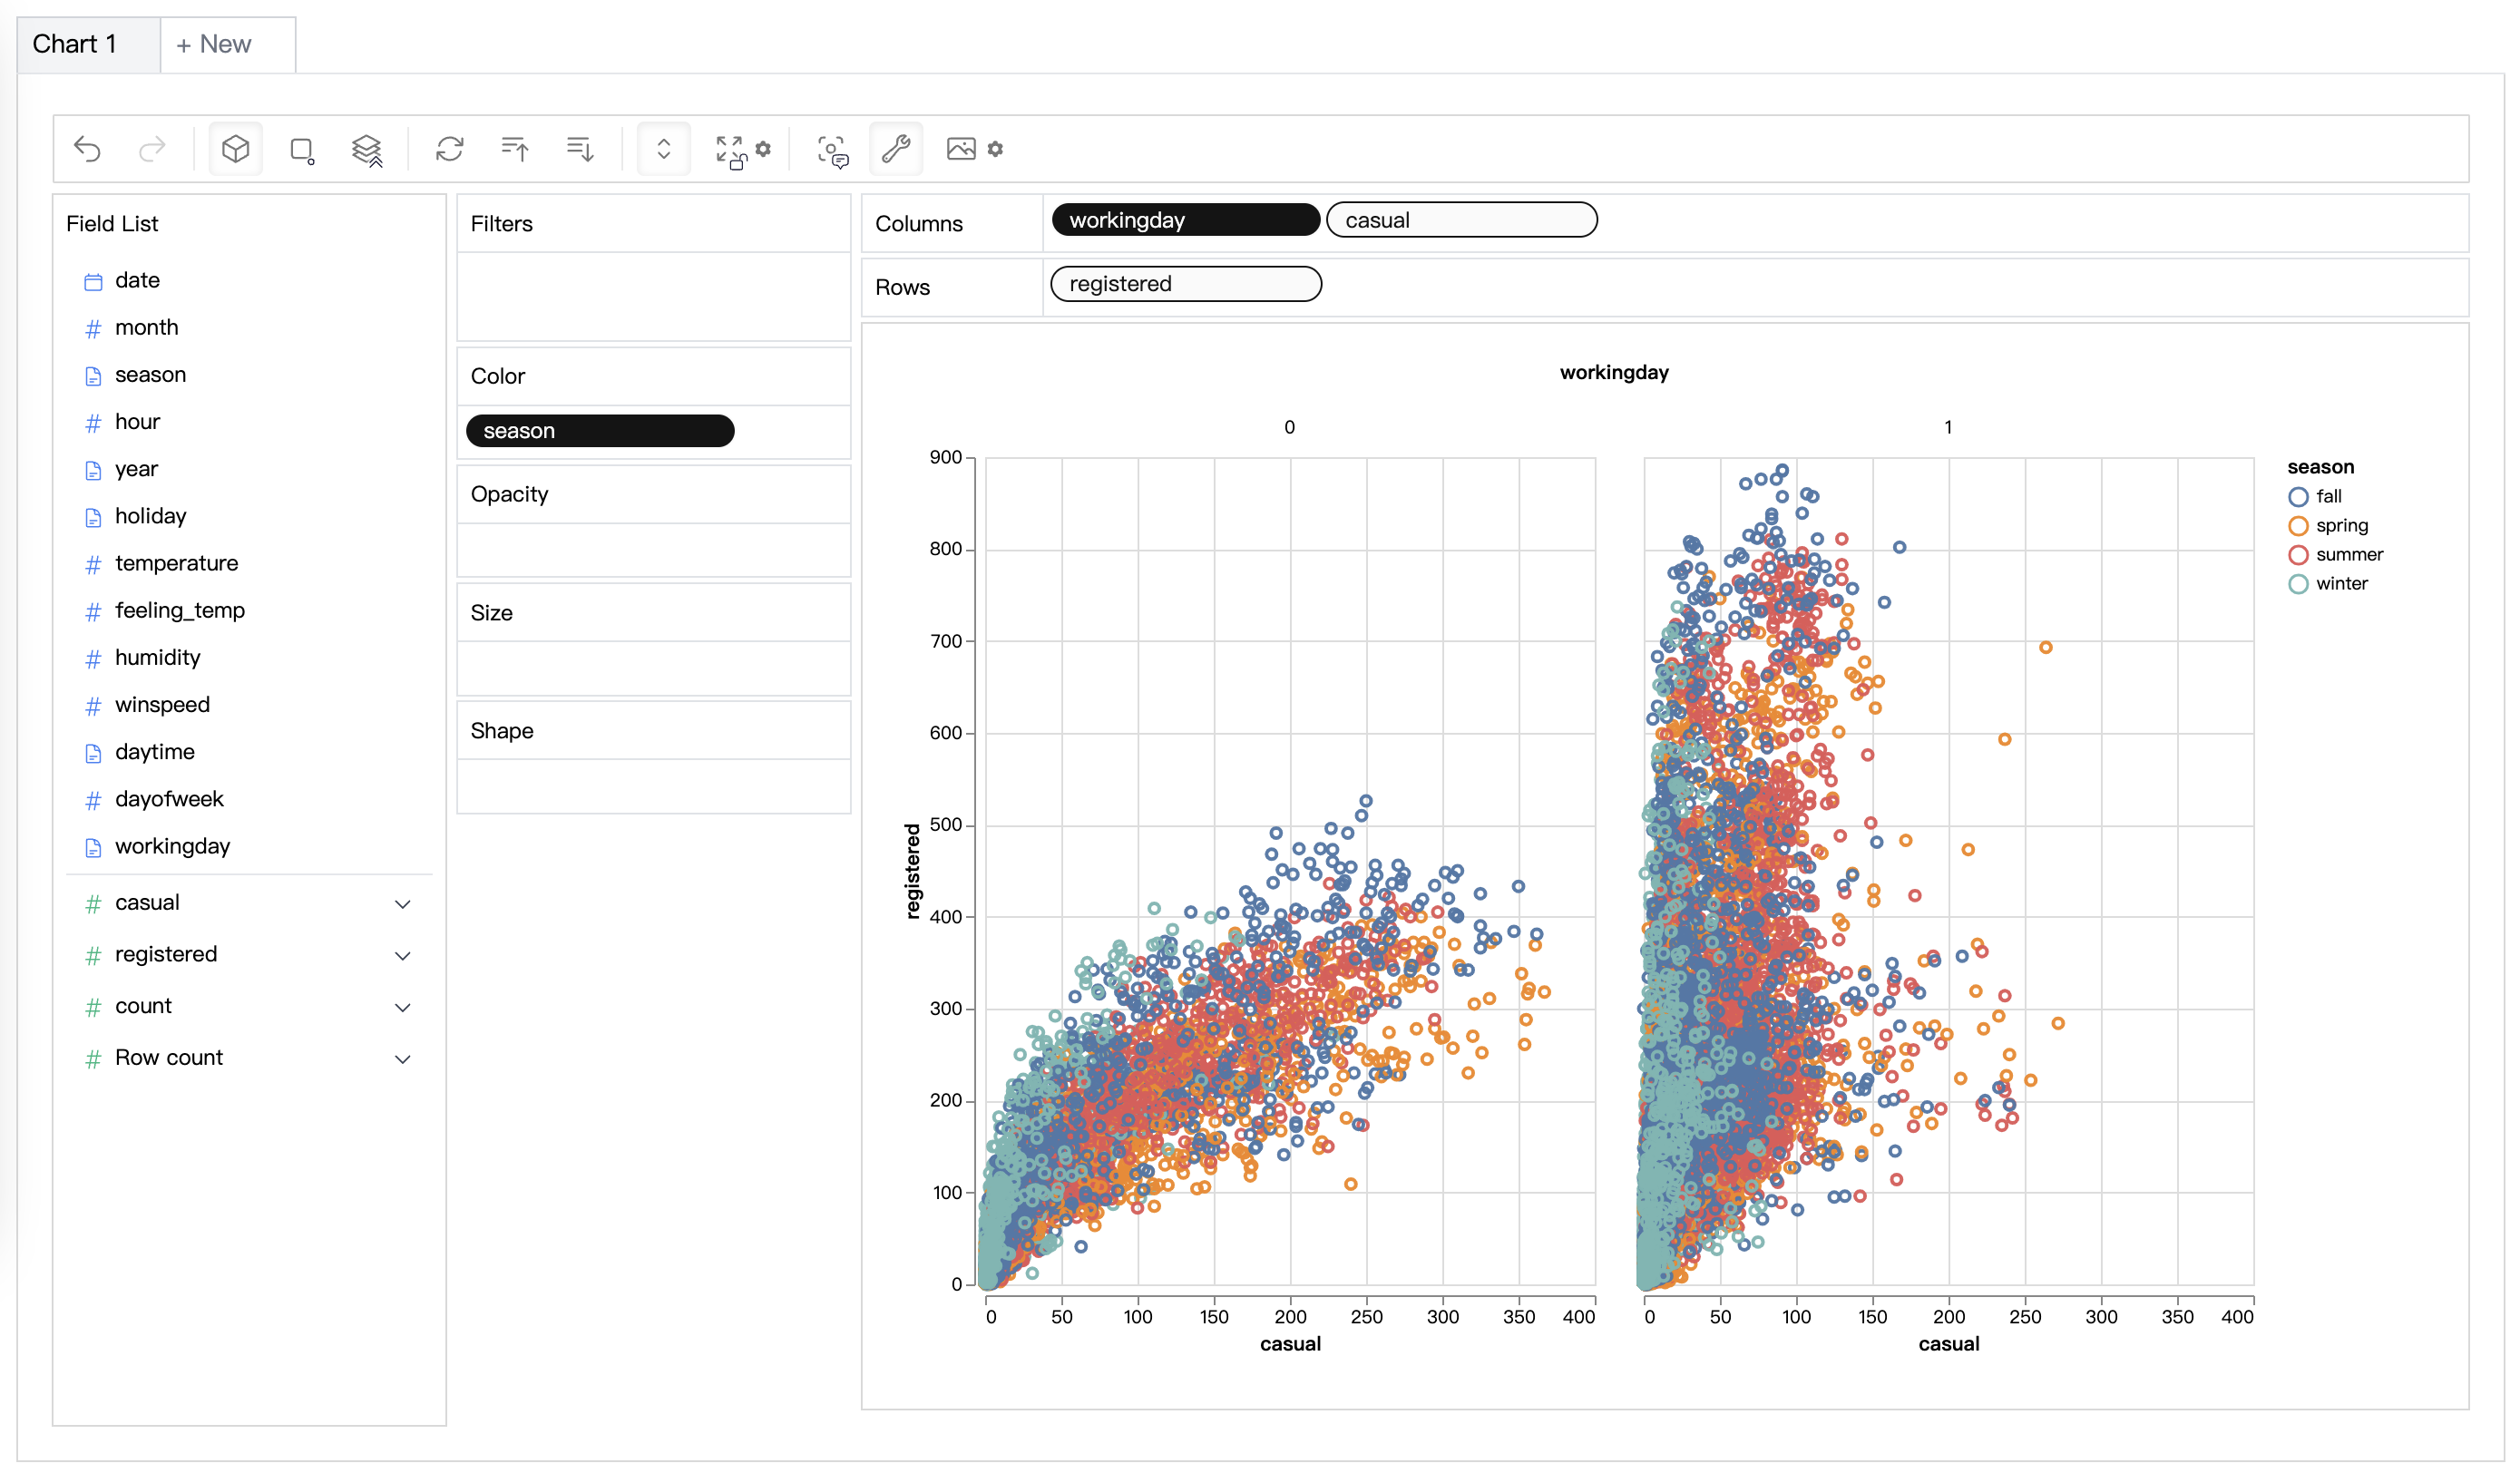 |
| Data Wrangler | Automated data wrangler for generating a summary of the data and data transformation. |  |
| Data Exploration Copilot | Combines automated data exploration and manual exploration. RATH will work as your copilot in data science, learn your interests and uses augmented analytics engine to generate relevant recommendations for you. |  |
| Data Painter | An interactive, instinctive yet powerful tool for exploratory data analysis by directly coloring your data, with further analytical features. |  |
| Dashboard | Build a beautiful interactive data dashboard (including an automated dashboard designer which can provide suggestions to your dashboard). |  |
| Causal Analysis | Provide causal discovery and explanations for complex relation analysis. | 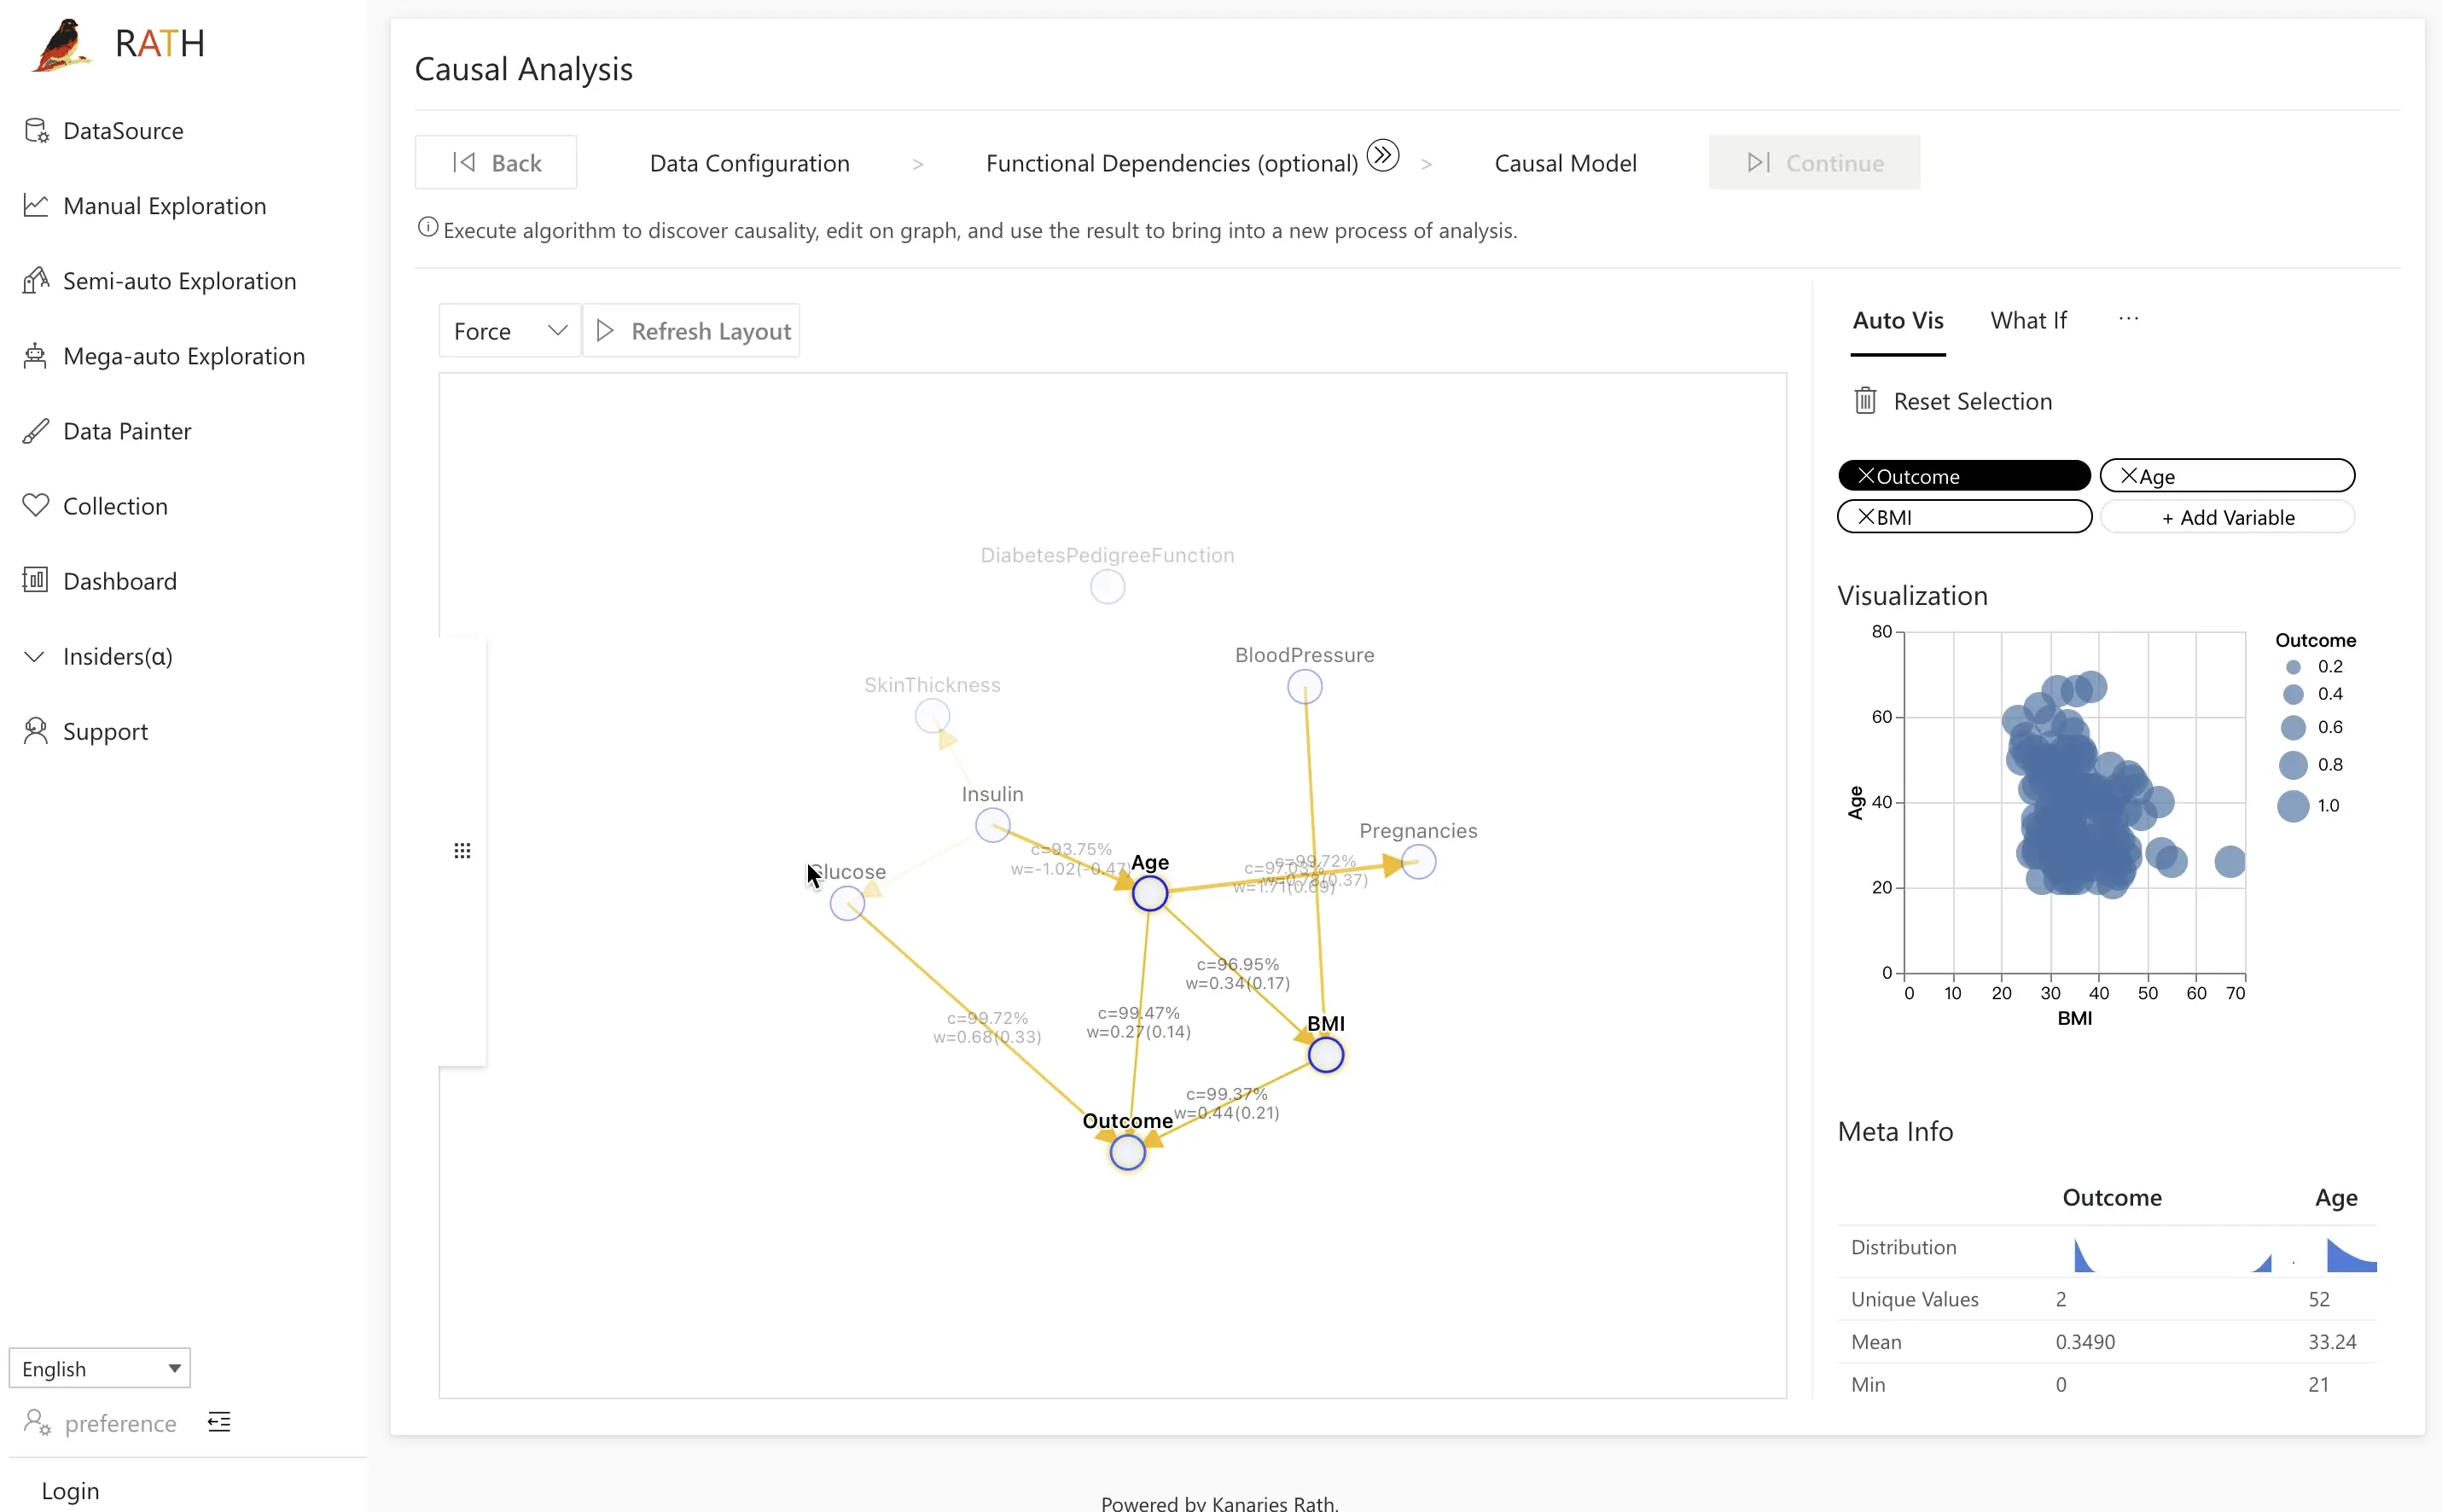 |
Besides ClickHouse, RATH supports a wide range of data sources. Here are some of the major database solutions that you can connect to RATH: MySQL, ClickHouse, Amazon Athena, Amazon Redshift, Apache Spark SQL, Apache Doris, Apache Hive, Apache Impala, Apache Kylin, Oracle, and PostgreSQL.
FAQ
What is the syntax for calculating the standard deviation of a column in ClickHouse?
The syntax for calculating the standard deviation of a column in ClickHouse is as follows:
stddev(column_name)For example, to calculate the standard deviation of the values in a column named "value", the query would be:
stddev(value)What is the difference between the stddev() and sampleStddev() functions in ClickHouse?
The stddev() function calculates the population standard deviation, while the sampleStddev() function calculates the sample standard deviation. In general, the population standard deviation is used when the entire population is being studied, while the sample standard deviation is used when only a sample of the population is being studied.
How does RATH support ClickHouse?
RATH is an open-source BI platform designed to help with data analysis. It comes with advanced features such as auto-insights and causal analysis and can connect to ClickHouse databases. This allows RATH to leverage the powerful analytical capabilities of ClickHouse to handle large amounts of data. RATH also supports other database engines, making it a versatile solution for data analysis and decision-making. Additionally, RATH makes it easy to import data from various sources and set ClickHouse as the data engine for faster data processing.
Conclusion
In summary, Exploratory Data Analysis is an important step in the data analysis process, and ClickHouse is a powerful tool for performing it on large datasets. The standard deviation is a key measure of data dispersion, and ClickHouse provides built-in support for calculating it. RATH, as an open-source augmented analytics business intelligence platform, natively supports ClickHouse and provides advanced features such as auto-insights and causal analysis, making it a great option for data analysis and data-driven decision-making.