Google Data Studio vs Tableau: A Showdown You Need to See
In the bustling marketplace of data visualization, two titans stand tall: Google Data Studio and Tableau. Both pack a punch with unique features and capabilities that have turned them into must-haves for businesses and individuals alike. So, you're standing at the crossroads, scratching your head, wondering which way to go? Don't sweat it. We're about to dive deep into these two heavyweights, comparing their strengths, weaknesses, pricing, and more.
Whether you're a newbie wetting your feet in the data visualization pool, or you're steering the ship of a massive enterprise seeking robust solutions, this comparison's got you covered. Let's jump right in!
What is Google Data Studio?
Google Data Studio, born and bred by tech behemoth Google, is a free, cloud-based, reporting tool. This tool has the uncanny ability to make dashboard and report creation as easy as pie. Its synergy with Google's other offerings such as Google Analytics, Firebase, and Google BigQuery makes it a sweetheart for those neck-deep in the Google ecosystem.
Here are some highlights of Google Data Studio:
- Cloud-based: No need for hardware installation.
- Collaboration: Multiple users can paint the same canvas, ideal for teamwork.
- Connectors: Easy data access across platforms.
- User-friendly: Low learning curve, get started in a jiffy!
But hold your horses, it's not all sunshine and roses. Google Data Studio might fall short when it comes to customization and offline functionality.
What is Tableau?
Tableau, on the other hand, is a formidable tool designed to woo experienced data analysts. What started as a desktop app has now blossomed into a cloud-hosted powerhouse. Where Tableau truly shines is its ability to create custom dashboards and dig deep with exploratory data analysis.
Some winning features of Tableau include:
- Diverse Data Connections: Syncs with sources like Excel, Google BigQuery, Salesforce, and more.
- Charting & Exploration: Deeper interactivity and robust exploration tools.
- Complexity: Great for detailed and in-depth analysis.
However, every rose has its thorns. Tableau can burn a hole in your pocket with its tiered pricing, and you'll need to have your tech game on point to make the most of it.
Google Data Studio vs Tableau: A Feature Showdown
When comparing Google Data Studio and Tableau, it's essential to consider their features. Google Data Studio stands out for its seamless integration with Google's offerings, including BigQuery, Firebase, and Google Analytics. It supports most of its data formats and provides automated real-time dashboard updates. Additionally, it supports data blending and drill-down analyses, making it a versatile tool for data visualization.
Tableau, in contrast, offers multi-factor authentication and Row Level Security. It natively connects to file-based and cloud-based data resources, many databases, and Excel files. It also offers easy connections to customer relationship management systems (CRM) such as Salesforce. Furthermore, Tableau offers a more robust set of charting and exploration tools than Google Data Studio, supporting deeper interactivity for users as they create reports.
| Google Data Studio | Tableau | |
|---|---|---|
| Integration | Seamless integration with Google's offerings, including BigQuery, Firebase, and Google Analytics. | Offers multi-factor authentication and Row Level Security. |
| Data Formats | Supports most of its data formats and provides automated real-time dashboard updates. | Connects to file-based and cloud-based data resources, many databases, and Excel files. |
| Data Blending & Drill-down Analyses | Supports data blending and drill-down analyses. | Connects to CRM systems such as Salesforce. |
| Charting & Exploration Tools | Limited compared to Tableau. | Offers a more robust set of charting and exploration tools, supporting deeper interactivity for users. |
Google Data Studio vs Tableau: A Data Visualization Comparison
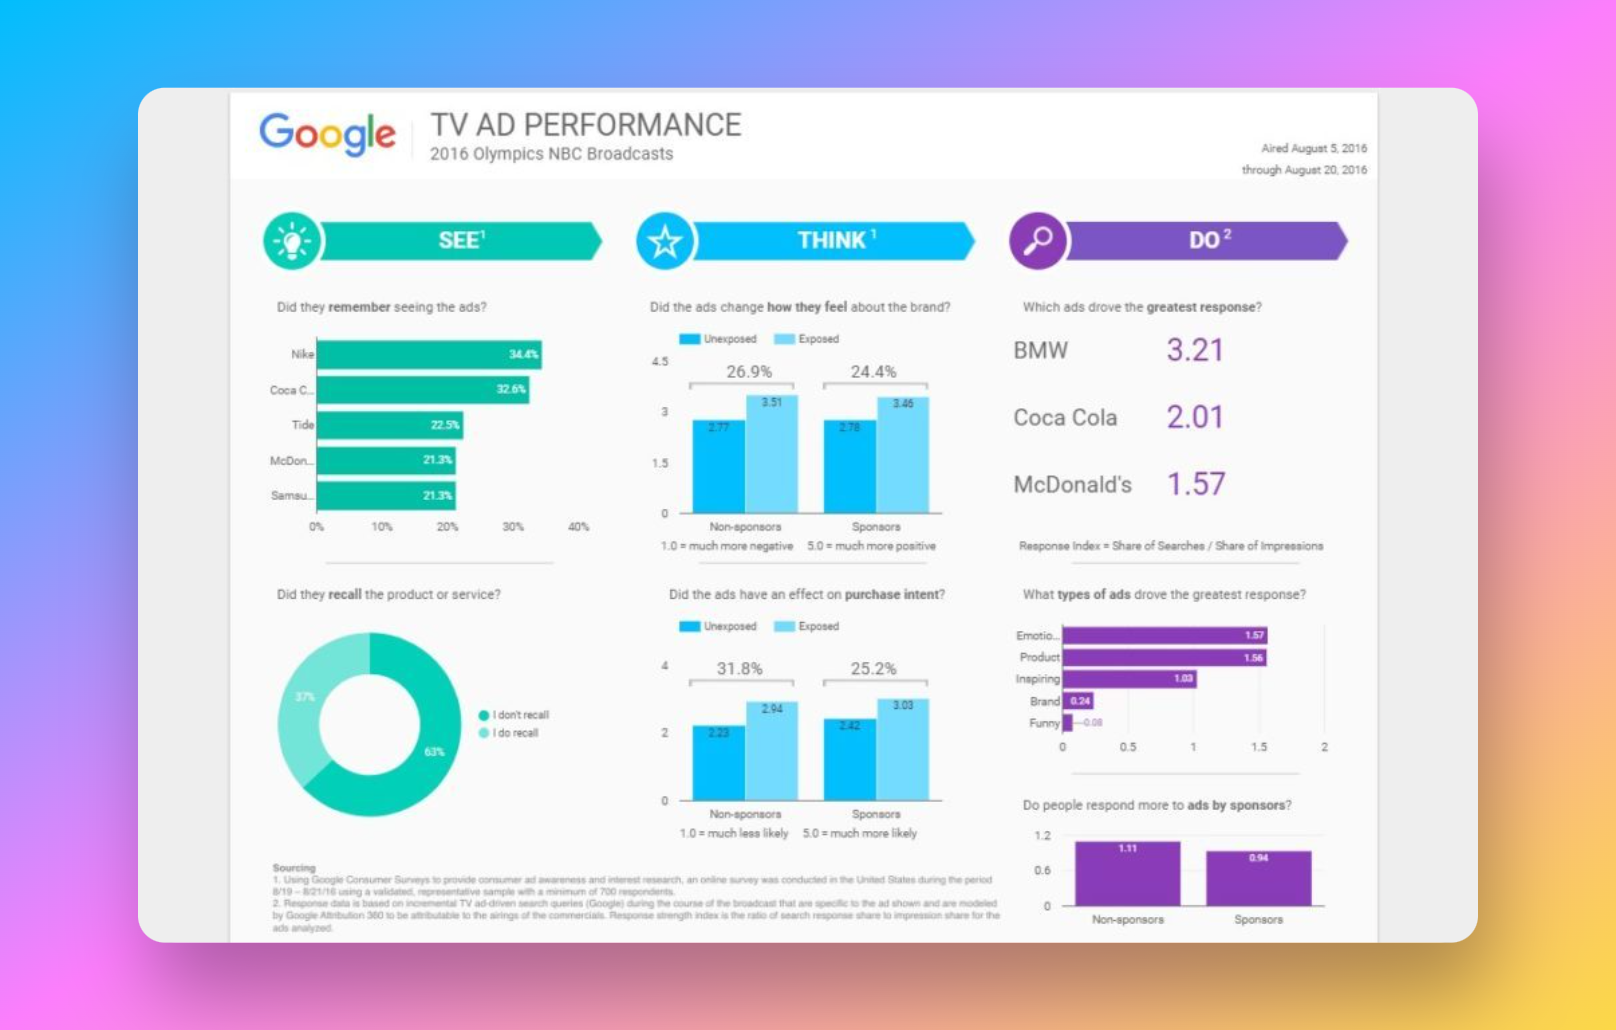
Data visualization is the heart of both Google Data Studio and Tableau. Google Data Studio excels at delivering eye-catching charts of all kinds, like bullet charts, graphics, geo maps, heat maps, pie charts, pivot tables, scorecards, and many more representations. It's perfect for viewing digitally focused business and marketing metrics such as ad spend, site traffic, and search rankings. Google Data Studio also allows users to customize their reports and dashboards, including adding logos, icons, and other elements.
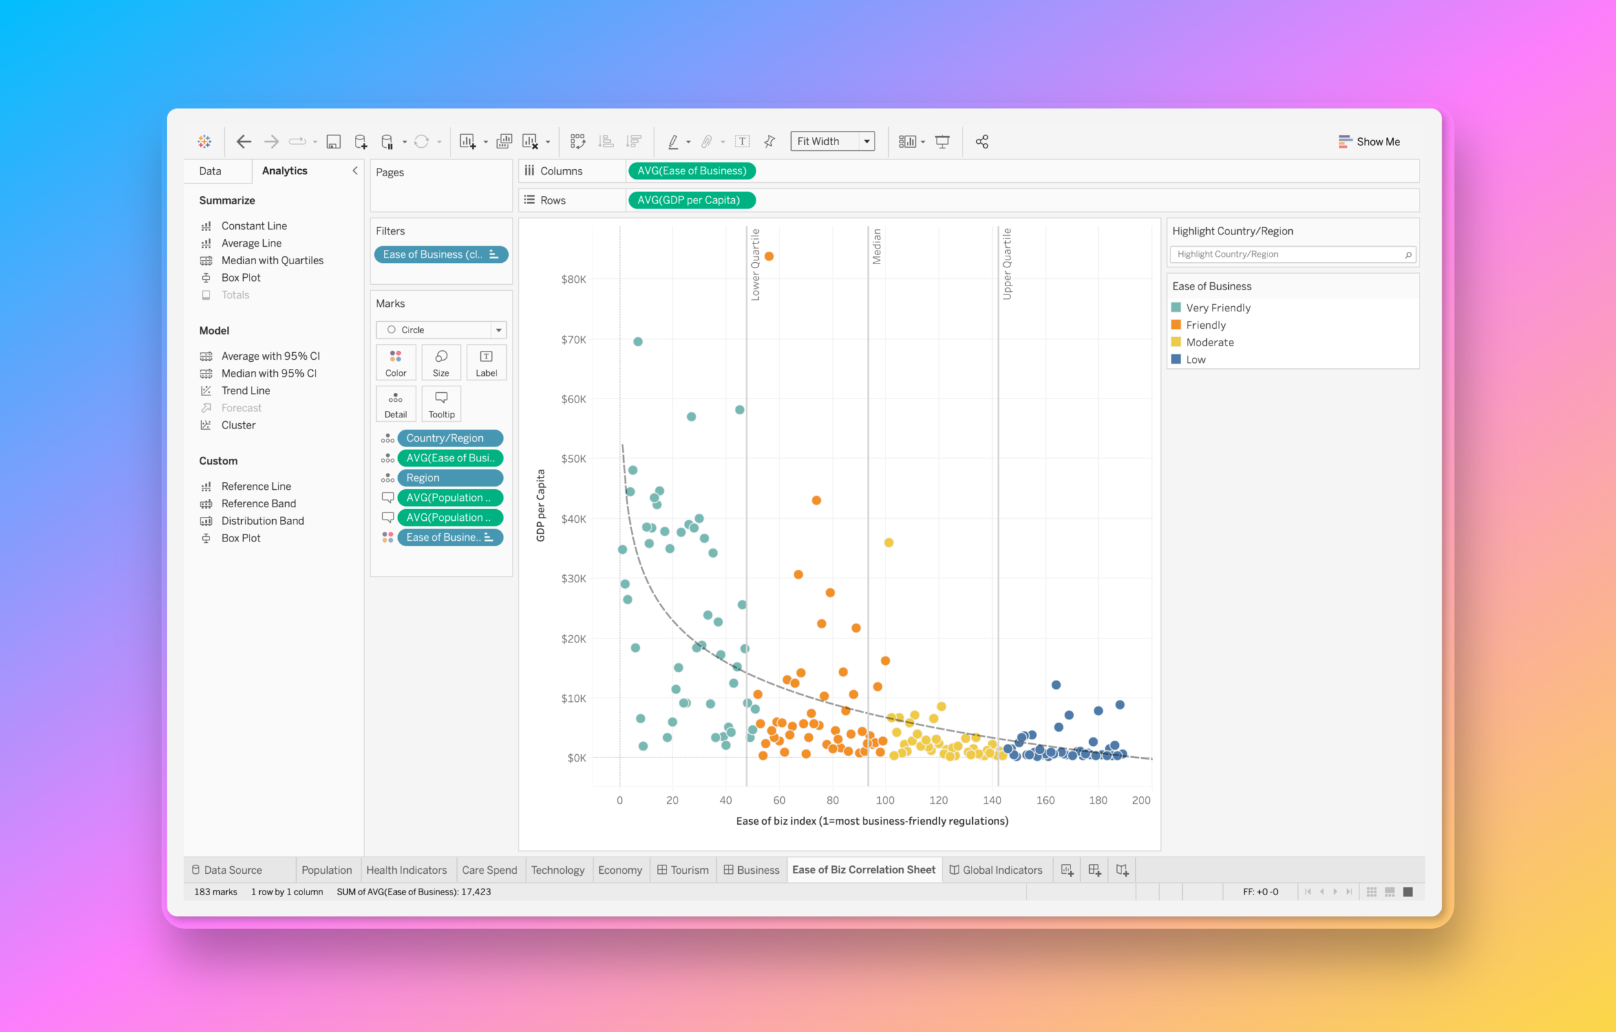
Tableau, on the other hand, turns data into beautiful and functional charts, graphics, cluster maps, heat maps, infographics, and many more. It's designed for experienced data scientists and casual business users alike, enabling everyone to create, modify, and adapt visuals to suit almost any situation or need. If you're looking for simple, basic data charts, Google Data Studio is your go-to. But if you want a plethora of complex, detailed representations, Tableau is your best bet.
| Google Data Studio | Tableau | |
|---|---|---|
| Chart Types | Offers bullet charts, graphics, geo maps, heat maps, pie charts, pivot tables, scorecards, etc. | Turns data into functional charts, graphics, cluster maps, heat maps, infographics, etc. |
| User Customization | Allows users to customize their reports and dashboards, including adding logos, icons, and other elements. | Designed for both experienced data scientists and casual business users to create, modify, and adapt visuals. |
| Primary Focus | Perfect for viewing digitally focused business and marketing metrics. | If you want a plethora of complex, detailed representations, Tableau is your best bet. |
Functionality Face-off: Google Data Studio vs Tableau
In terms of functionality, Google Data Studio offers a clean, simple, easy-to-use interface. It's a fast, efficient tool that provides flexibility and power. It also provides users with solid automation features, such as scheduled reporting and updates.
Tableau, however, is split into five parts: Tableau Desktop, Tableau Public, Tableau Server, Tableau Online, and Tableau Reader. It supports many concurrent users and provides fast data processing while consuming marginal system resources. The tool also offers a great selection of advanced features and functionalities, including data cleansing capabilities, which Google Data Studio lacks.
In the next segment, we'll delve into the pros and cons of each tool, their pricing, and prerequisites. Stay tuned to find out which tool is the ultimate winner in this head-to-head comparison of Google Data Studio vs Tableau.
| Google Data Studio | Tableau | |
|---|---|---|
| Interface | Offers a clean, simple, easy-to-use interface. | Is split into five parts: Tableau Desktop, Public, Server, Online, and Reader. |
| Automation Features | Provides users with solid automation features, such as scheduled reporting and updates. | Supports many concurrent users and provides fast data processing while consuming marginal system resources. |
| Advanced Features | Lacks some advanced features compared to Tableau. | Offers a great selection of advanced features and functionalities, including data cleansing capabilities. |
Google Data Studio vs Tableau: Pros and Cons
Every tool has its strengths and weaknesses, and Google Data Studio and Tableau are no exceptions. Let's take a look at the pros and cons of each.
Google Data Studio
Pros
- It's free and easy to install.
- It works seamlessly with other Google products.
- It allows real-time data integration and multiple users can create and edit visualizations at once.
- It runs off the cloud, eliminating maintenance hassles.
Cons
- It requires an internet connection to function.
- It offers limited customization options and only has about 50 components per page.
- It lacks native connector support for cloud-based data sources like Hubspot.
Tableau
Pros
- It's available either as software or as a cloud-based app.
- It facilitates data blending and gives users a generous selection of visuals to illustrate their data.
- It easily handles complex transformation support.
Cons
- It can be pricey and requires users who have some technical proficiency.
- It's easy to share data within your organization, but not so much with external clients.
- Although it's available online or on-premises, it's better suited to the latter function.
Google Data Studio vs Tableau: Pricing Comparison
When it comes to pricing, Google Data Studio has a clear advantage - it's free. All you need is an active Google account, and you're good to go!
Tableau, on the other hand, uses a tiered pricing model. It offers a free version, Tableau Public, with limited storage and privacy options. The full-featured offering, Tableau Creator, runs either in the cloud or on-premises and costs $70 per month, billed annually. Tableau Explorer and Tableau Viewer, which come with a single Tableau Server license, cost $35 and $12 per month respectively when deployed on-premises, and $42 and $15 per month respectively when deployed on the cloud.
The Third Option: Using RATH for Open Source Data Visualisation
For people who are confused about the complexity of the preparatory tools such as Google Data Studio and Tableua, there is a third, Open Source alternative that gives you excellent data visualization results leveraging the power of AI:
RATH (opens in a new tab) enables you to streamline your data analysis workflow and effortlessly discover insights from complex data sources, creating highly-customizable multi-dimensional Data Visualizations. Beyond that, RATH has a powerful Augmented Analytics engine that identifies patterns, insights, and causal inferences to support data-driven decision-making.
Easily Explore Data
Before getting started with Data Analysis, it is always the best practice to prepare your data. RATH is equipped with a wide amount of features such as:
- Overview your data on the Data Source tab.
- Data Profiling
- Data Transformation
- NLP-powered Text Pattern Extraction
The following demo video demonstrates how to take a glance over your data statistics:
Drag & Drop, Build Charts
For users with a more traditional BI background, RATH has an easy-to-use, tableau-alternative feature called Manual Exploration. You can create highly customizable charts by dragging and dropping variables to shelves. Watch the following demo video about Exploring the seasonal relationships between registered users and casual users.
Causal Analysis Made Easy
Causal discovery is a critical part of the data analysis process. RATH has included the Causal Discovery feature that is ready for everyone.
Paint the Data Insights
Discovering the underlying patterns and trends from a complicated data source can be extremely challenging. The Data Painter feature is designed to fix this problem. You can easily clean data, model data, and explore data using a Painting Tool, which turns the complex Exploratory Data Analysis process visual and simple.
The following demo video shows the process of finding out the meaning of the trend within a certain data set:
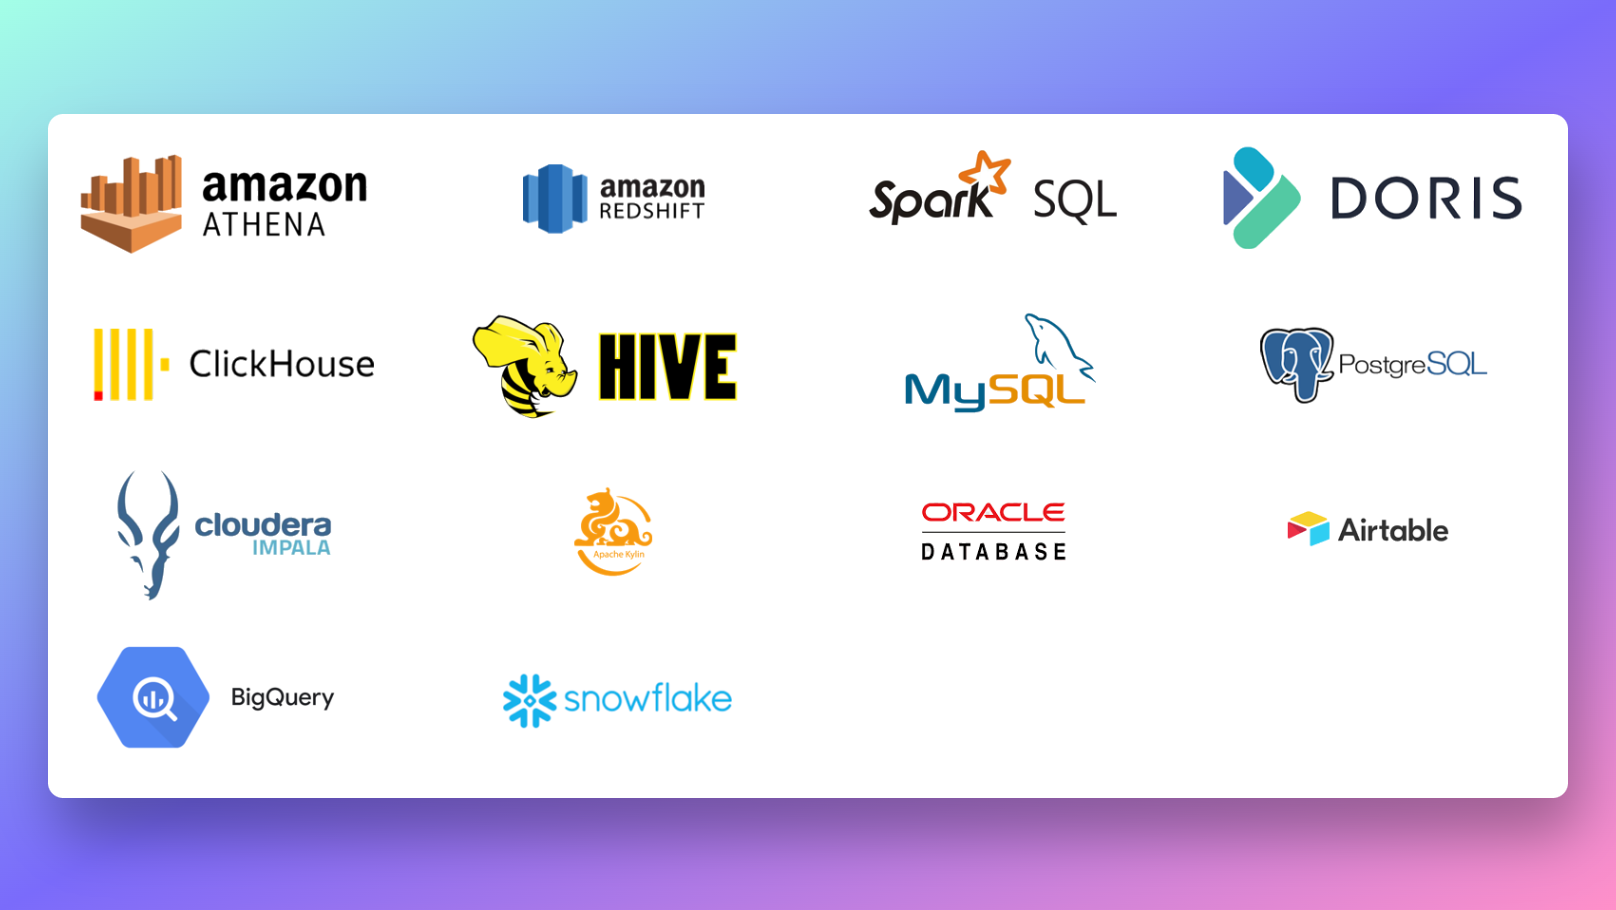
Supported Databases
RATH supports a wide range of data sources. Here are some of the major database solutions that you can connect to RATH:
Open Source Community
(opens in a new tab)
(opens in a new tab)
(opens in a new tab)

RATH is created by a group of passionate and dedicated Data Scientists and Programmers. We are trying to build a global community that shares the same vision for the future of Data Analysis and Data Visualization.

Feel free to join the discussions on our Discord (opens in a new tab). Don't forget to leave us a ⭐️ on GitHub (opens in a new tab)!
Google Data Studio and Tableau: System Requirements
Google Data Studio, being a cloud-based tool, doesn't have any specific system requirements. All you need is a device with an internet connection and a Google account.
Tableau, however, has specific system requirements for installation. It requires a 64-bit processor that supports SSE4.2 and POPCNT instruction sets. It also requires a minimum of 16GB RAM and 15GB free disk space. For single-node production use, it requires an 8-core, 2.0 GHz or higher processor and 64 GB RAM.
Google Data Studio vs Tableau: Which is Better for Your Business?
The choice between Google Data Studio and Tableau largely depends on your business's needs. If you're a small to medium business, Google Data Studio may be enough for you, especially if your organization is budget conscious. However, if your business is growing and challenging larger companies, Tableau might be the better choice. You can also estimate your need by the organization's volume of data and processes.
Google Data Studio and Tableau: A Comparison with Other Tools
While Google Data Studio and Tableau are both powerful tools, it's worth noting how they stack up against other data visualization tools in the market.
Google Data Studio vs Excel: While Excel is a versatile tool for data analysis, Google Data Studio shines in data visualization and reporting. It also allows for real-time collaboration, a feature Excel lacks.
Google Data Studio vs Power BI: Power BI offers more advanced data modeling capabilities and a wider range of visualization options. However, Google Data Studio is more user-friendly and integrates better with Google's suite of products.
Tableau vs Qlik Sense: Both Tableau and Qlik Sense offer robust data visualization capabilities. However, Qlik Sense is more intuitive and user-friendly, while Tableau offers more advanced features for experienced data analysts.
Tableau vs Looker: Looker is a modern data platform that offers data modeling and visualization. While it's a powerful tool, Tableau offers more flexibility and customization options in its visualizations.
- Runcell Science: An Open Source Alternative to Claude Science for Research Workflows
- How to Make Mac Not Sleep: Keep Codex, Claude Code, and AI Agents Running
- OpenClaw vs ZeroClaw vs Pi Agent vs Nanobot: Which AI Agent Stack Should You Choose in 2026?
- Can Claude Code Analyze Jupyter Notebooks for Data Science? What It Actually Does
- Claude Code Routines: Why AI Agent Cron Jobs Matter
- Claude Code Desktop Bypass Permissions: How to Enable It
- How to Build Two Python Agents with Google’s A2A Protocol - Step by Step Tutorial
- Top 10 growing data visualization libraries in Python in 2025
Conclusion
In the battle between Google Data Studio and Tableau, there's no clear winner. Both tools offer unique features and capabilities that make them stand out in the realm of data visualization. The choice between the two ultimately depends on your specific needs, budget, and technical proficiency. Whether you're a beginner or an enterprise user, both tools have something to offer. So, take the time to evaluate your needs and make an informed decision.
Frequently Asked Questions
1. What is the difference between Google Data Studio and Tableau?
Google Data Studio is a free, user-friendly tool that integrates well with Google's suite of products. It's ideal for beginners and small to medium businesses. Tableau, on the other hand, is a more advanced tool that offers robust data visualization capabilities. It's better suited for experienced data analysts and larger businesses.
2. Which tool is better for beginners?
Google Data Studio is generally more user-friendly and easier to learn, making it a better choice for beginners. RATH is also an Open Source Alternative for Tableau that worth considering.
3. What are the pricing plans for Google Data Studio and Tableau?
Google Data Studio is free to use. Tableau uses a tiered pricing model, with the full-featured Tableau Creator costing $70 per month, billed annually.