ChartGPT: Create Beautiful Charts with Text in Seconds
Updated on
ChatGPT is one of the hottest names in the town, sitting on the crown of the large language model(LLM). For data analysts who need to create charts from data, it has long been a dream for using the magic wand of ChatGPT for automatic chart building.
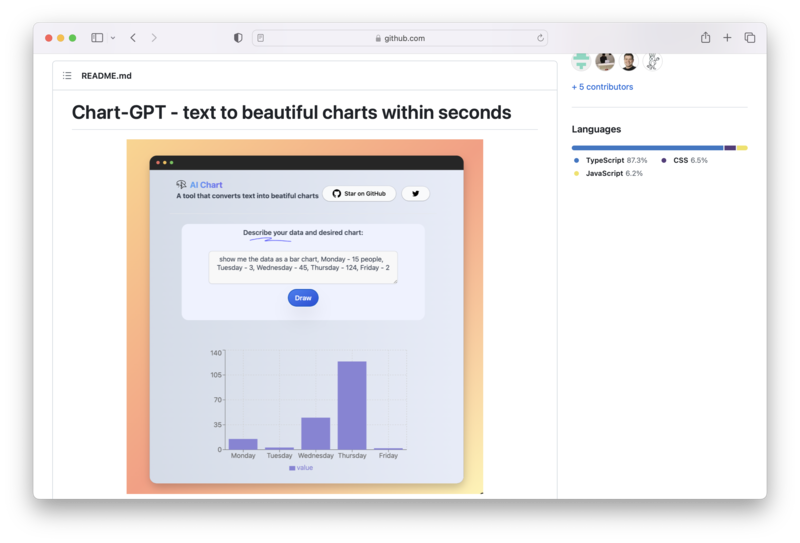
Enter ChartGPT, a powerful tool that converts text into beautiful charts within seconds. In this article, we'll explore ChartGPT, its features, and how to get started. We'll also introduce you to VizGPT, an alternative tool that offers a unique chat-based interface for creating and editing data visualizations.
What is ChartGPT?
ChartGPT is an open-source project designed to make the process of creating charts as easy as writing a simple text description. With a few lines of code, you can generate visually appealing and informative charts based on your data. Whether you're a seasoned data analyst or just starting, ChartGPT can help simplify your charting tasks.

Getting Started with ChartGPT
Setting up ChartGPT is a breeze. Follow the steps below to get started:
- Clone the ChartGPT repository:
git clone https://github.com/whoiskatrin/chart-gpt.git
cd chart-gpt- Duplicate the
.env.exampletemplate and add your OpenAI API key:
cp .env.example .env
OPENAI_API_KEY="your-api-key"- Install the dependencies and start the development server:
npm install
npm run dev

## or
yarn
yarn dev
Now you're ready to go! The development server will start at http://localhost:3000.
Contributing to ChartGPT
ChartGPT is an open-source project, and contributions are welcome. If you'd like to contribute, follow these steps:
- Fork the ChartGPT repository.
- Clone your forked repository.
- Make your changes, commit them, and push them to your forked repository.
- Create a pull request on the ChartGPT repository.
VizGPT: An Alternative to ChartGPT
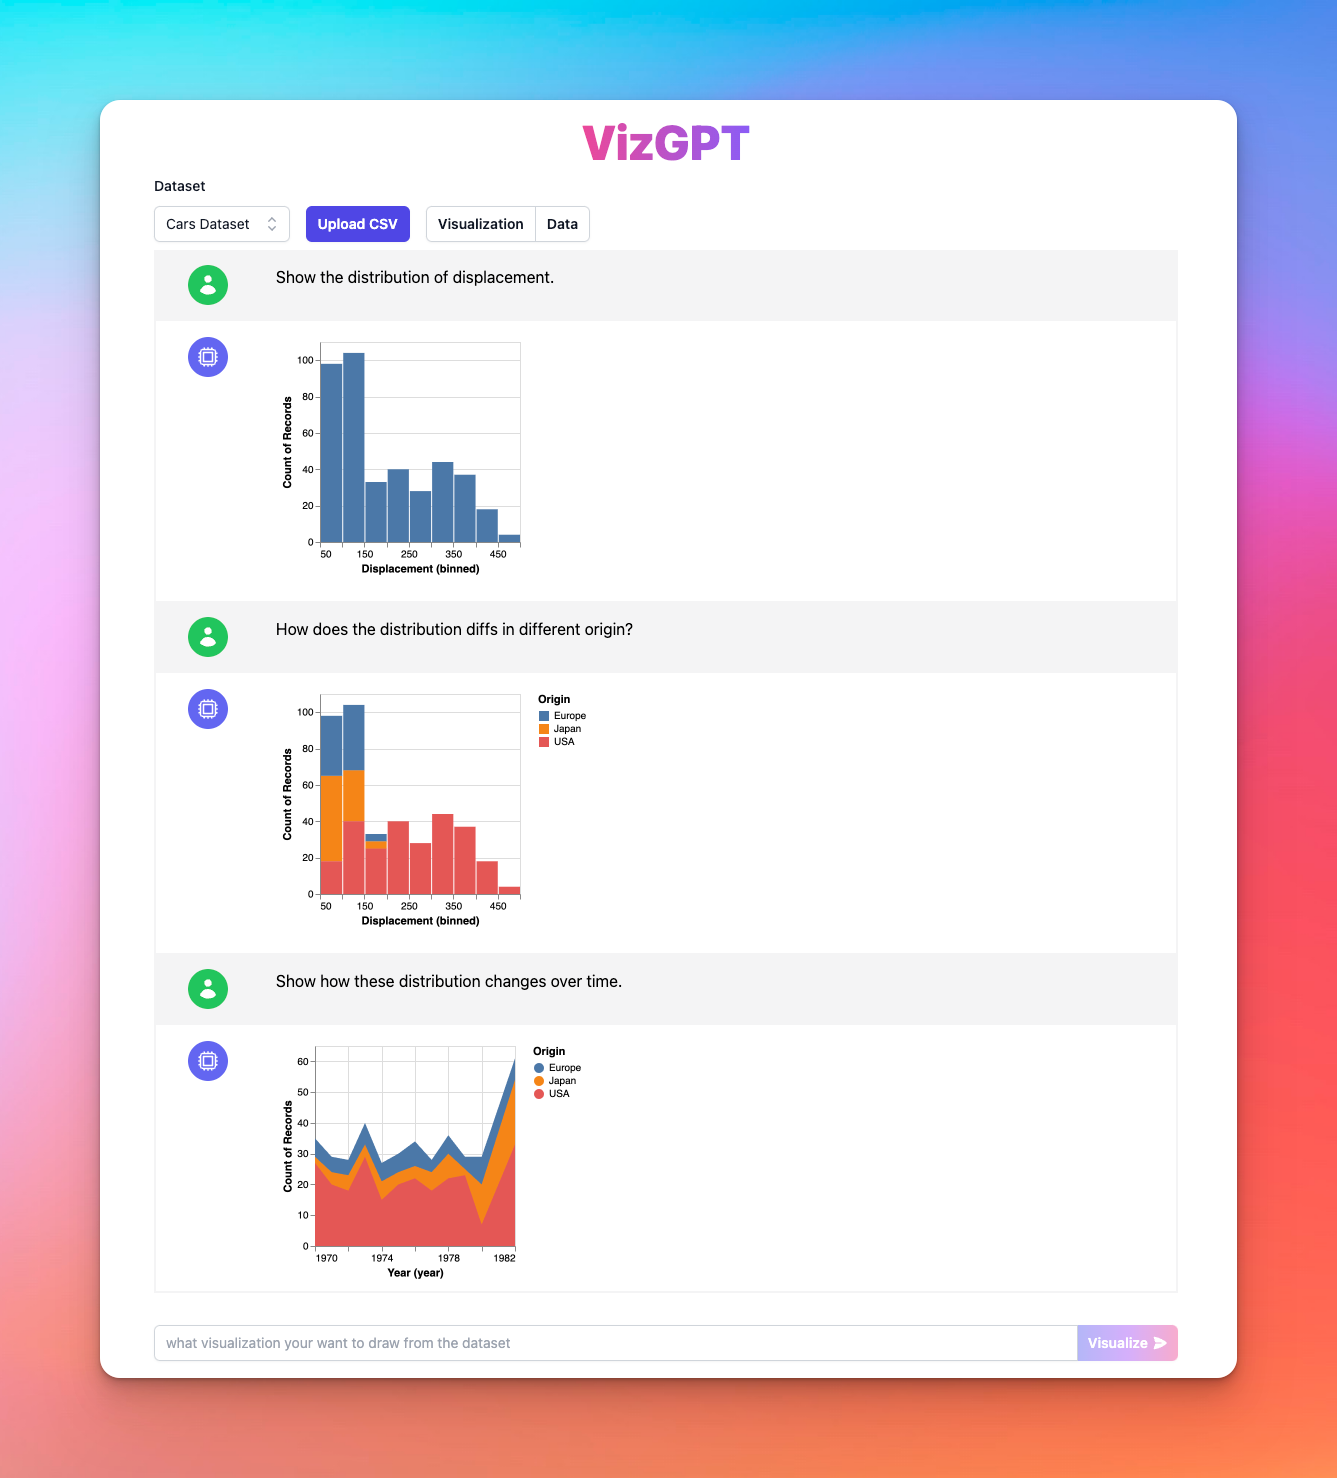
While ChartGPT is an excellent tool for creating charts from text, there's another tool you might want to consider: VizGPT (opens in a new tab). VizGPT provides a chat interface to create and edit data visualizations. Not only can it generate visualizations with a natural language query, but you can also transform or edit your visualization in context.
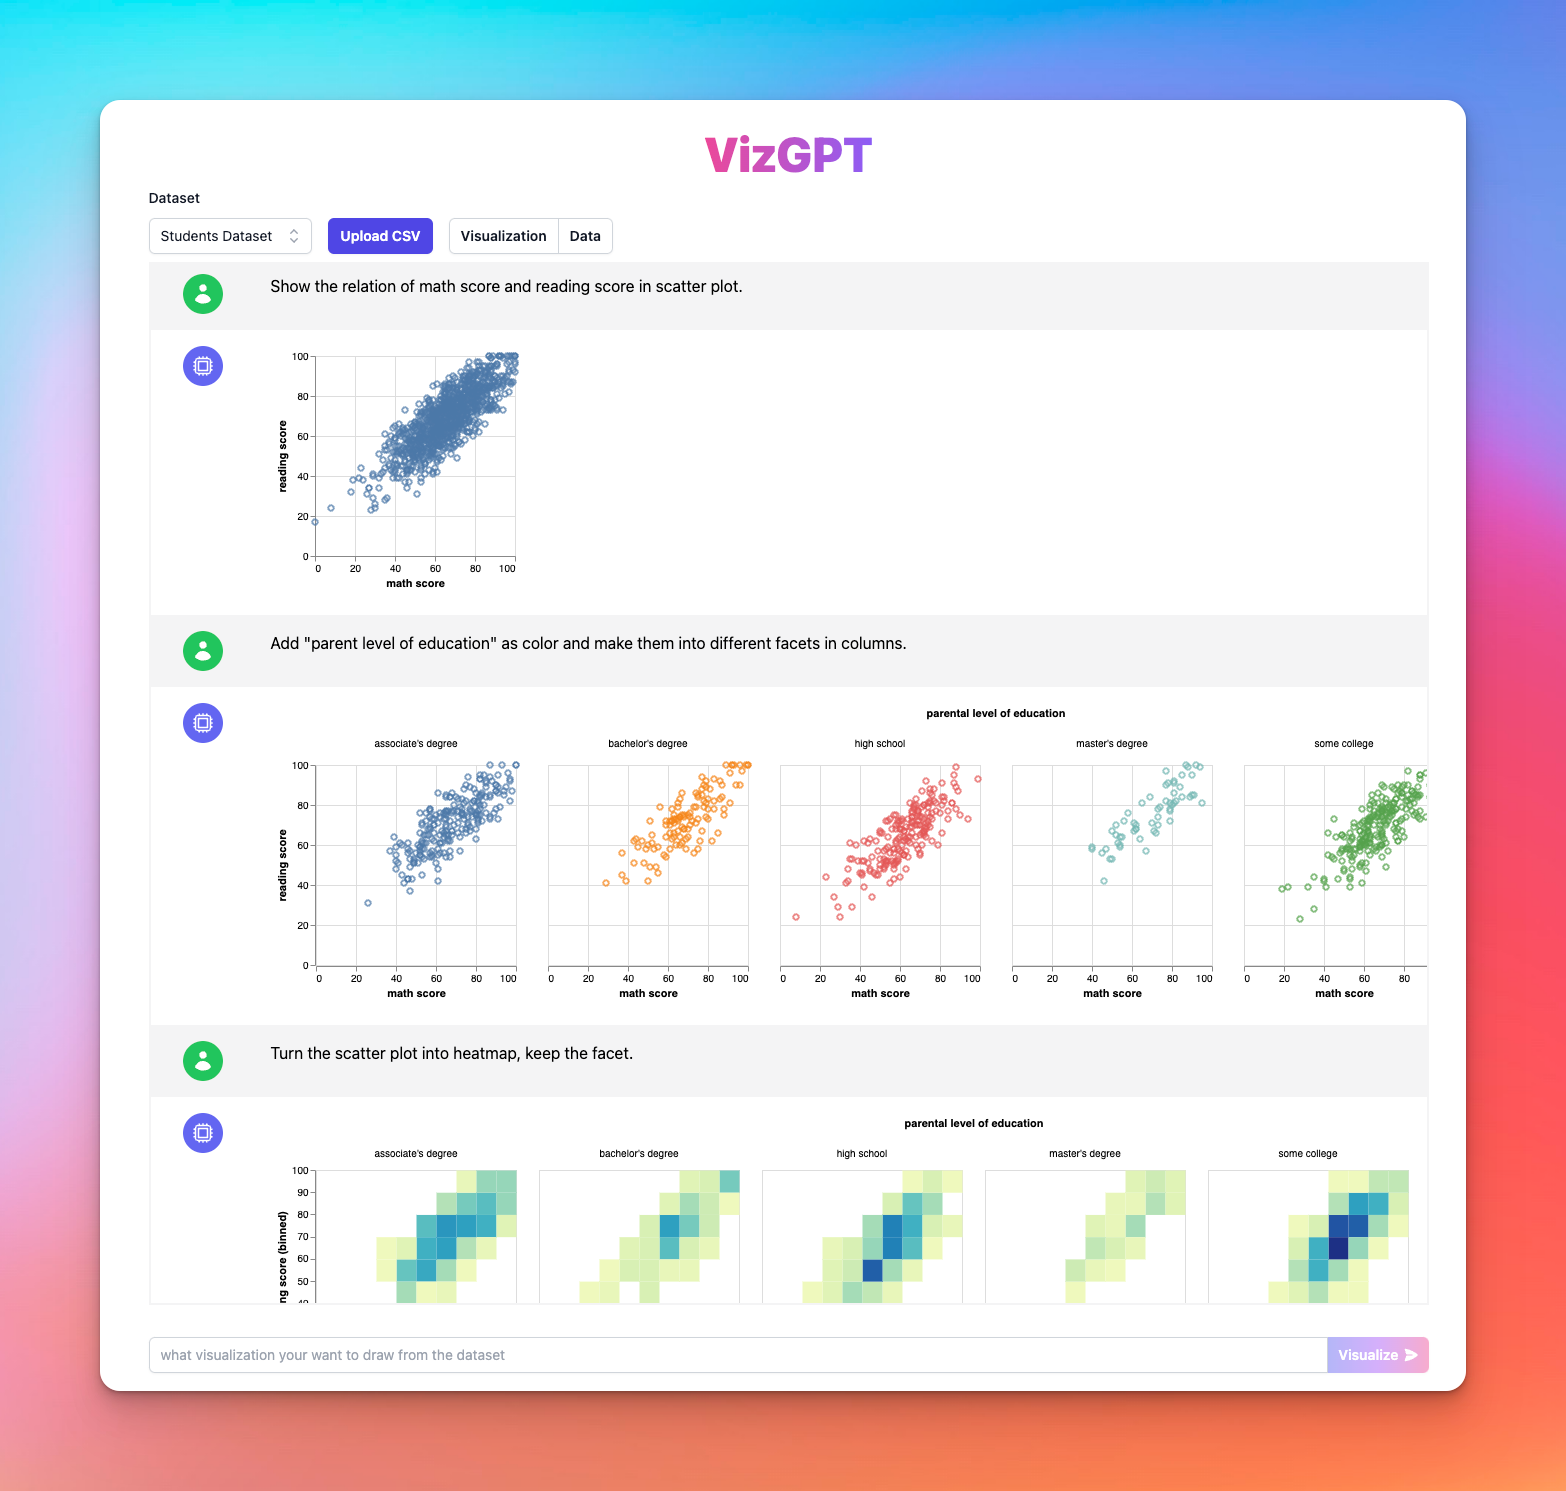
VizGPT allows you to build complex visualizations step by step through chatting, instead of designing a large prompt at once. This makes it ideal for users who are not familiar with data visualization tools or data transformations.
Some of the features VizGPT offers include:
- Natural language to data visualization using Vega-Lite (opens in a new tab)
- Chat context for editing visualizations, allowing users to make changes if the chart doesn't meet their expectations
- Step-by-step exploration of data through chat-based interaction with visualizations
- Uploading your own CSV dataset to create custom visualizations
Feeling good? Try it out at VizGPT Online Playground (opens in a new tab) right now!
Final Thoughts
VizGPT is a powerful tool that makes creating beautiful charts from text a breeze. Its easy-to-use setup and development server make it accessible to users of all skill levels, with a unique approach to building and editing data visualizations through natural language queries. By utilizing tools like VizGPT, creating visually appealing and accurate charts is now more accessible than ever. So, whether you're a seasoned data analyst or just starting out, give VizGPT a try and see how it can transform your charting experience.
Remember, both ChartGPT and VizGPT are open-source projects (opens in a new tab), so feel free to contribute and help improve these powerful tools for the data visualization community.
Happy charting!
FAQ
Can GPT-4 create charts?
While GPT-4 is a highly advanced text-based model, it doesn't inherently create visual charts. However, tools like ChartGPT have been developed to harness the power of GPT-4, making it possible to transform textual descriptions into visual charts.
Is there AI that can create charts and graphs?
Yes, there are several AI tools that can generate charts and graphs from text or data. ChartGPT and VizGPT are two such tools that leverage AI for data visualization. ChartGPT can convert text into beautiful charts within seconds, while VizGPT provides a chat-based interface for creating and editing data visualizations using natural language queries.
How to use Chart GPT? You can follow the README file of Chart GPT GitHub Repo, or Try VizGPT, a userfriendly tool that can quickly generate complicated data visualization with the power of ChatGPT.

