Vega Visualization with RATH
What is Vega/Vega-Lite?
Vega is a declarative language that provides the tools to support custom visualizations of large datasets, high-level exploratory data analysis, as well as flexible combinations of data visualization designs and interaction techniques. The Vega specification is in JSON structure, making it easy to understand, create, and operate programmatically.
Vega/Vega-Lite facilitates the use of data visualization across a variety of web applications with its toolkit for data visualization. It provides a framework for data visualization designs such as data loading, transformation, scales, map projections, and graphical marks. Interaction techniques can be specified using reactive signals that dynamically modify a visualization in response to input event streams.
For more details about Vega language syntax, refer to the Vega specification documentation (opens in a new tab).
How RATH Integrates Vega/Vega-Lite Language
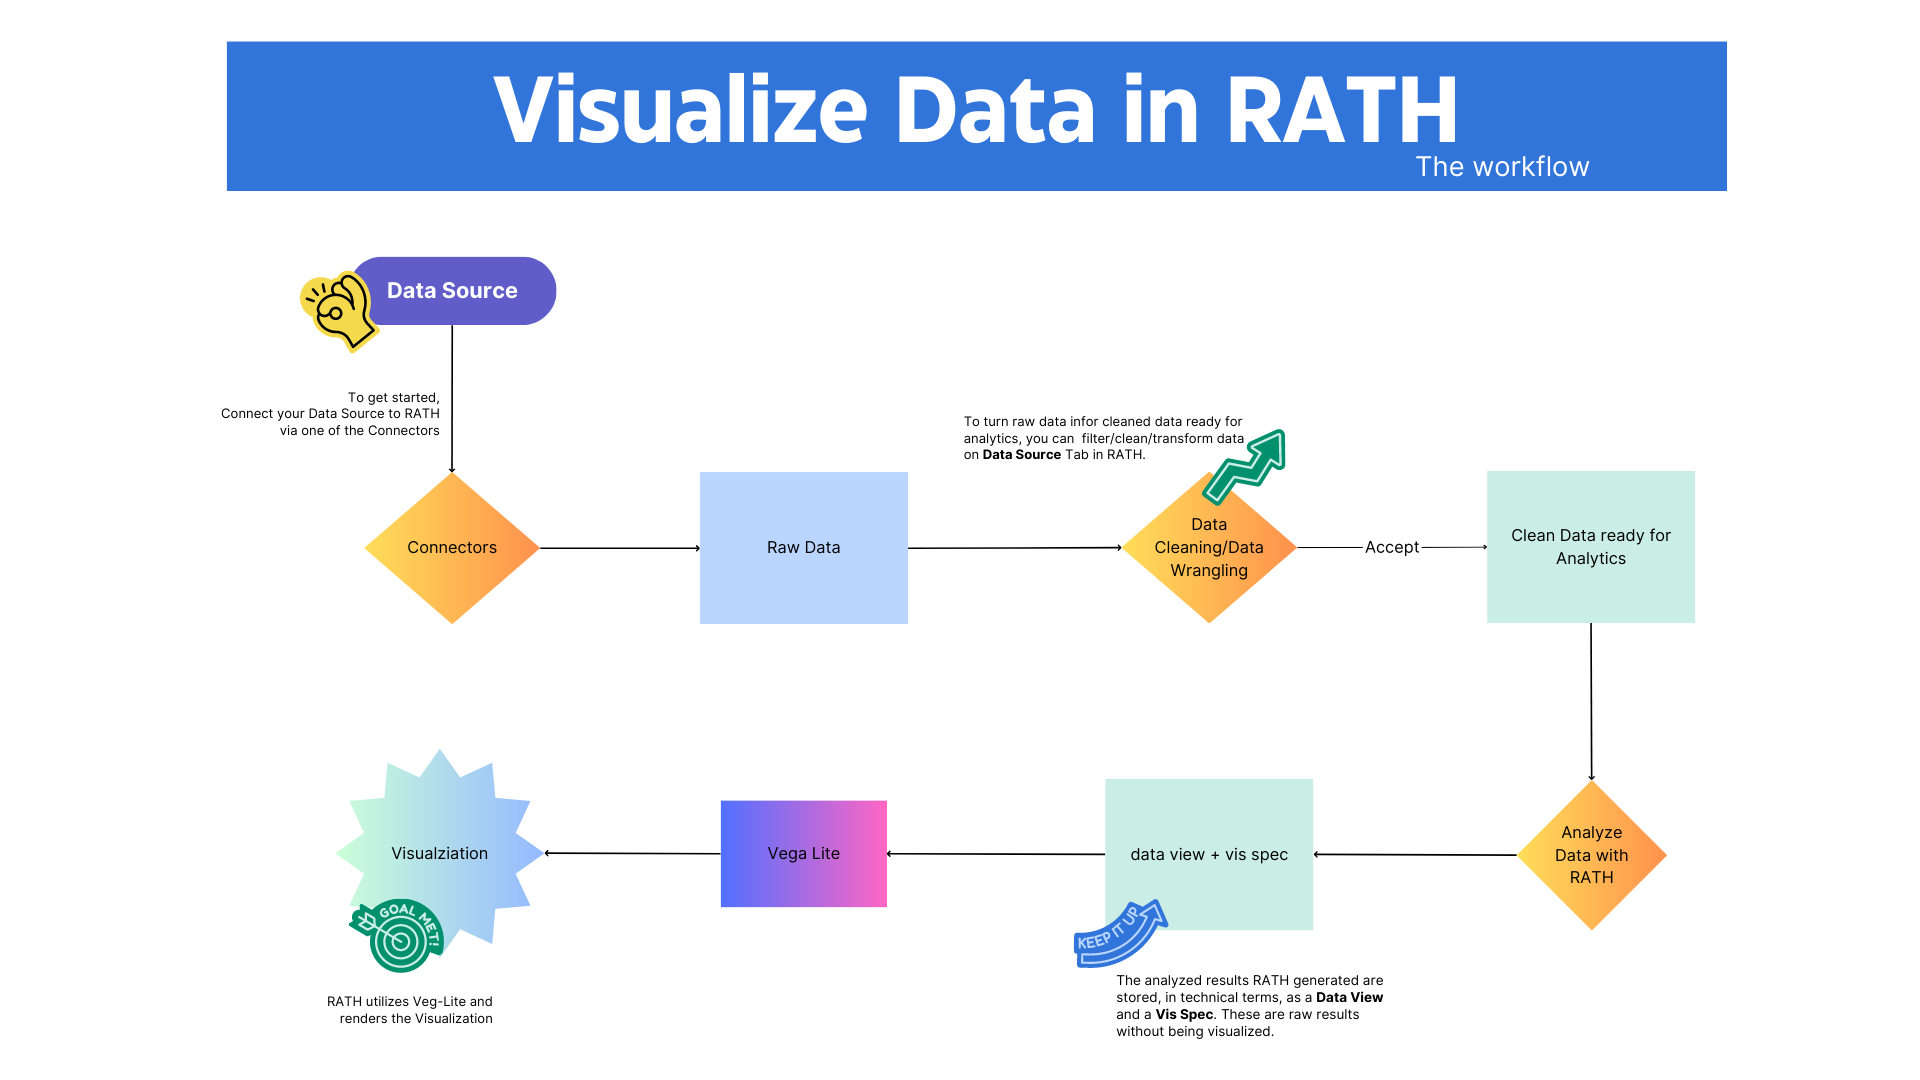
RATH utilized Vega/Vega-Lite language for Data Visualization. The following chart describes the RATH Data Visualization workflow:
Edit Vega Visualization with Vega Editor in RATH
Vega Editor is a tool for creating Vega visualizations by defining data sources, encoding, and customizing visualization properties. It provides a visual interface and a text editor for writing Vega code, allowing users to create high-quality visualizations for sharing and embedding.
In RATH, you can directly inspect the Vega/Vega-lite code for any generated visualization, and edit it with Vega-Editor. Click on the edit Chart -> Edit in Editor option to launch Vega Editor on any given data visualization.
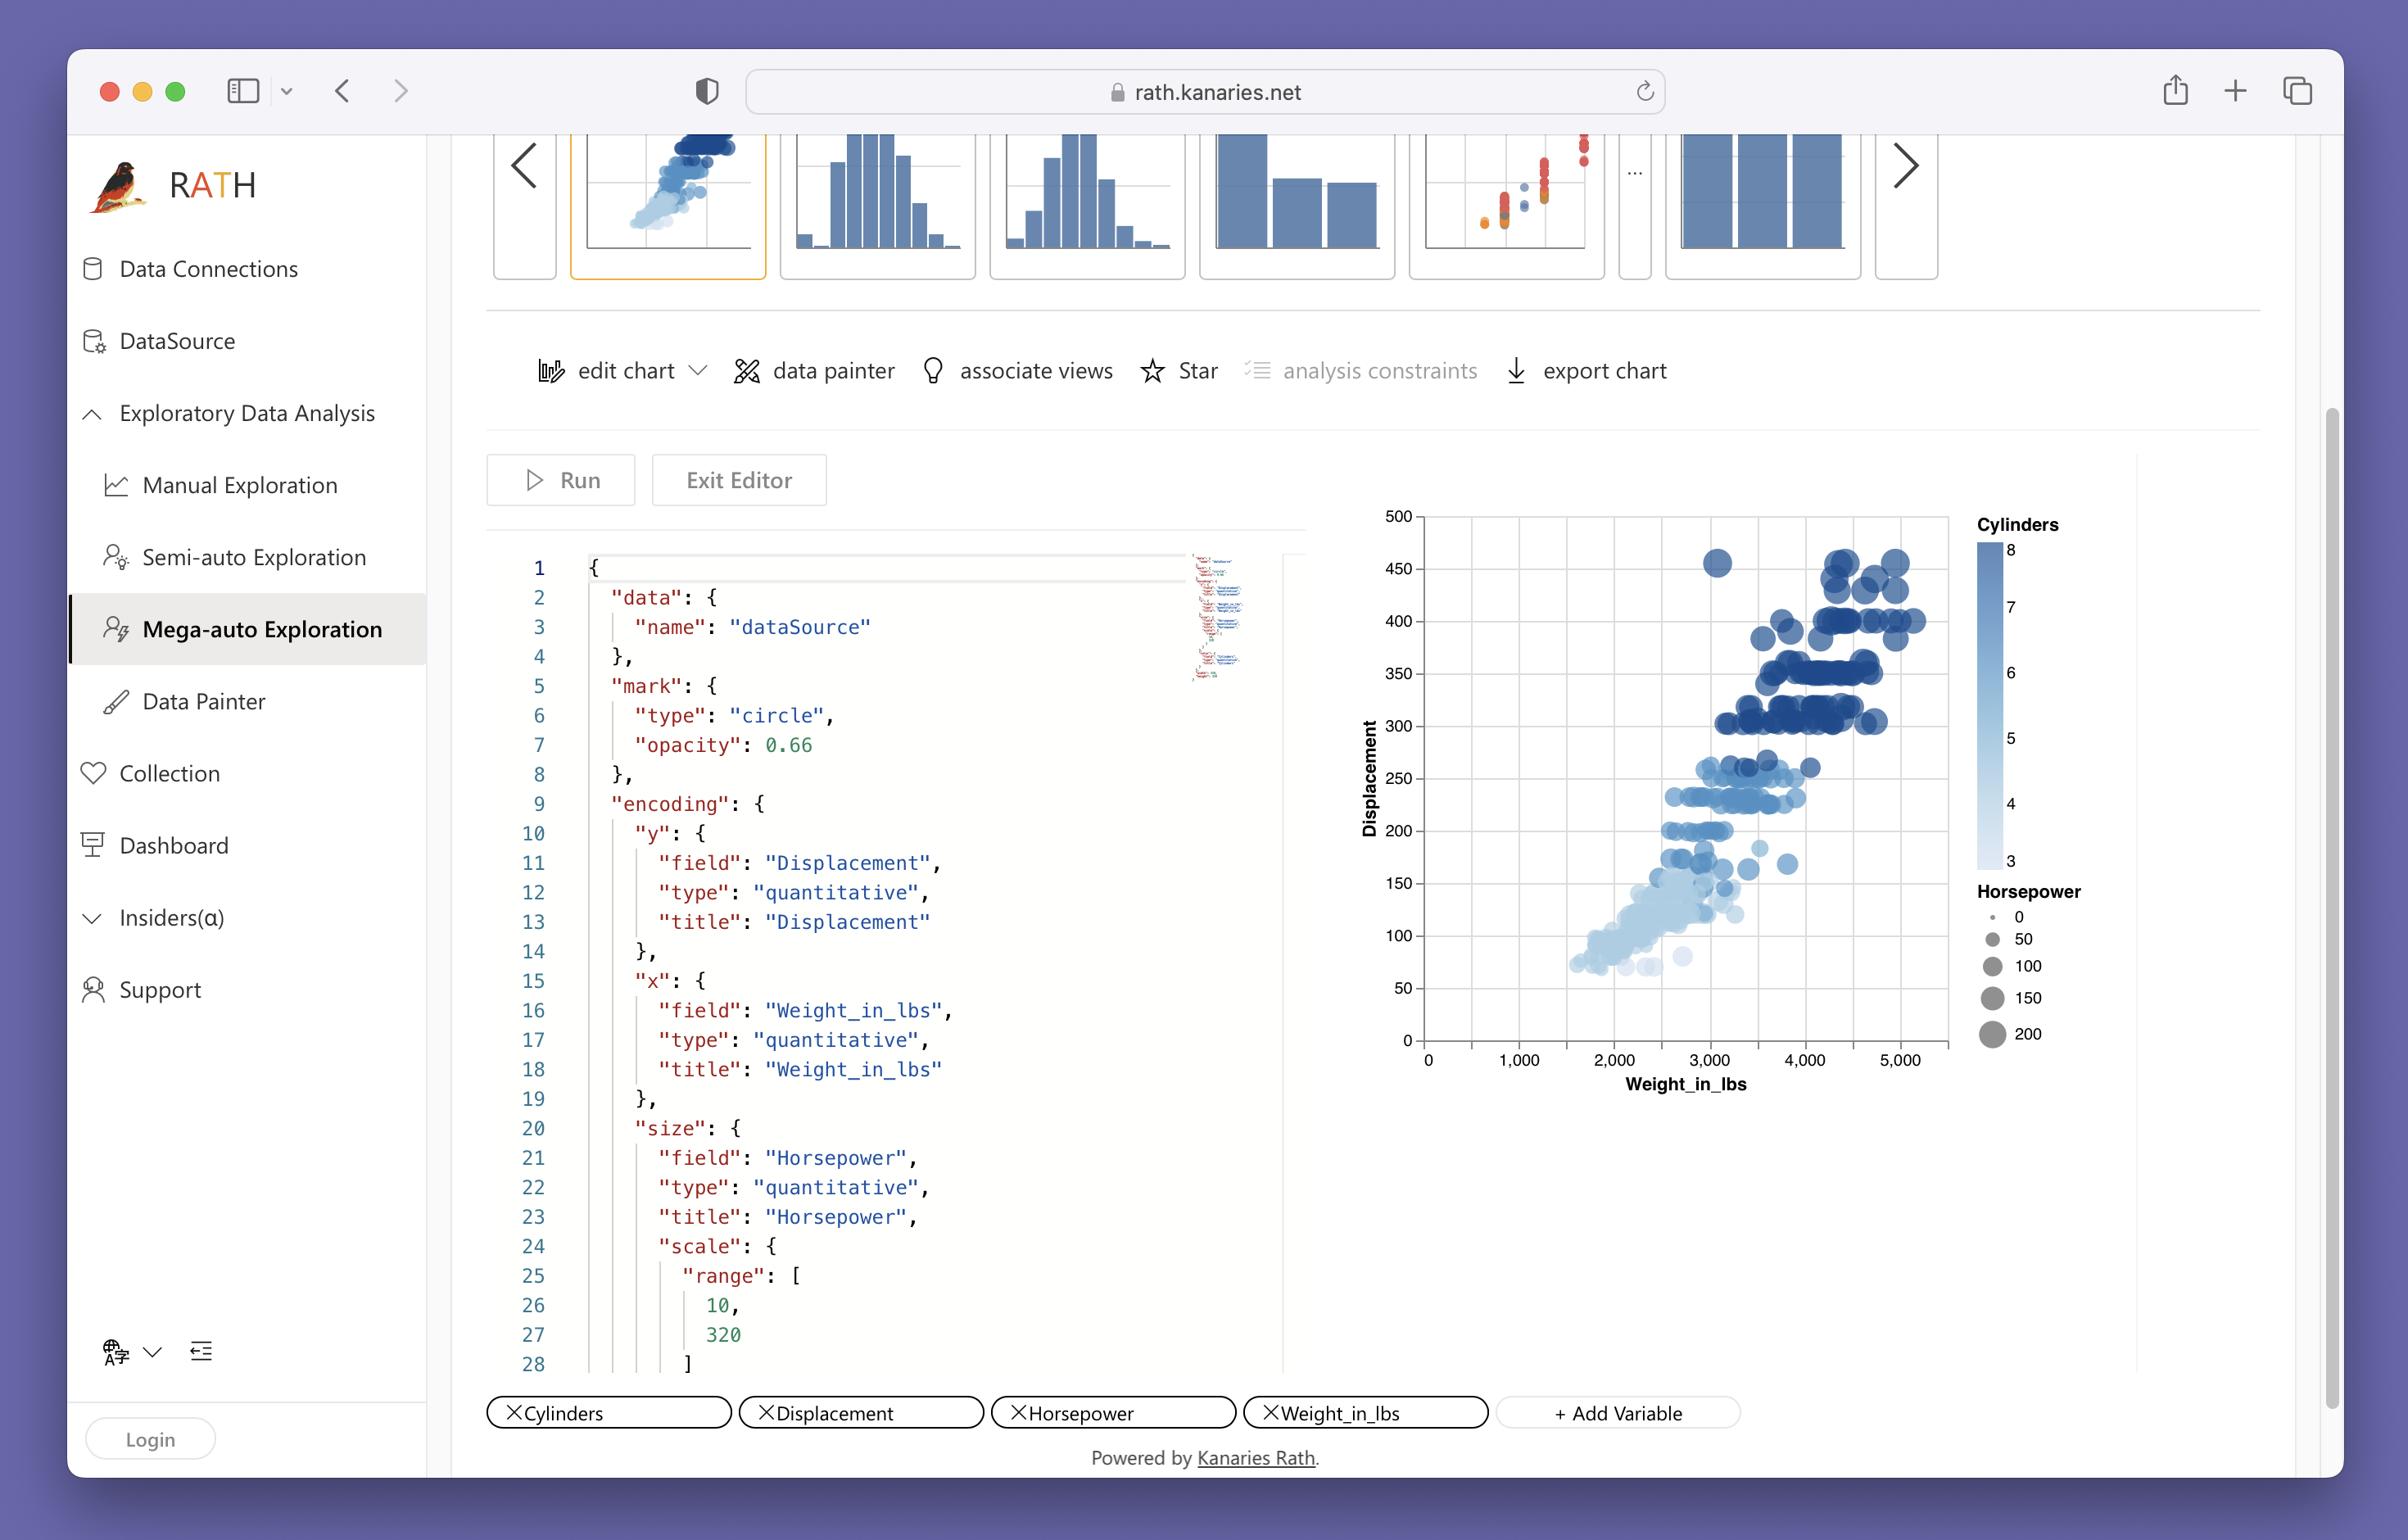
Click on the Run button to apply your code.
To abandon your changes, click on the Exit Editor button.
For more details about Vega language syntax, refer to the Vega specification documentation (opens in a new tab).