Apache Superset vs Tableau: A Comprehensive Comparison of Open Source Data Visualization Tools
- Runcell Science: An Open Source Alternative to Claude Science for Research Workflows
- How to Make Mac Not Sleep: Keep Codex, Claude Code, and AI Agents Running
- OpenClaw vs ZeroClaw vs Pi Agent vs Nanobot: Which AI Agent Stack Should You Choose in 2026?
- Can Claude Code Analyze Jupyter Notebooks for Data Science? What It Actually Does
- Claude Code Routines: Why AI Agent Cron Jobs Matter
- Claude Code Desktop Bypass Permissions: How to Enable It
- How to Build Two Python Agents with Google’s A2A Protocol - Step by Step Tutorial
- Top 10 growing data visualization libraries in Python in 2025
Introduction
Data visualization plays a crucial role in the data science workflow, enabling analysts to explore data, discover patterns, and communicate insights. Two prominent players in the field are Apache Superset and Tableau. In this article, we will explore the key differences between these tools, discuss open-source alternatives, and introduce RATH (opens in a new tab), an innovative solution for automating exploratory data analysis.
Apache Superset
Apache Superset (opens in a new tab) is an open-source data visualization tool designed to be fast, lightweight, and easy to use. It provides users with a wide range of visualization options and supports a variety of data sources.
Features
- Dashboarding: Apache Superset offers a customizable and interactive dashboard (opens in a new tab) that supports various chart types and filters.
- Demo: A live demo (opens in a new tab) is available to test drive the tool before installation.
- Training: The official Superset documentation provides tutorials (opens in a new tab) and step-by-step instructions for setting up and using the platform.
- Ease of use: Superset offers an intuitive interface for creating and editing visualizations with minimal effort.
Comparisons
- Apache Superset vs Looker: Both are open-source tools, but Superset is completely free, while Looker offers a limited free trial.
- Apache Superset vs Power BI: Power BI is a paid, proprietary tool by Microsoft, while Superset is an open-source alternative. Superset's flexibility makes it a popular choice for users who prefer customization.
Default Password and Configuration
Upon installation, Apache Superset requires you to create an admin account. There is no default password, ensuring a secure setup. For more details on how to configure and use Apache Superset, refer to their official documentation (opens in a new tab).
Tableau
Tableau (opens in a new tab) is a powerful data visualization tool used by organizations worldwide. It offers an extensive suite of features, making it popular among businesses and data professionals.
Features
- Ease of use: Tableau's drag-and-drop interface makes it simple to create complex visualizations.
- Integration: Tableau integrates with a variety of data sources, including databases, spreadsheets, and cloud services.
- Training: Tableau offers a wealth of training resources (opens in a new tab) to help users get started, including live and on-demand webinars, video tutorials, and classroom training.
Comparisons
- Tableau vs Looker: Tableau is a well-established player with a more comprehensive feature set, while Looker is a newer, cloud-based alternative.
- Tableau vs Power BI: Both tools are powerful and popular, but Tableau is often considered more user-friendly and visually appealing, while Power BI is more affordable and better integrated with other Microsoft products.
Compare ApacheSuperset, Tableau, Looker and Power BI
To better understand the differences between Apache Superset, Tableau, and their competitors, let's dive deeper into their features, strengths, and weaknesses. We will compare them across several key dimensions, such as ease of use, customization, data source compatibility, cost, and support.
Comparison Table
| Feature | Apache Superset | Tableau | Looker | Power BI |
|---|---|---|---|---|
| Ease of use | Moderate | High | High | High |
| Customization | High | High | Moderate | Moderate |
| Data source compatibility | High | High | High | High |
| Cost | Free | $$$ | $$ | $ |
| Open-source | Yes | No | No | No |
| Community support | High | High | High | High |
| Training resources | Moderate | High | High | High |
| Cloud-based option | Yes | Yes | Yes | Yes |
| On-premise option | Yes | Yes | Yes | Yes |
| Visual appeal | Moderate | High | Moderate | High |
| Collaboration features | Moderate | High | High | High |
In-Depth Comparisons
- Ease of use: Tableau is renowned for its user-friendly interface and drag-and-drop functionality, making it accessible to users with little to no experience in data visualization. Looker and Power BI also offer intuitive interfaces, but they might require a steeper learning curve for some users. Apache Superset, while still user-friendly, may require more time to get accustomed to.
- Customization: Apache Superset and Tableau excel in customization capabilities, allowing users to create highly tailored visualizations and dashboards. Looker and Power BI offer some customization options but may not provide the same level of flexibility.
- Data source compatibility: All four tools support a wide range of data sources, including databases, spreadsheets, and cloud services. This compatibility ensures that users can connect and visualize data from various sources with ease.
- Cost: Apache Superset stands out as a cost-effective option due to its open-source and free nature. Power BI offers a more affordable pricing structure compared to Tableau and Looker, making it an attractive choice for organizations on a tight budget.
- Open-source: Apache Superset is the only open-source option among the four tools, providing users with the flexibility to customize and extend the platform according to their specific needs.
- Community support: All four tools have strong community support, with active forums, blogs, and social media presence. This support ensures that users can access a wealth of resources and expertise when facing challenges or seeking advice.
- Training resources: Tableau, Looker, and Power BI offer extensive training resources, such as webinars, video tutorials, and classroom training. Apache Superset provides moderate training resources through its official documentation and community-driven content.
- Cloud-based and on-premise options: All four tools offer both cloud-based and on-premise deployment options, catering to organizations with different infrastructure preferences.
- Visual appeal: Tableau is known for its visually stunning visualizations, while Power BI also offers a high degree of visual appeal. Apache Superset and Looker provide functional and effective visualizations, but they may not be as polished or aesthetically pleasing as those created in Tableau or Power BI.
- Collaboration features: Tableau, Looker, and Power BI all offer robust collaboration features, enabling users to share and collaborate
Open-Source Alternatives
In addition to Apache Superset, there are several other open-source alternatives to Tableau, each with its unique features and capabilities. Here's a more detailed look at some of the most popular options:
- Metabase (opens in a new tab)
 (opens in a new tab)
Metabase is a user-friendly data visualization tool that allows non-technical users to create and share custom dashboards and reports. Its intuitive interface and powerful query builder make it easy for users to explore their data and gain insights without writing code. Metabase also supports a wide range of data sources and offers a rich library of visualization types to help users tell compelling stories with their data.
(opens in a new tab)
Metabase is a user-friendly data visualization tool that allows non-technical users to create and share custom dashboards and reports. Its intuitive interface and powerful query builder make it easy for users to explore their data and gain insights without writing code. Metabase also supports a wide range of data sources and offers a rich library of visualization types to help users tell compelling stories with their data. - Redash (opens in a new tab)
 (opens in a new tab)
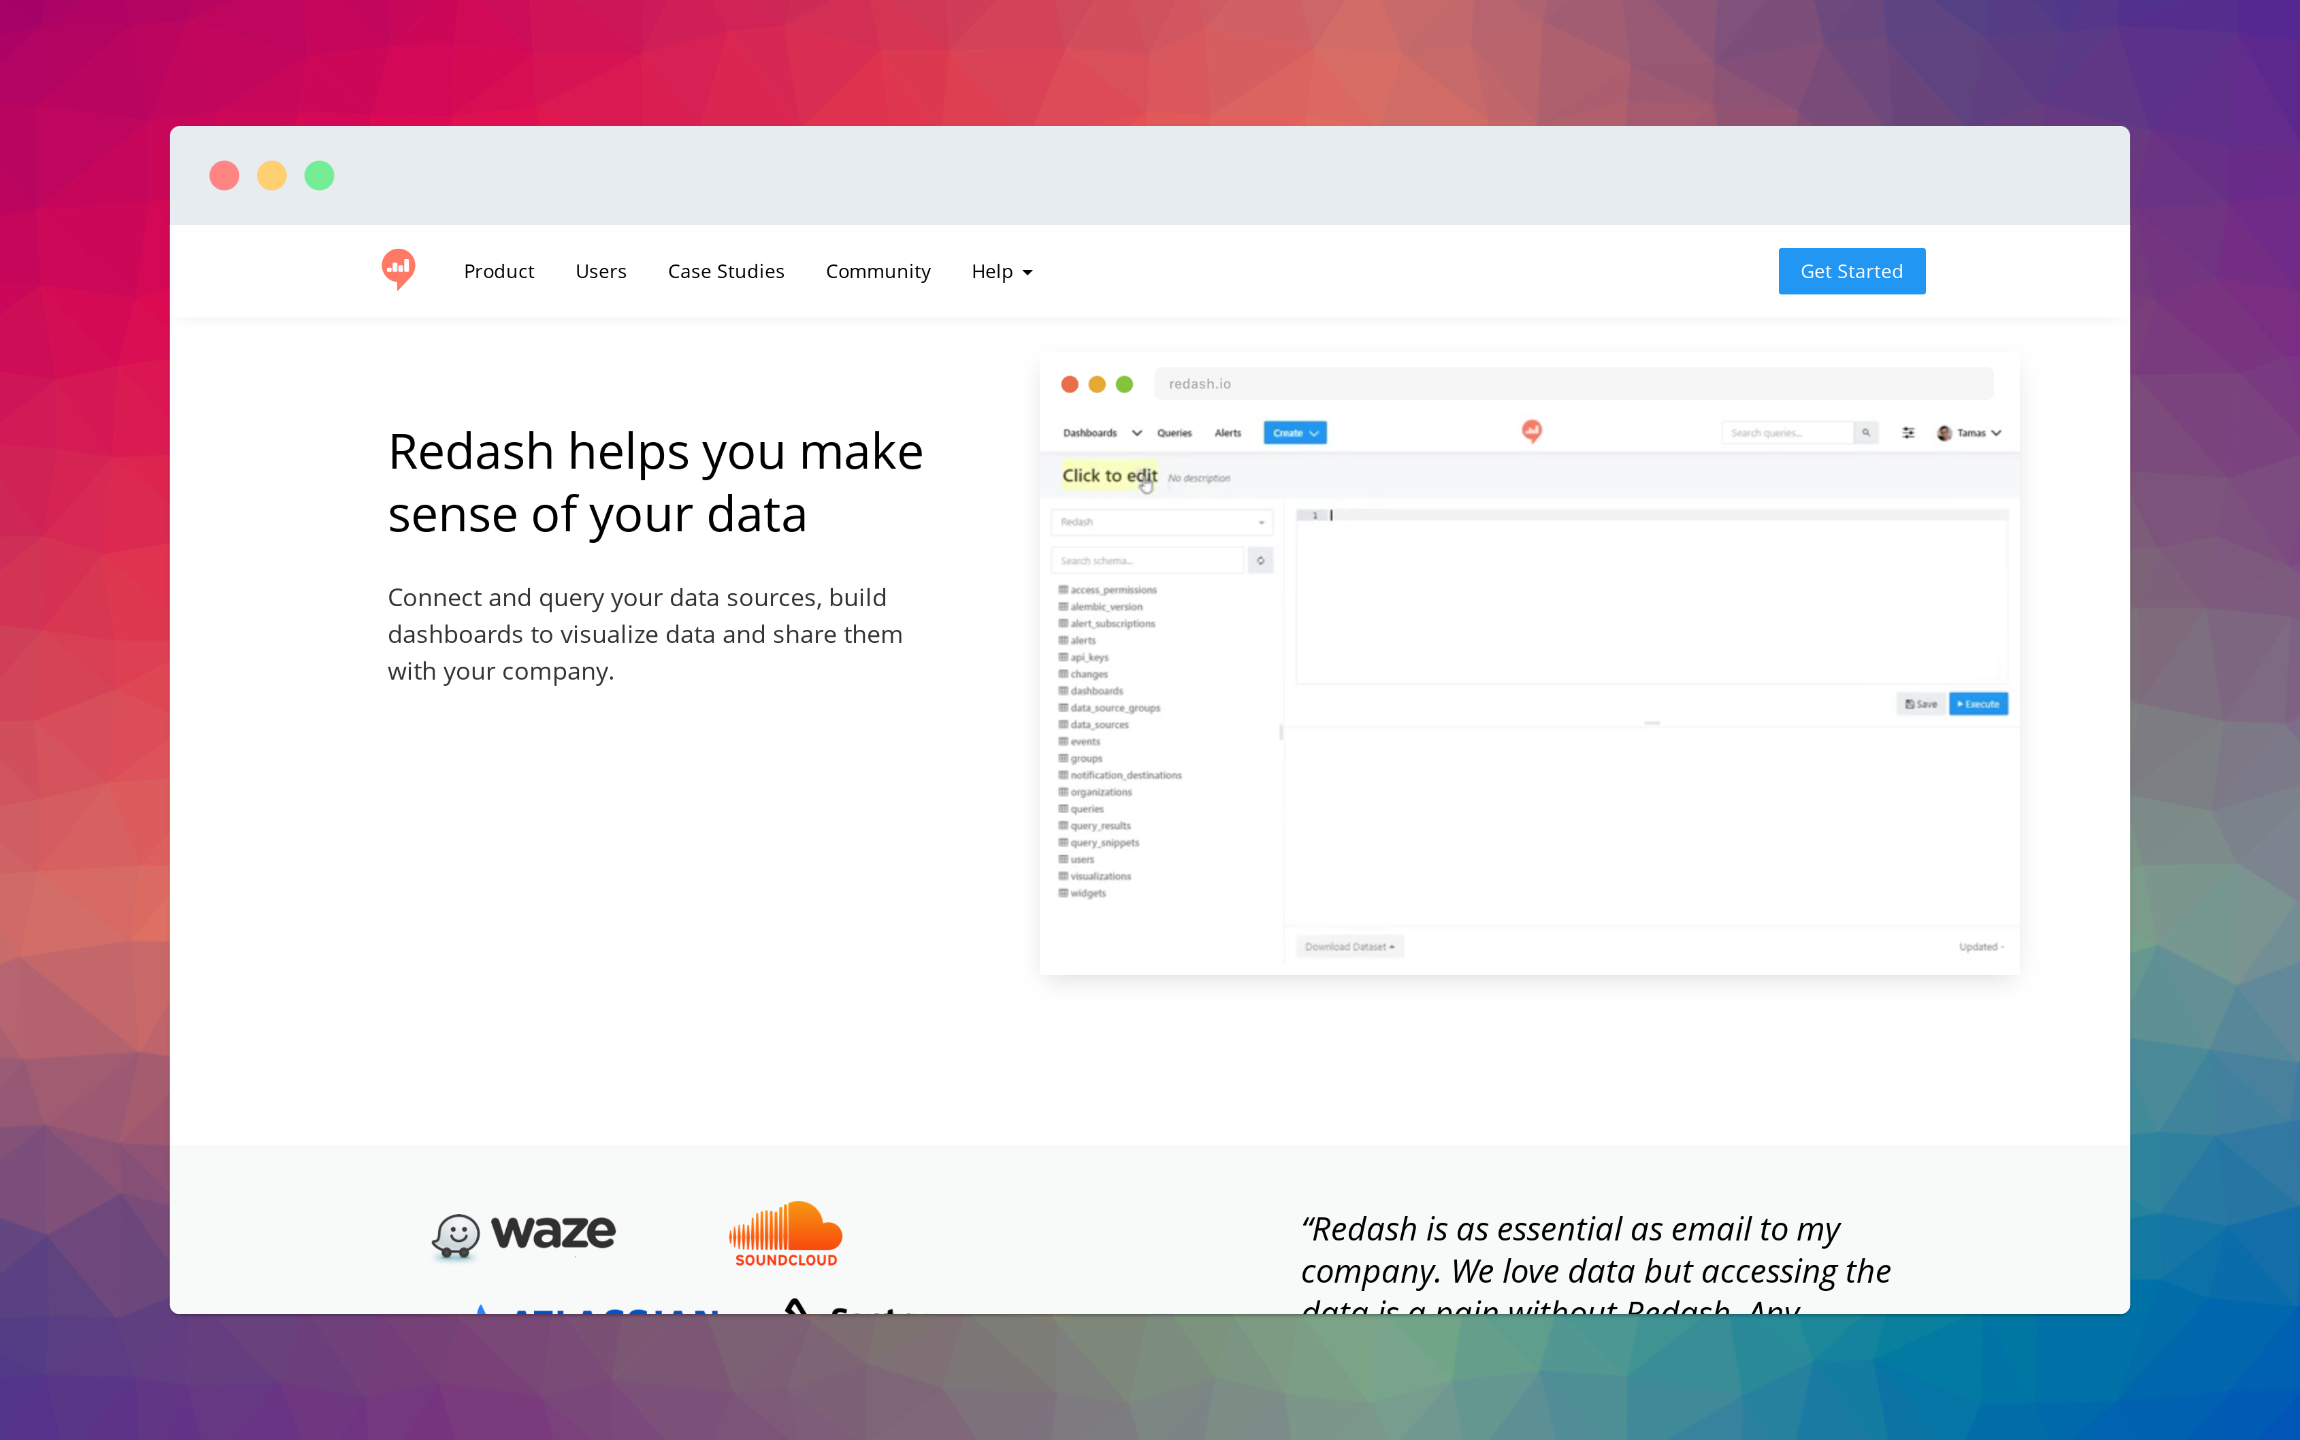
Redash is an open-source data visualization and collaboration platform designed for data-driven teams. It supports a wide variety of data sources and allows users to query their data using SQL, visualize the results using customizable charts, and share their findings with others through interactive dashboards. Redash's features include an advanced query editor, customizable visualizations, and robust integrations with popular data sources and tools.
(opens in a new tab)
Redash is an open-source data visualization and collaboration platform designed for data-driven teams. It supports a wide variety of data sources and allows users to query their data using SQL, visualize the results using customizable charts, and share their findings with others through interactive dashboards. Redash's features include an advanced query editor, customizable visualizations, and robust integrations with popular data sources and tools. - Grafana (opens in a new tab)
 (opens in a new tab)
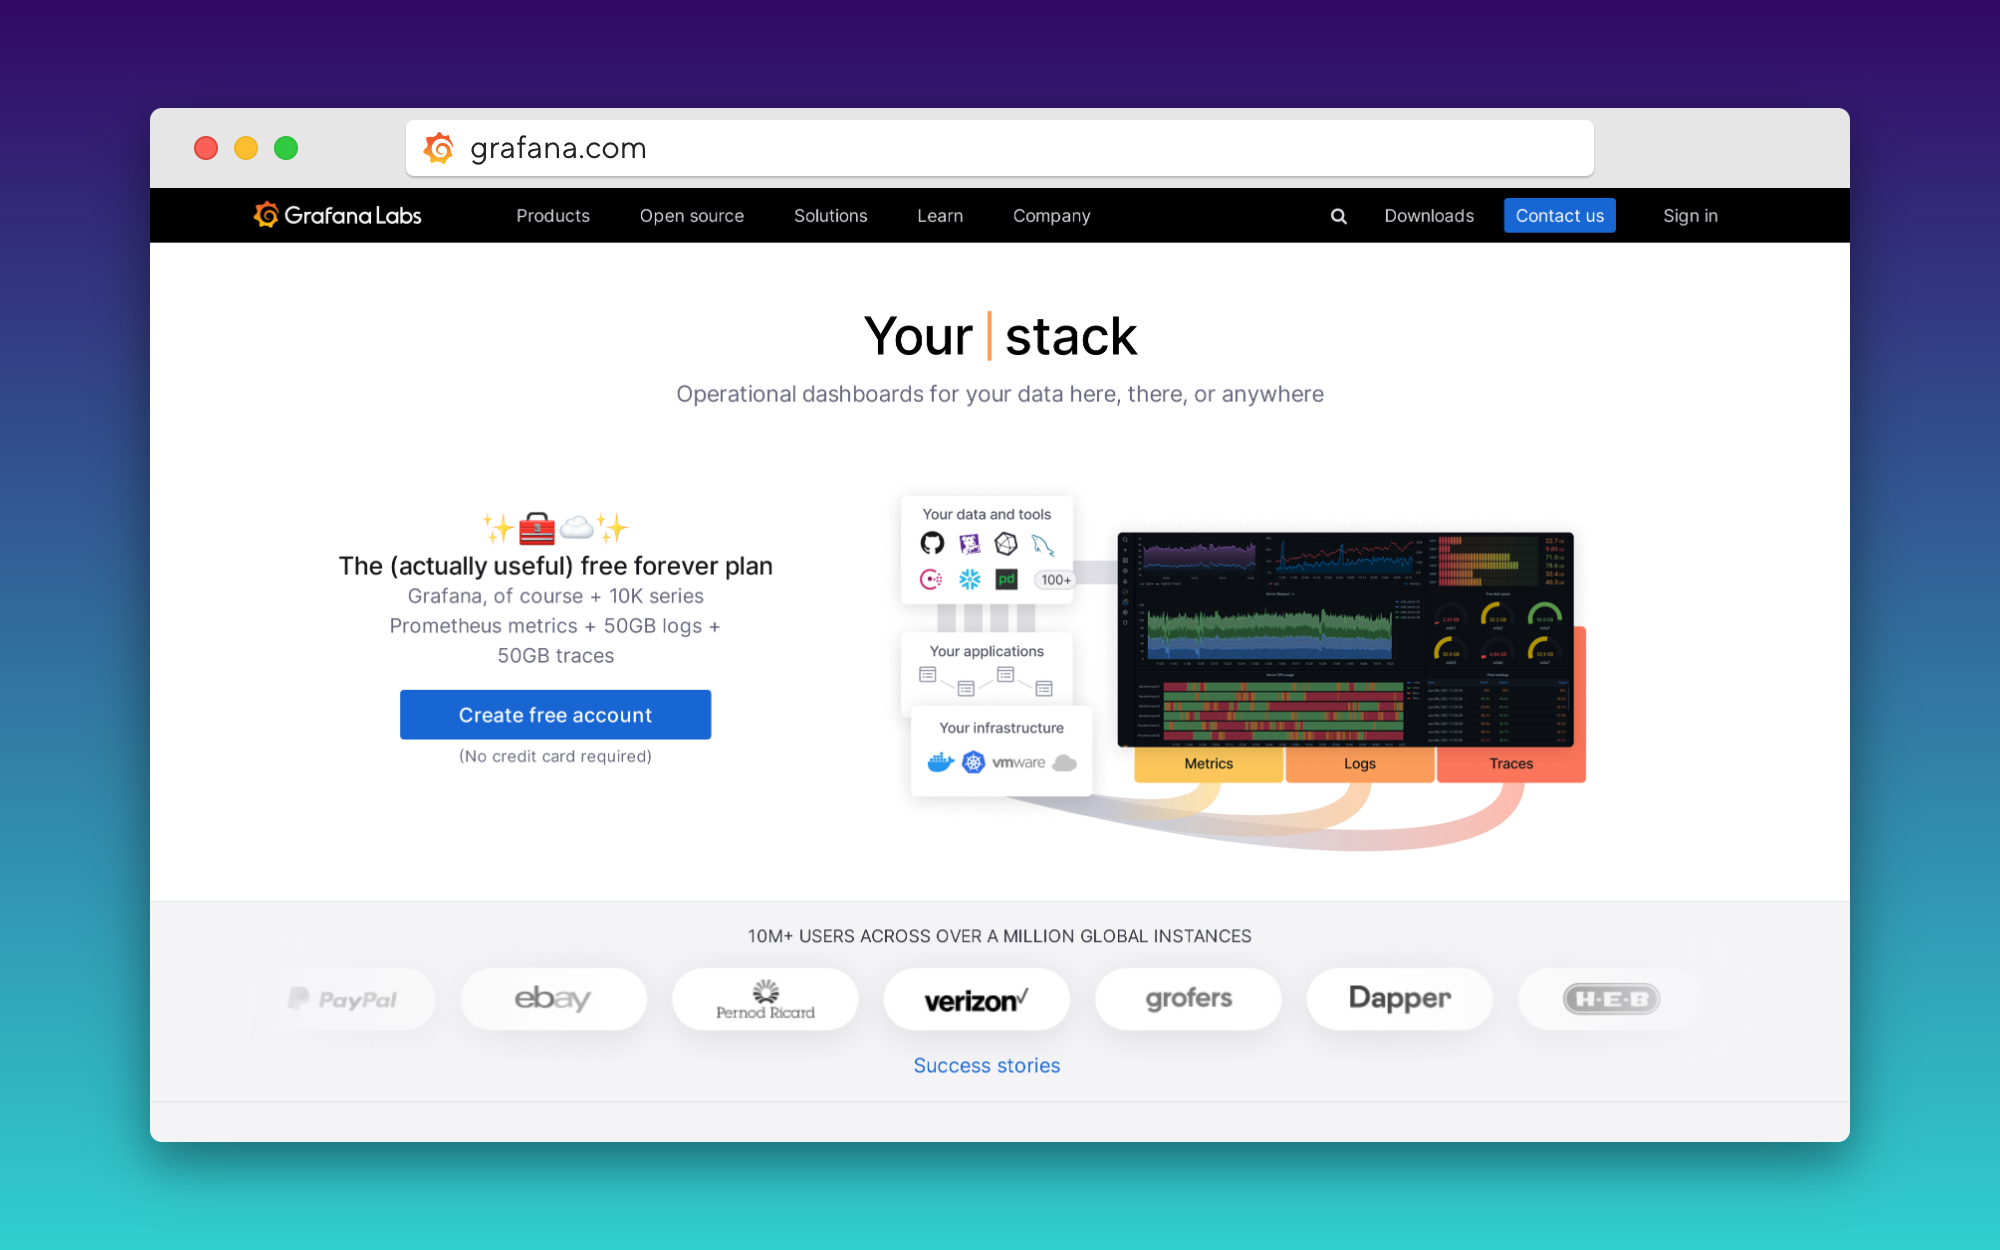
Grafana is a popular open-source platform for monitoring and observability, offering a wide range of data visualization options, including time-series charts, heatmaps, and histograms. Primarily used for monitoring and alerting purposes, Grafana excels at displaying large volumes of time-series data from various sources, such as Graphite, InfluxDB, and Prometheus. With its flexible plugin architecture and growing community, Grafana allows users to extend its capabilities and tailor it to their specific needs.
(opens in a new tab)
Grafana is a popular open-source platform for monitoring and observability, offering a wide range of data visualization options, including time-series charts, heatmaps, and histograms. Primarily used for monitoring and alerting purposes, Grafana excels at displaying large volumes of time-series data from various sources, such as Graphite, InfluxDB, and Prometheus. With its flexible plugin architecture and growing community, Grafana allows users to extend its capabilities and tailor it to their specific needs. - Plotly Dash (opens in a new tab)
 (opens in a new tab)
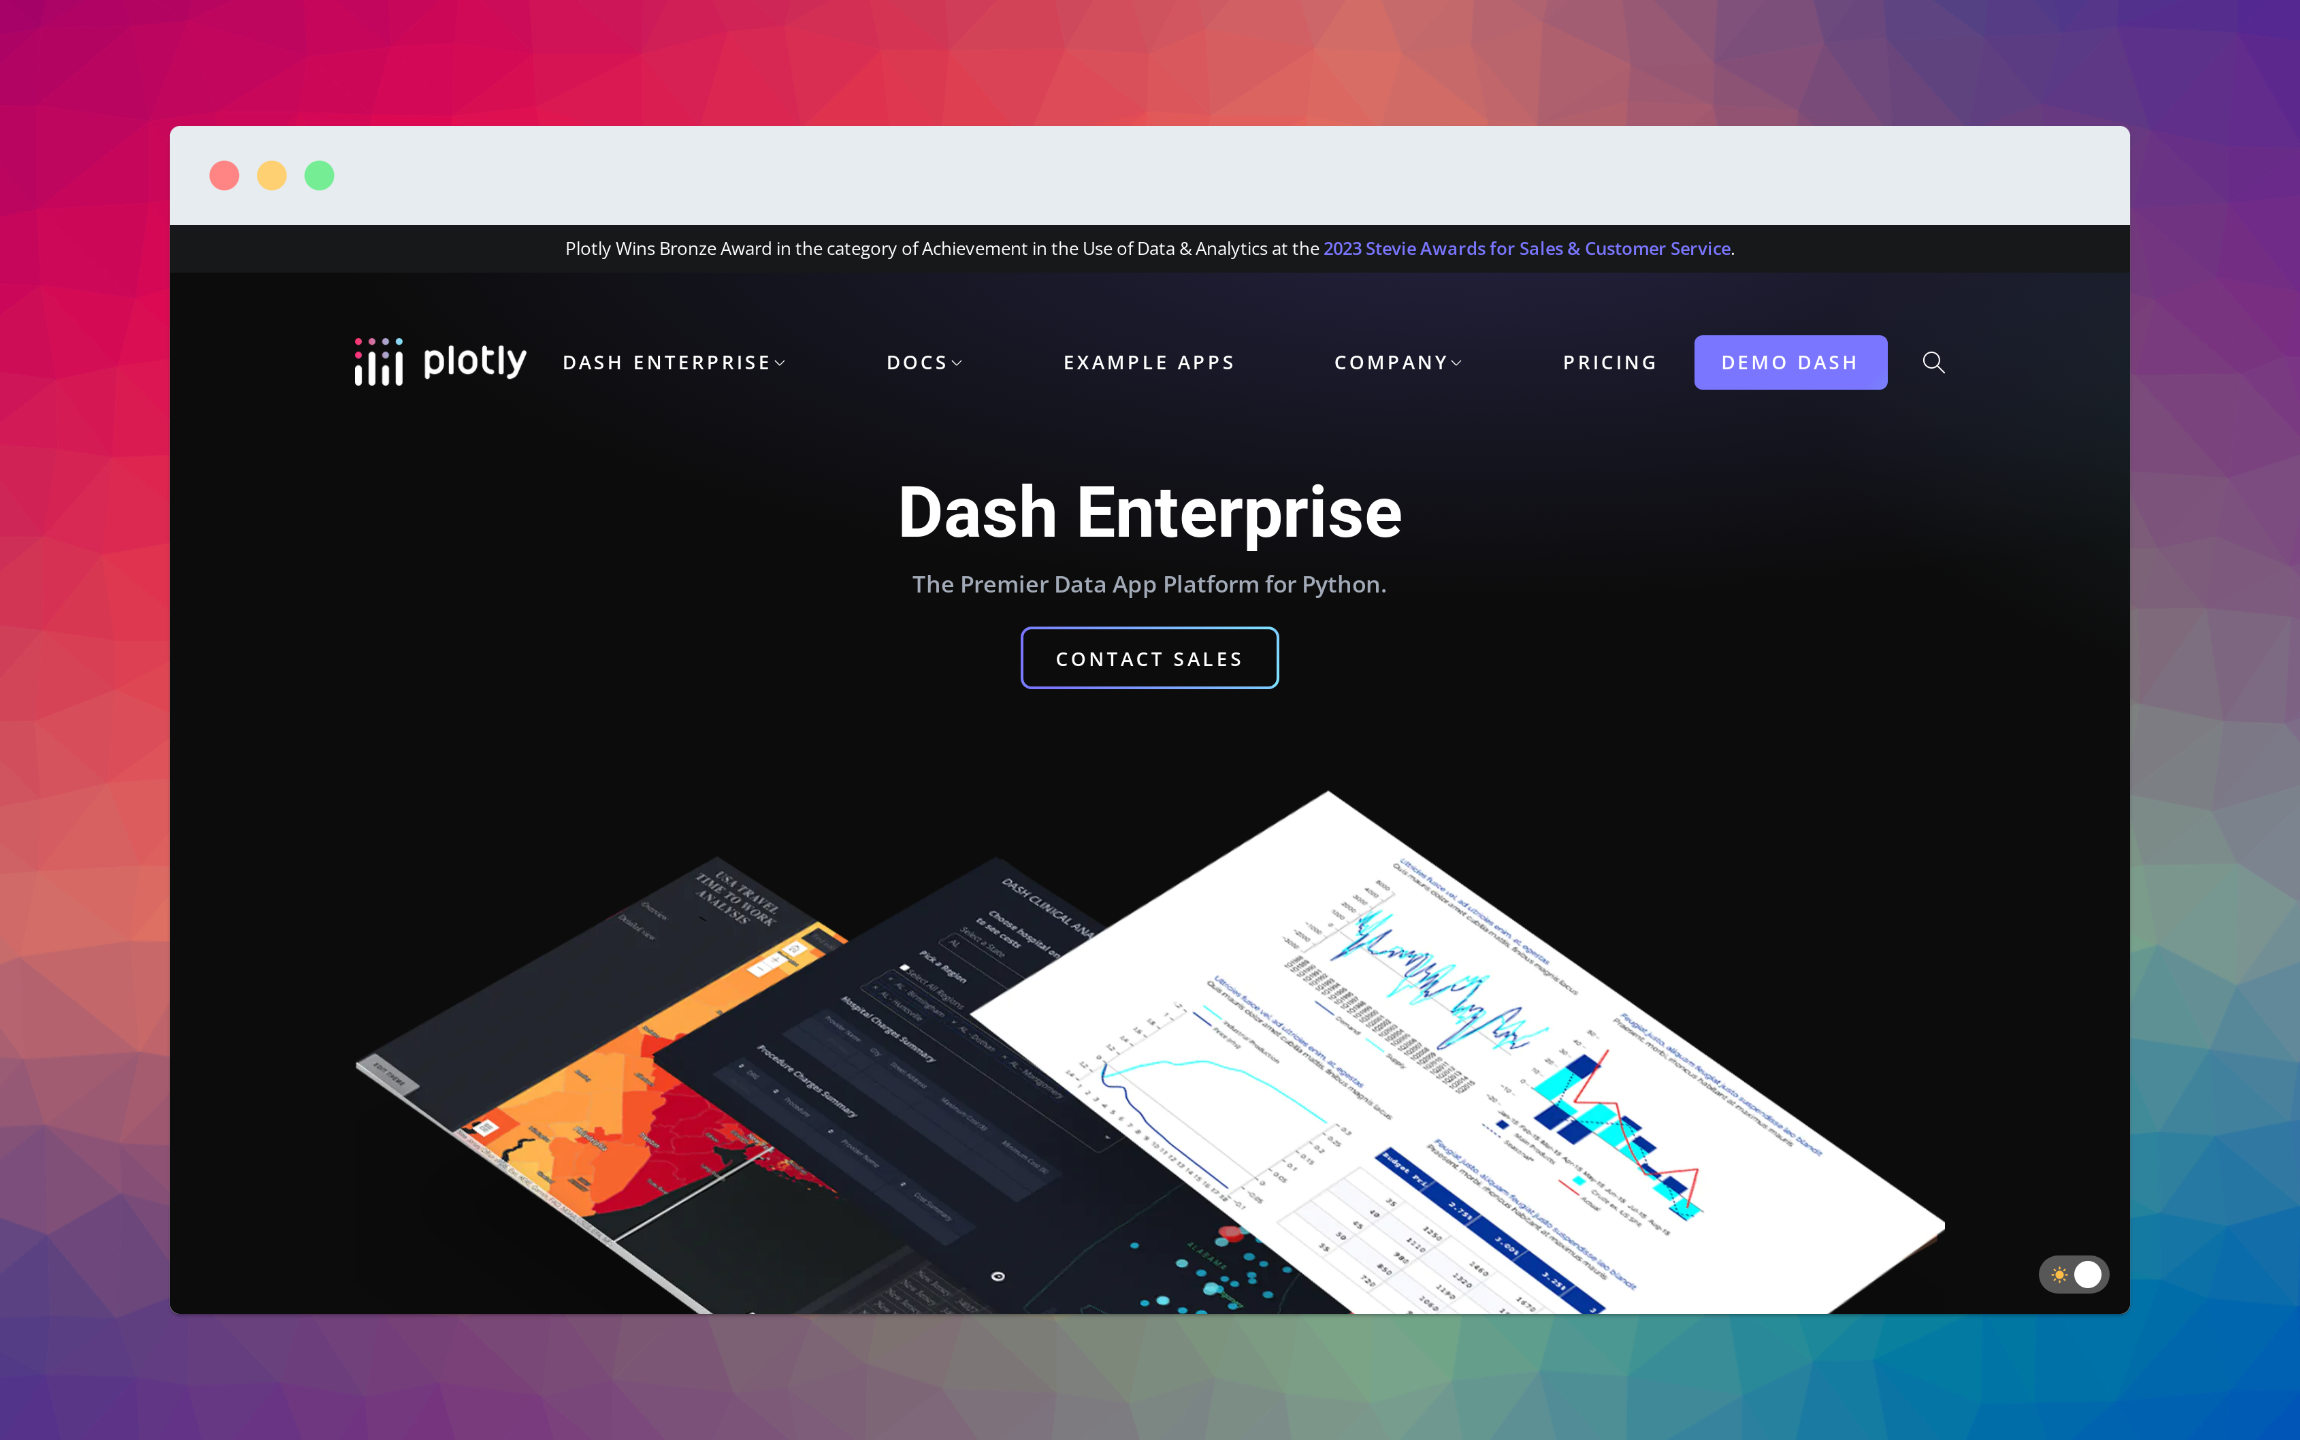
Plotly Dash is an open-source framework for building analytical web applications, created by Plotly. It enables users to create custom interactive data visualizations using Python, without requiring any JavaScript knowledge. Dash combines the power of Plotly.js, React, and Flask, providing users with a flexible and extensible platform for creating visually appealing, data-driven applications.
(opens in a new tab)
Plotly Dash is an open-source framework for building analytical web applications, created by Plotly. It enables users to create custom interactive data visualizations using Python, without requiring any JavaScript knowledge. Dash combines the power of Plotly.js, React, and Flask, providing users with a flexible and extensible platform for creating visually appealing, data-driven applications.
These alternatives offer similar data visualization capabilities to Apache Superset and Tableau and can be customized to meet your specific needs. It's worth exploring each option to determine which best suits your requirements and aligns with your organization's goals. Don't forget to consider the innovative RATH (opens in a new tab) as an alternative, with its powerful AI-driven Copilot feature that streamlines data analysis and visualization tasks.
Use AI to Automate Your Data Analytics and Data Visualization
For all the options, there is one point that all these products fall short: Using the latest AI technology to Automate the Data Analytics/Data Visualization process. That’s where another candidate comes in:
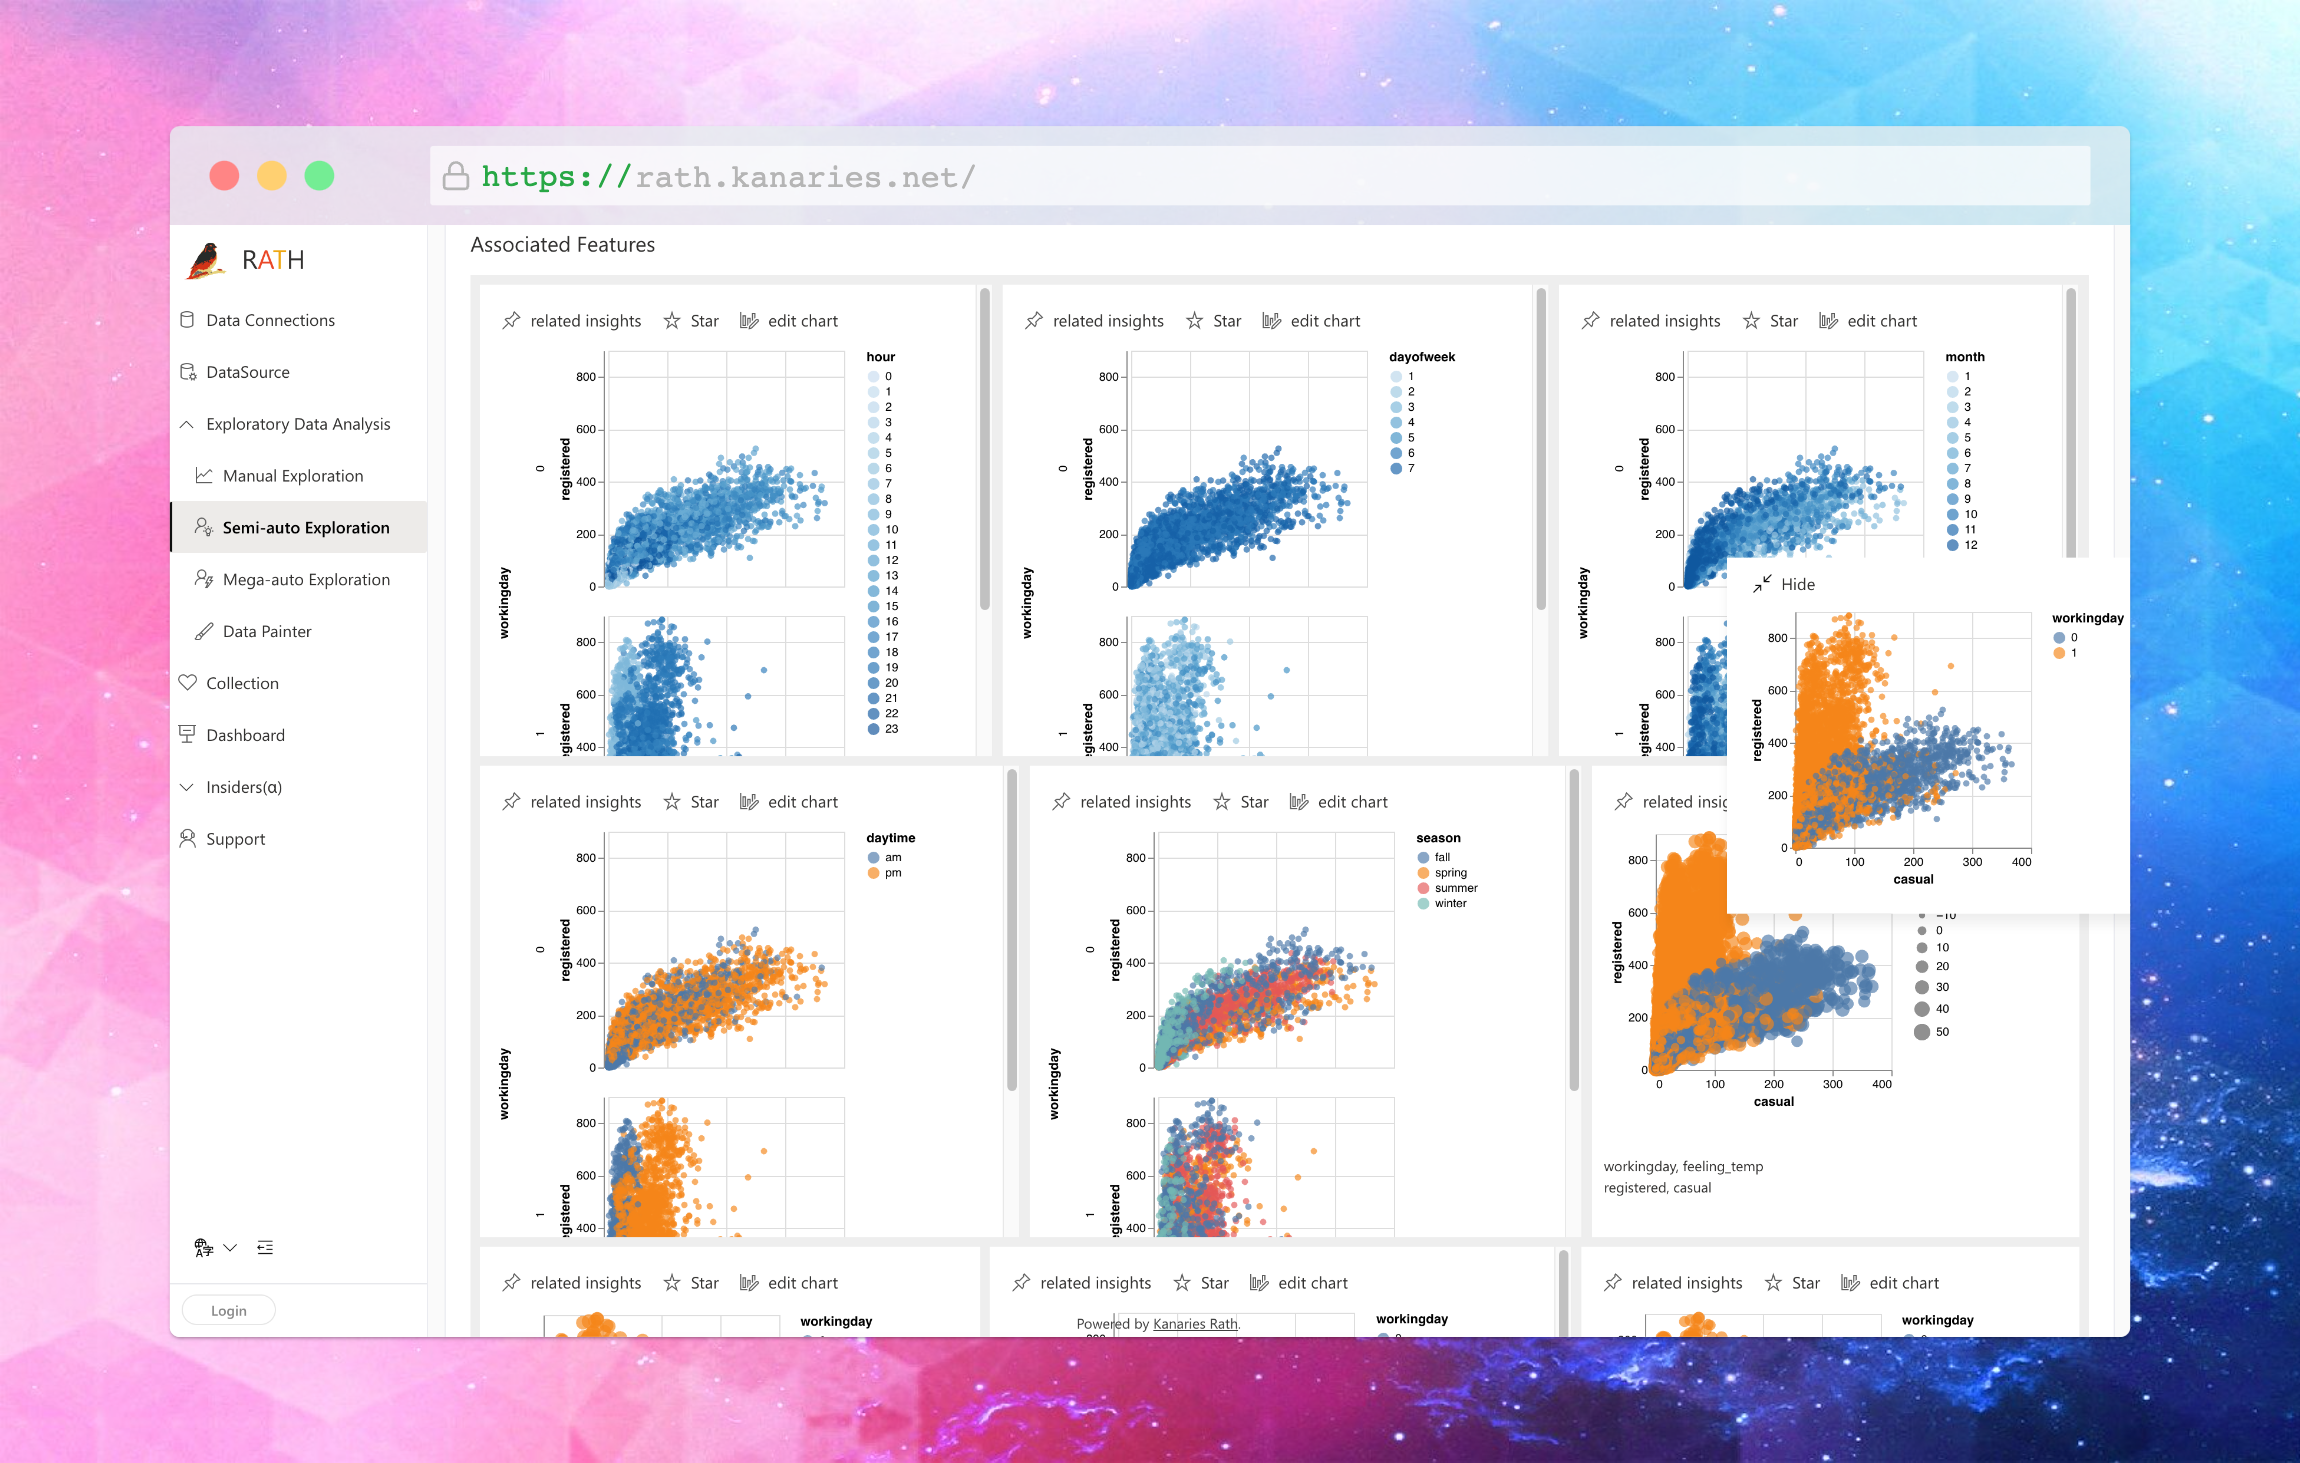
RATH (opens in a new tab) is an innovative solution that goes beyond traditional data analysis and visualization tools by integrating an AI-driven Copilot feature. This feature is designed to streamline the data analysis process, improve decision-making, and unlock hidden insights. The RATH Copilot can revolutionize the way data professionals approach their work.
How RATH Copilot Works
The RATH Copilot is an AI-powered virtual assistant that guides users through each step of the data analysis process. It uses advanced algorithms to analyze your data, uncover patterns and relationships, and recommend the most suitable visualizations. RATH Copilot can even create visualizations automatically based on your data, allowing you to focus on interpreting the results and making informed decisions.
Key Benefits of RATH Copilot
- Saves Time: RATH Copilot automates time-consuming tasks such as data cleaning, data transformation, and visualization creation. By minimizing manual work, data analysts can focus on higher-level tasks and deliver insights faster.
- Uncovers Hidden Insights: The AI-driven Copilot can identify patterns and relationships that might be easily overlooked during manual analysis. By highlighting these insights, RATH Copilot helps users make more informed decisions.
- Personalized Guidance: RATH Copilot adapts to the user's specific needs and preferences, providing personalized suggestions and recommendations. This tailored approach ensures that the user receives the most relevant insights for their unique situation.
- Enhanced Collaboration: RATH Copilot enables users to share insights and visualizations with their team members, facilitating collaboration and promoting data-driven decision-making across the organization.
- Ease of Use: The intuitive nature of RATH Copilot makes it accessible to users with varying levels of experience. Its user-friendly interface and guided approach simplify the data analysis process, making it easier for newcomers to get started while also benefiting experienced analysts.
- Continuous Learning: RATH Copilot is designed to learn from user feedback and improve its recommendations over time. This continuous learning process ensures that the Copilot becomes even more effective at identifying relevant insights and patterns as users continue to interact with it.
- Innovative Tools: Explore more about RATH's innovative features like Data Painter, Causal Analysis, and What-if Analysis.
Real-World Applications
The RATH Copilot can be applied across various industries and use cases, such as:
- Marketing teams can use RATH Copilot to analyze campaign performance, customer behavior, and sales data, optimizing their strategies to drive revenue growth.
- Finance professionals can leverage RATH Copilot to analyze financial data, identify trends, and make data-driven decisions to improve their organization's financial performance.
- Healthcare organizations can use RATH Copilot to analyze patient data, identify patterns, and uncover insights to improve patient outcomes and optimize resource allocation.
Open Source Community
RATH embraces the power of Open Source and empowers data professionals to work more efficiently and make better-informed decisions, ultimately driving success in their organizations. Join the open-source community on GitHub (opens in a new tab) and the Discord Community (opens in a new tab) to get involved and stay up to date with the latest developments.

FAQ
Q: Is Apache Superset a good alternative to Tableau? A: Yes, Apache Superset is a powerful open-source alternative to Tableau that provides similar data visualization and exploration capabilities. It supports a wide range of data sources and offers a variety of visualization options, making it suitable for diverse use cases.
Q: What are the main advantages of using Apache Superset? A: Apache Superset offers several advantages, including being open-source, highly customizable, and supporting a wide range of data sources. It also boasts a strong user community and regular updates from its developers, ensuring continuous improvement and feature enhancements.
Q: What are some drawbacks of Apache Superset? A: Some potential drawbacks of Apache Superset include a steeper learning curve compared to other visualization tools, less polished user interface, and the need for technical expertise to customize and manage the platform.
Q: How easy is it to learn and use Apache Superset? A: While Apache Superset offers powerful capabilities, it may require some time and effort to learn and become proficient in its use. Users with a background in SQL and data visualization tools will find it easier to adopt. However, there are numerous resources and tutorials available to help users get started.
Q: What programming languages and technologies are used in Apache Superset? A: Apache Superset is primarily written in Python, with JavaScript being used for the front end. It also leverages other technologies such as Flask, a Python web framework, and React, a JavaScript library for building user interfaces.
Q: What are some popular open-source alternatives to Apache Superset and Tableau? A: Some popular open-source alternatives to Apache Superset and Tableau include Metabase, Redash, Grafana, and Plotly Dash. Each of these tools offers unique features and capabilities, making it essential to evaluate and choose the best option based on your specific requirements.
Conclusion
When comparing Apache Superset vs Tableau, it's essential to consider your specific needs and budget. Apache Superset is an excellent open-source alternative to Tableau for users who require customization and flexibility. However, Tableau offers a more comprehensive feature set and is often considered more user-friendly.
In addition to these options, RATH provides a unique solution for automating exploratory data analysis, making it an attractive choice for users who seek to streamline their data analysis workflow. By exploring the features and capabilities of each tool, you can make an informed decision about the best data visualization solution for your needs.