Solving the "import matplotlib.pyplot as plt" Error: A Comprehensive Guide
- Name
- Nikki Lopez
Updated on
When working with data visualization in Python, you might encounter an error while trying to import the matplotlib.pyplot library using the standard import matplotlib.pyplot as plt command. This article aims to address the most common reasons for this error, guiding you through the process of troubleshooting and rectifying the issue. We'll explore the following topics:
- Ensuring correct installation of Matplotlib
- Confirming the right Python environment
- Checking for name conflicts
- Updating the Matplotlib library
- Exploring alternative solutions
- Runcell Science: An Open Source Alternative to Claude Science for Research Workflows
- How to Make Mac Not Sleep: Keep Codex, Claude Code, and AI Agents Running
- OpenClaw vs ZeroClaw vs Pi Agent vs Nanobot: Which AI Agent Stack Should You Choose in 2026?
- Can Claude Code Analyze Jupyter Notebooks for Data Science? What It Actually Does
- Claude Code Routines: Why AI Agent Cron Jobs Matter
- Claude Code Desktop Bypass Permissions: How to Enable It
- How to Build Two Python Agents with Google’s A2A Protocol - Step by Step Tutorial
- Top 10 growing data visualization libraries in Python in 2025
Ensure Correct Installation of Matplotlib
Before diving into the more intricate reasons for the "import matplotlib.pyplot as plt" error, it is crucial to confirm that Matplotlib is correctly installed in your Python environment. To verify the installation, you can use the following command in your terminal or command prompt:
pip install matplotlibIf you're using a conda environment, use this command instead:
conda install matplotlibConfirm the Right Python Environment
When working with multiple Python environments, it's easy to inadvertently use a different environment than intended. This can lead to the "import matplotlib.pyplot as plt" error if Matplotlib is not installed in the active environment. To resolve this, follow these steps:
- Check the current Python environment by running the command:
python --version- If you're using virtual environments, ensure you've activated the correct environment where Matplotlib is installed:
source activate your_environment_nameor for Windows users:
activate your_environment_nameCheck for Name Conflicts
Another common reason for the "import matplotlib.pyplot as plt" error is naming conflicts. If you've named your script file matplotlib.py or pyplot.py, it can interfere with the proper functioning of the library. To fix this issue, rename your script file and remove any generated __pycache__ folder or .pyc files before running your script again.
Update the Matplotlib Library
In some cases, the "import matplotlib.pyplot as plt" error can result from using an outdated version of the Matplotlib library. To update the library, you can use the following command:
pip install --upgrade matplotlibFor conda users, use this command:
conda update matplotlibExplore Alternative Solutions
If the above solutions don't resolve the error, consider trying the following:
Visualize Your Pandas Dataframe with PyGWalker
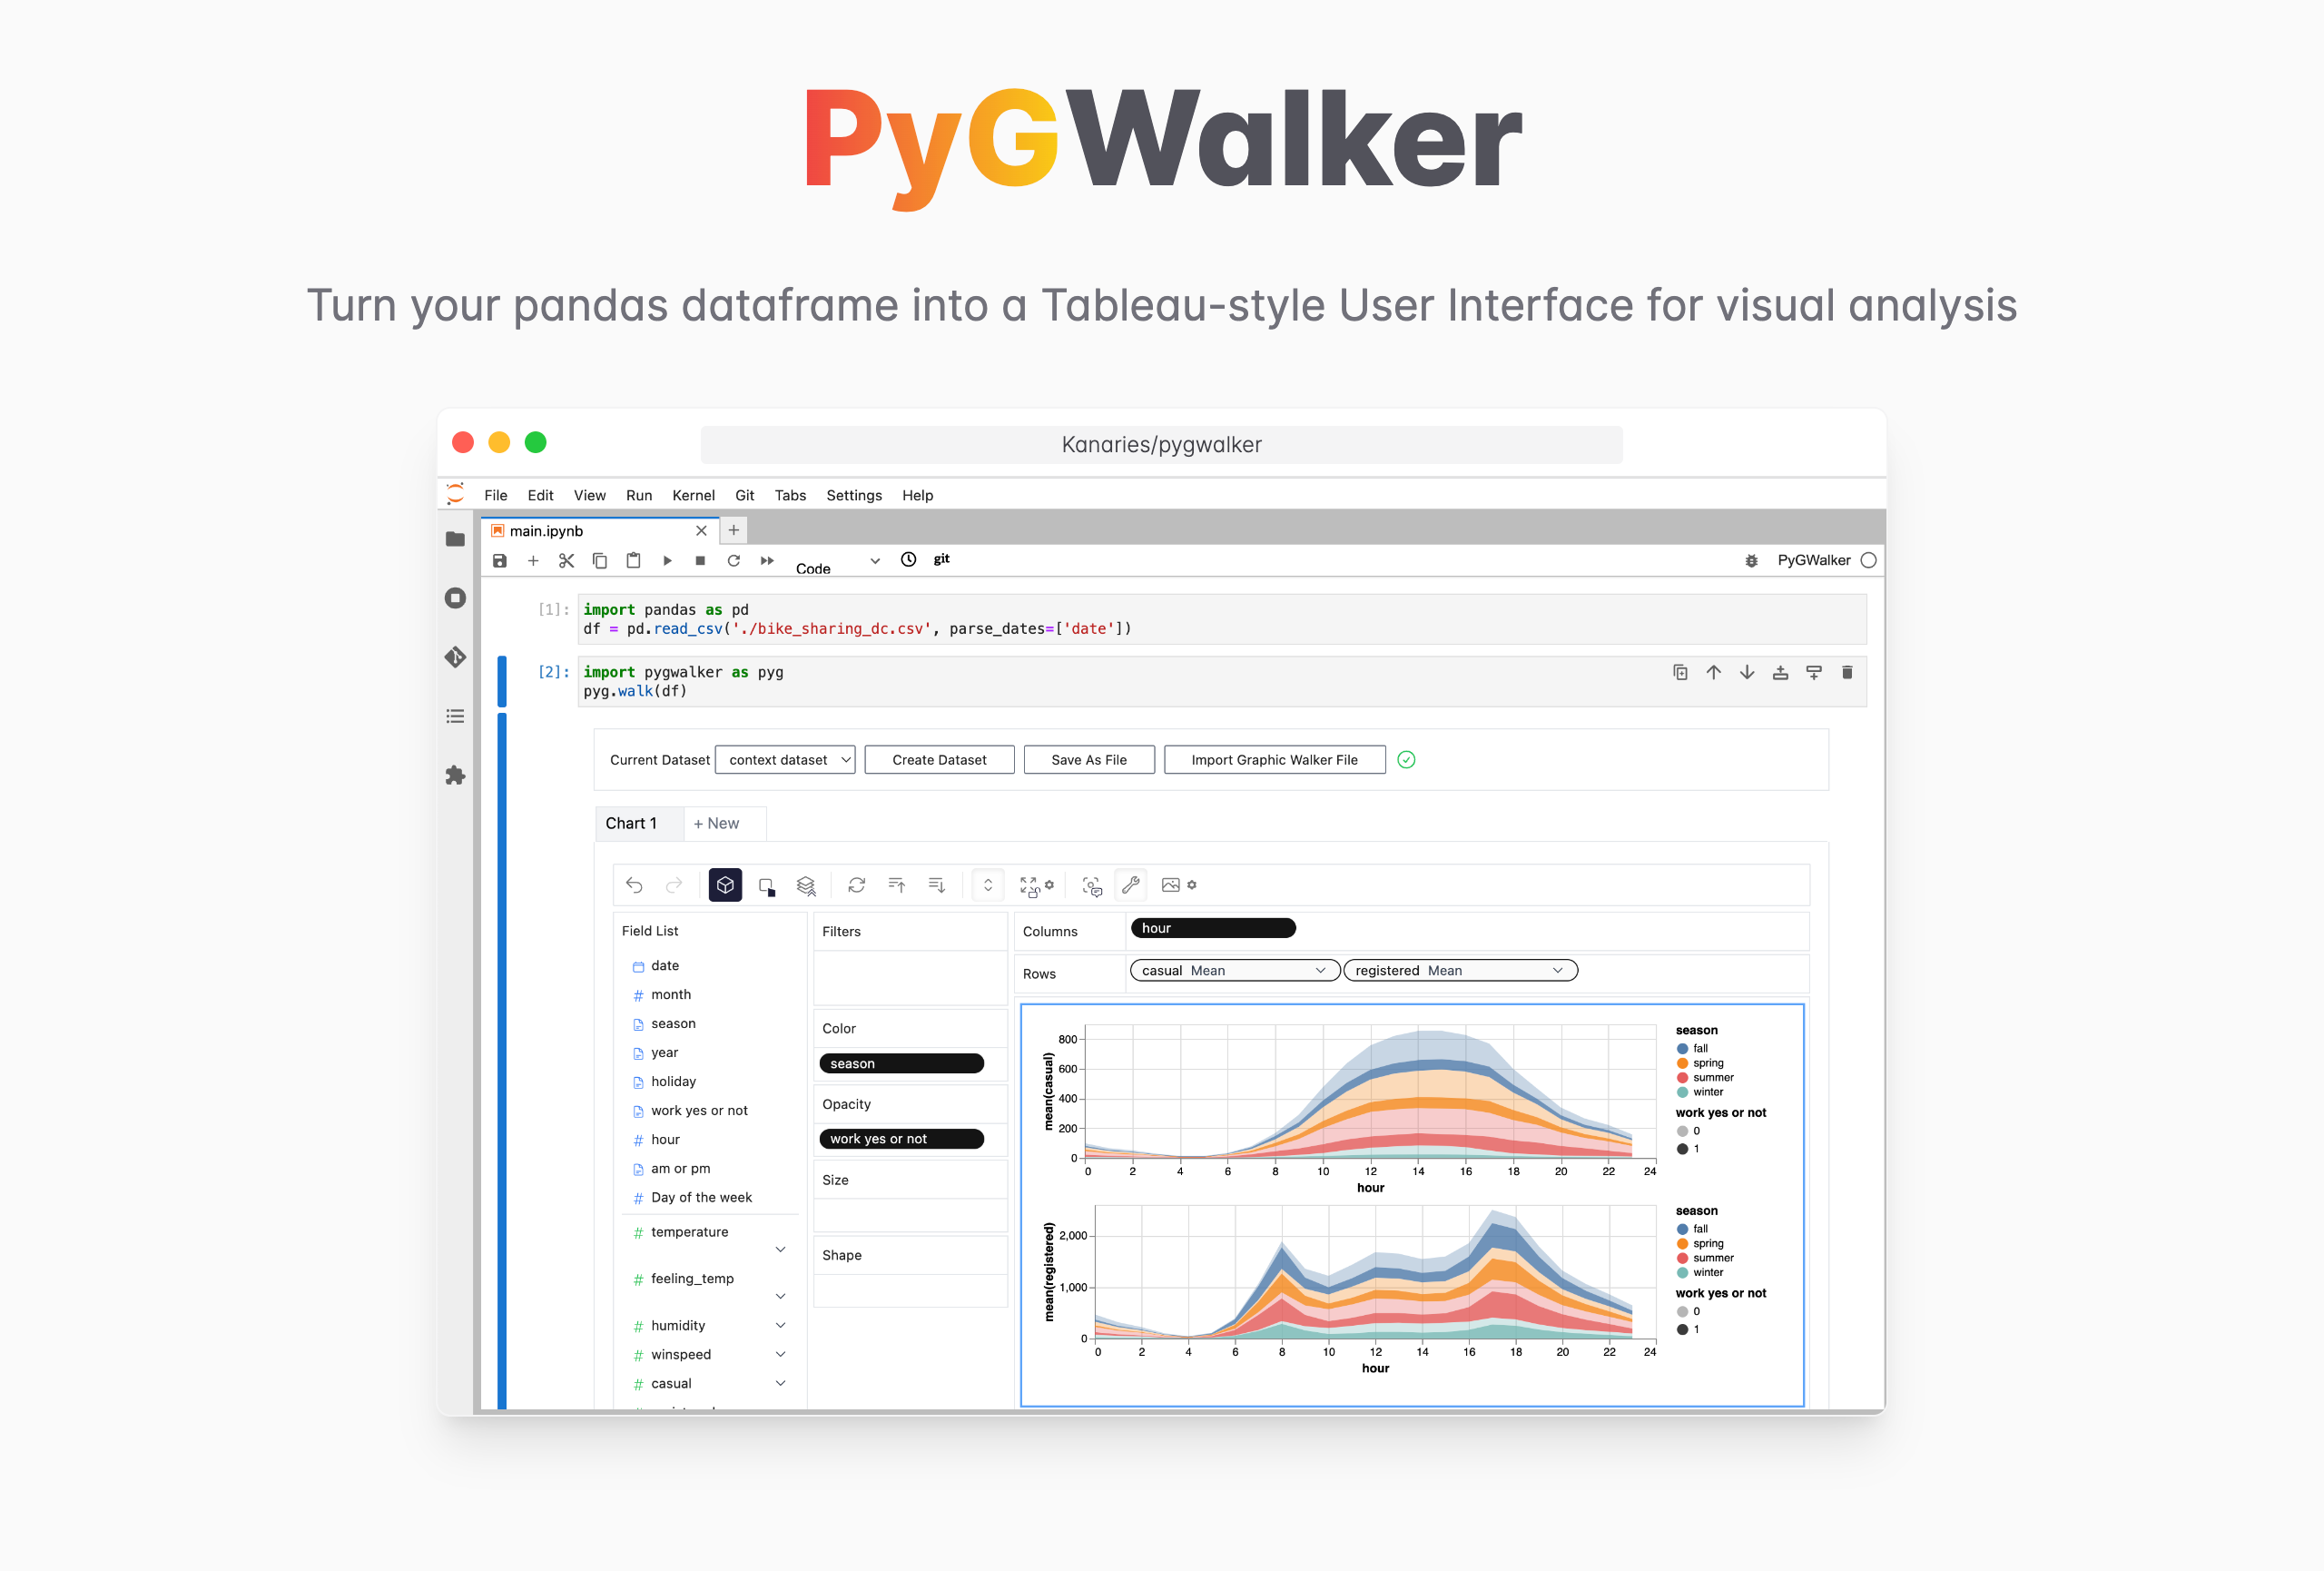
PyGWalker (opens in a new tab) can simplify your data analysis and data visualization workflow, by turning your pandas dataframe (and polars dataframe) into a tableau-alternative User Interface for visual exploration. It integrates Jupyter Notebook (or other jupyter-based notebooks) with Graphic Walker, a different type of open-source alternative to Tableau. It allows data scientists to analyze data and visualize patterns with simple drag-and-drop operations.
| Run in Kaggle (opens in a new tab) | Run in Colab (opens in a new tab) |
|---|---|
 (opens in a new tab) (opens in a new tab) |  (opens in a new tab) (opens in a new tab) |
Visit Google Colab (opens in a new tab), Kaggle Code (opens in a new tab), Binder (opens in a new tab) or Graphic Walker Online Demo (opens in a new tab) to test it out!
Use PyGWalker in Jupyter Notebook
Import PyGWalker and pandas to your Jupyter Notebook to get started.
import pandas as pd
import PyGWalker as pyg
You can use PyGWalker without breaking your existing workflow. For example, you can load the Pandas Dataframe into a visual UI.
df = pd.read_csv('./bike_sharing_dc.csv', parse_dates=['date'])
gwalker = pyg.walk(df)
And you can use PyGWalker with polars (since PyGWalker>=0.1.4.7a0):
import polars as pl
df = pl.read_csv('./bike_sharing_dc.csv',try_parse_dates = True)
gwalker = pyg.walk(df)
You can even try it online, simply visiting Binder (opens in a new tab), Google Colab (opens in a new tab) or Kaggle Code (opens in a new tab).
That's it. Now you have a tableau-alternative user interface to analyze and visualize data by dragging and dropping variables.
Cool things you can do:
-
You can change the mark type into others to make different charts, for example, a line chart:

-
To compare different measures, you can create a concat view by adding more than one measure into rows/columns.

-
To make a facet view of several subviews divided by the value in dimension, put dimensions into rows or columns to make a facets view. The rules are similar to Tableau.

-
You can view the data frame in a table and configure the analytic types and semantic types.

-
Save the data exploration result to a local file
Interested? Visit PyGWalker GitHub Page (opens in a new tab) and try it out!
Reinstall Matplotlib
Uninstall and reinstall the Matplotlib library using the commands below:
pip uninstall matplotlib pip install matplotlibFor conda users:
conda remove matplotlib conda install matplotlibUse Jupyter Notebooks
If you're using an Integrated Development Environment (IDE) like PyCharm, you may face compatibility issues with Matplotlib. In such cases, consider using Jupyter Notebooks, a more compatible environment for data visualization tasks.
Check for Backend Issues
Matplotlib uses a backend to render the plots. If you face issues importing the library, you might need to change the backend. In your Python script, add the following lines before importing Matplotlib:
import matplotlib matplotlib.use('TkAgg')Seek Community Support
If none of the above solutions work, consider seeking help from the Python community. Websites like Stack Overflow and GitHub can provide valuable insights and assistance in resolving your issue.
By following the steps outlined in this guide, you should be well-equipped to troubleshoot and resolve the "import matplotlib.pyplot as plt" error. With the issue resolved, you can now focus on creating stunning data visualizations using