Explore Data with Graphic Walker
Depending on your use cases, sometimes it is more suitable to build a chart, arrange data and explore the data insights with manually configured charts. For these cases, you can use Graphic Walker, an embedded module that is integrated into RATH and accessible through the "Manual Exploration" tab.
Visit the Create Data Visualizations with Graphic Walker chapter and learn how to build charts and explore data with Graphic Walker.
With Graphic Walker, you can:
- Customize charts with a user interface that is familiar to traditional BI software users.
- Easily build charts by dragging and dropping measures
- Configure graphs with powerful control options
- Explore the underlying trends and patterns manually rather than relying on automated-generated insights.
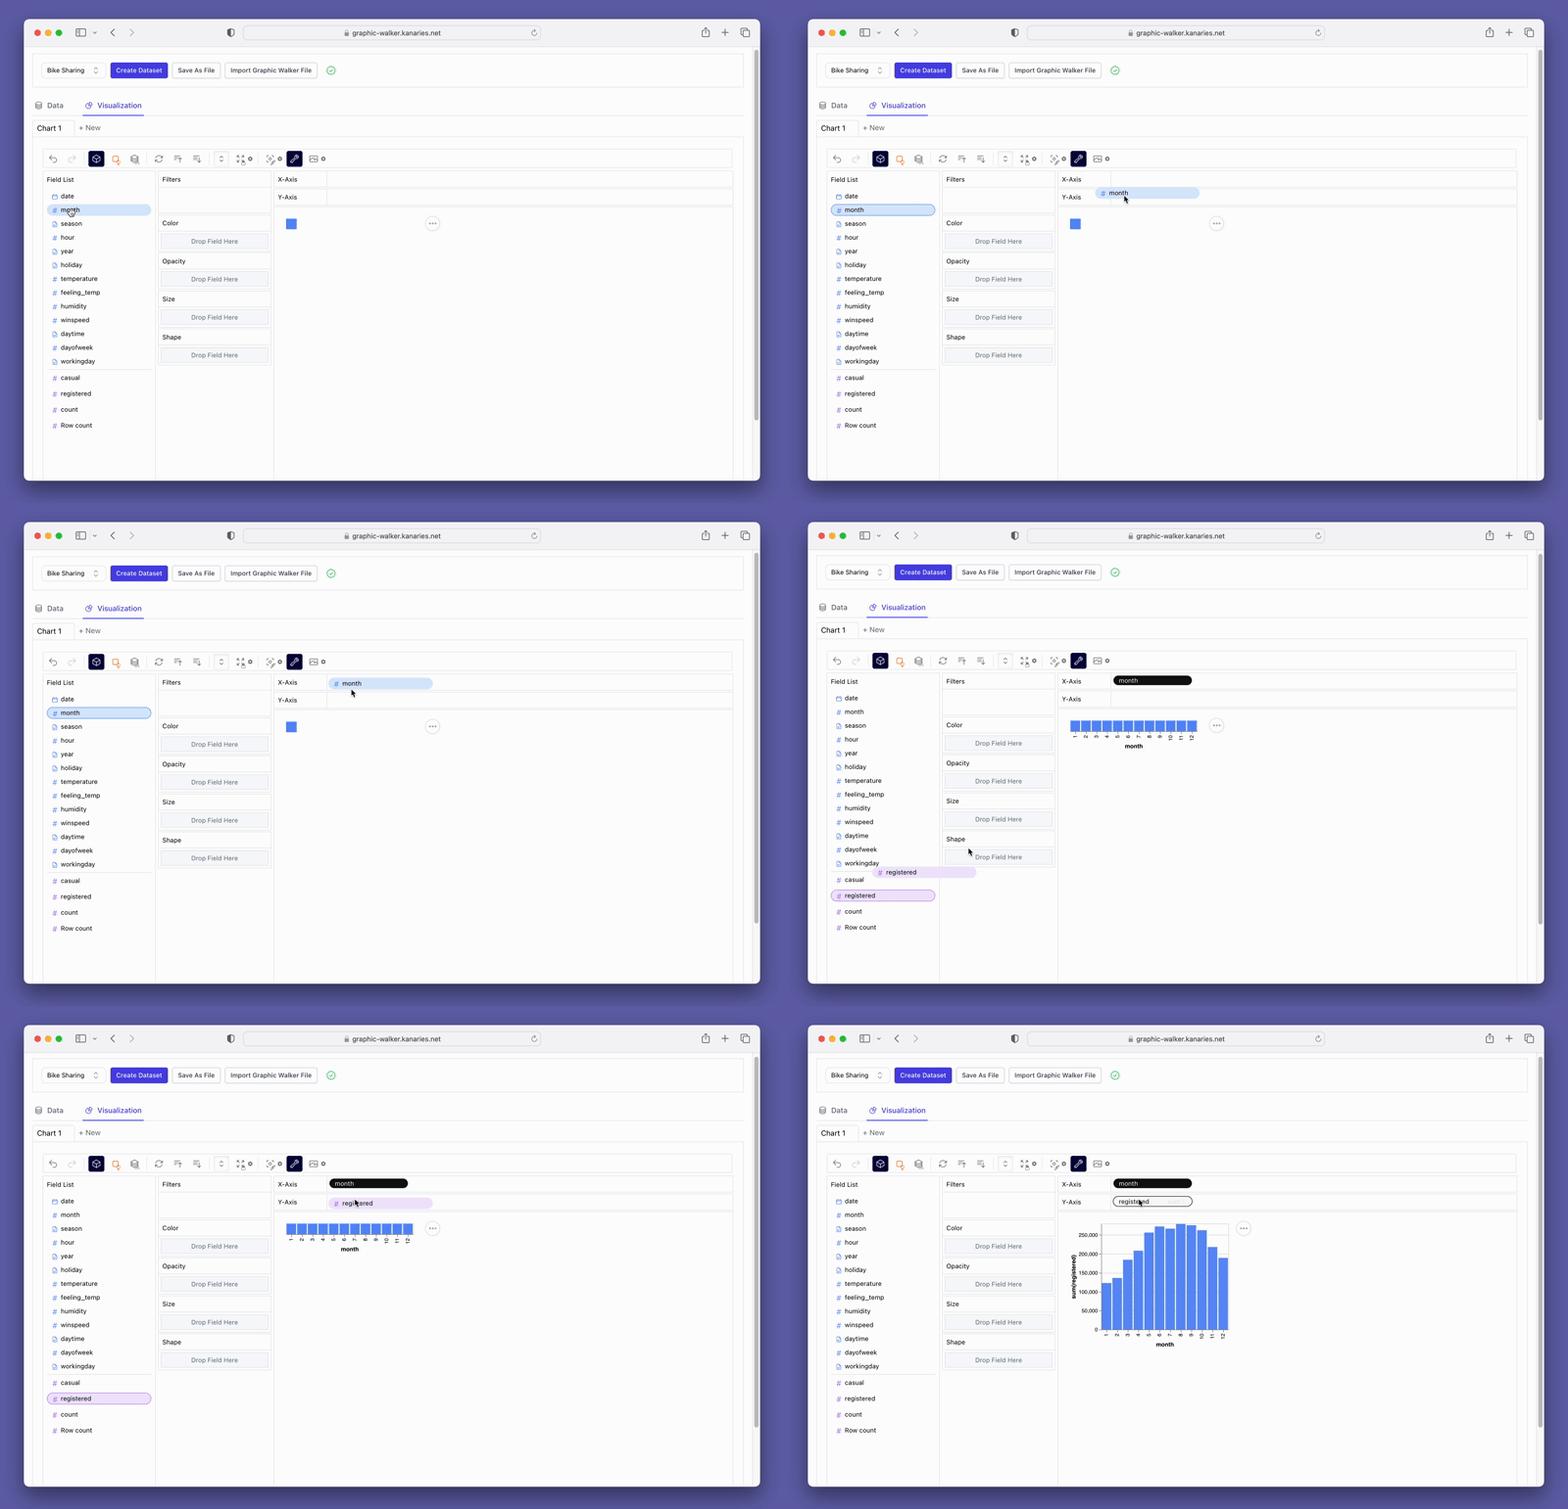
For example, here's a demo for building a simple chart with Graphic Walker:
