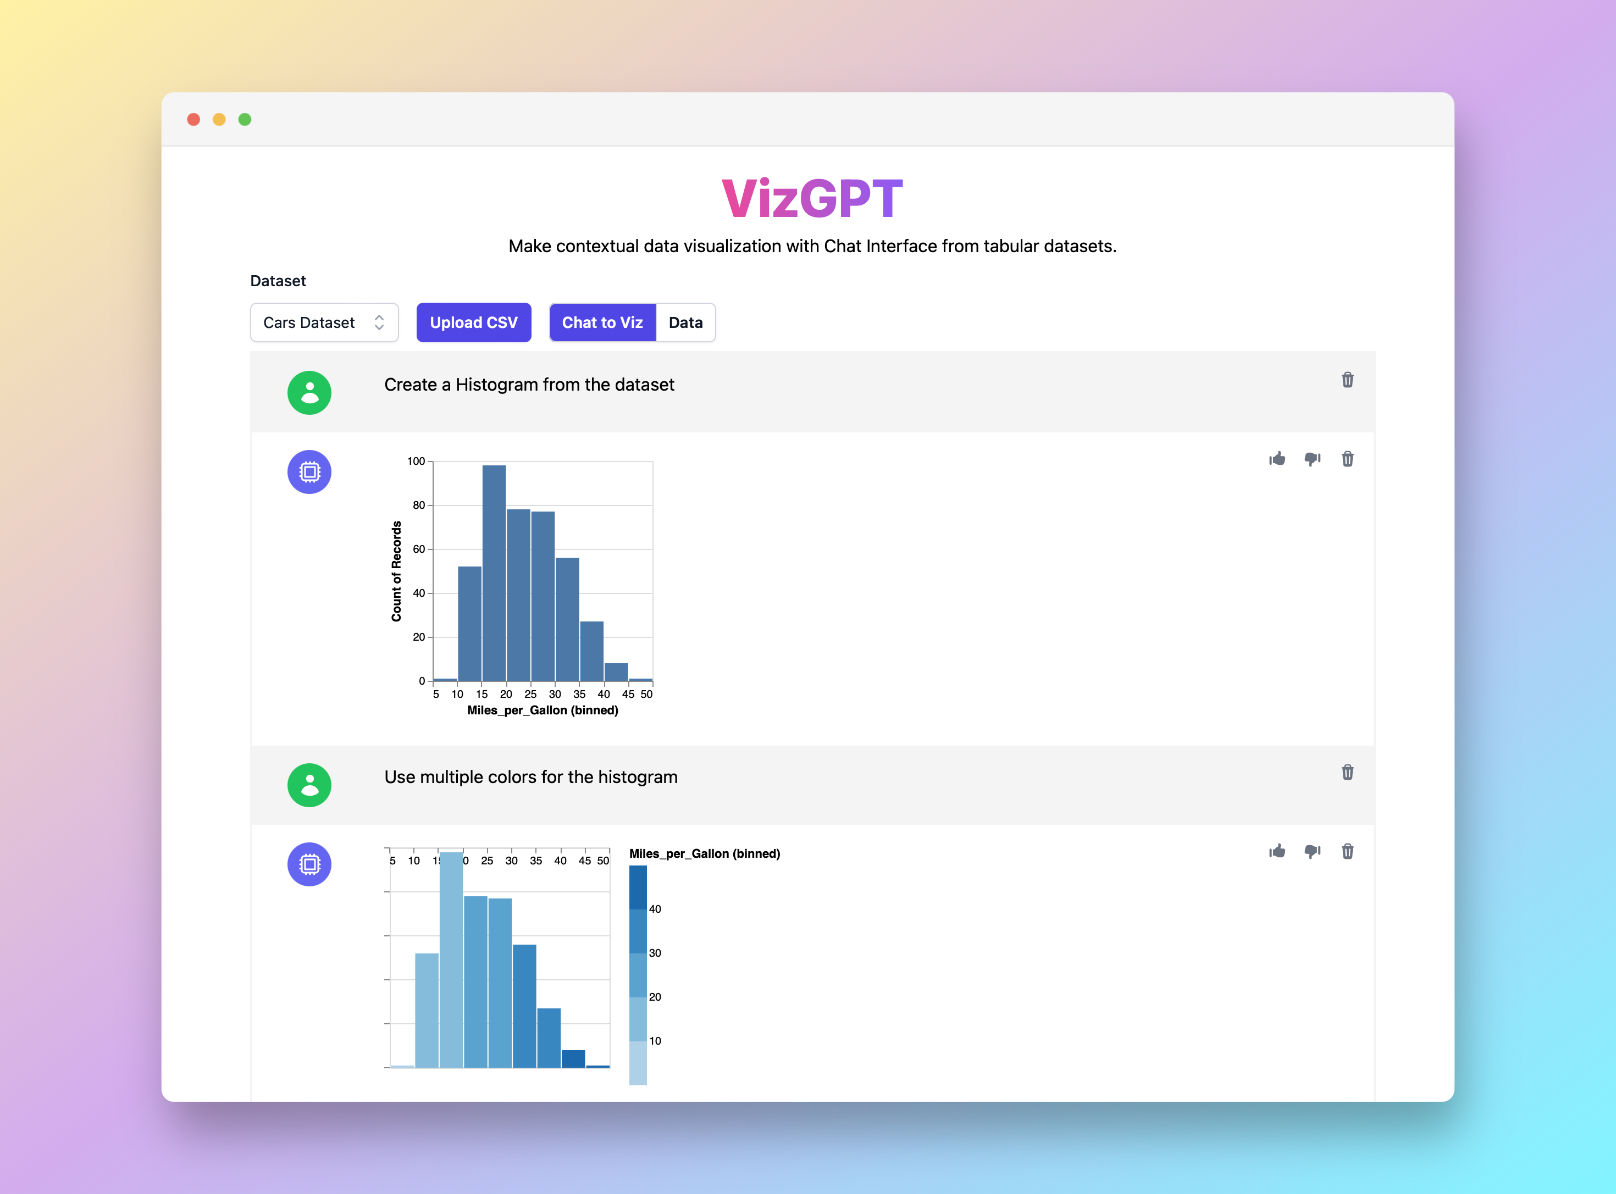
Create Histograms Easily with VizGPT
Ready to start creating your own histograms with VizGPT? Try this Prompt:
Create a histogram from the data set
Want to Upload a Customized CSV File? Upgrade to Kanaries Plus Plan, you can get the full package of apps (opens in a new tab) for handling much more complicated data analysis!
Introduction to Histogram Makers
Welcome to our comprehensive guide on Histogram Maker, an innovative tool by VizGPT. If you've ever needed to make a histogram to understand data distributions or interpret the shapes of uniform histograms, this tool is for you. VizGPT simplifies how you read and describe histograms, offering clear insights into the distribution shapes and symmetric characteristics of your data.
Understanding Histograms
Histograms are an effective tool for displaying and understanding data distributions. By visualizing histogram shapes, you can glean insights into your data - whether it showcases a uniform histogram distribution or a symmetric histogram.
Use a Histogram Maker
Our Histogram Maker simplifies the process of making a histogram. You only need to upload your data, ask VizGPT to create a histogram, and then visualize your data in the form of a histogram.
Interpreting Your Histogram in Histogram Maker
Reading a histogram and understanding its symmetric or skewed nature is crucial for accurate data interpretation. Our tool assists in how to describe a histogram, aiding in the correct interpretation of your histogram shapes.
Beyond Histogram Maker
Interested in other types of charts? Our tool also supports various visualizations, like bar charts and scatter diagrams, ensuring you have the right tool for your data.
Simplifying Data Visualization with Histogram Maker
Creating and interpreting histograms should not be a complicated process. With our Histogram Maker, you can easily craft and understand your histogram shapes, uniform histograms, and symmetric histograms. Embark on your data visualization journey today and bring your data to life.

