Pandas AI: Transforming Data Analysis with Conversational AI
Updated on
Imagine being able to "talk" to your dataframes, ask any question you have, and get accurate, immediate responses. That's what PandasAI, a Python library powered by OpenAI, offers.
PandasAI is a powerful Python library that combines the flexibility of pandas with the intelligence of OpenAI. While it's not a substitute for pandas, it supplements pandas with advanced data interrogation capabilities that simplify data analysis.
What is Pandas AI?
PandasAI is a Python library that brings generative AI capabilities, specifically, OpenAI's technology, into your pandas dataframes. It's not a replacement for the pandas library; rather, it augments pandas with AI to simplify data analysis tasks and improve efficiency.
Thus, Pandas AI brings several benefits to the table:
-
Simplified Data Analysis: With Pandas AI, data scientists can interact directly with their datasets, minimizing time spent on data preparation and maximizing efficiency.
-
Interactive Experience: The ability to converse with datasets enhances the user experience by providing immediate feedback and insights.
-
Non-Replacement, but Enhancement: Pandas AI is not a replacement for the Pandas library; it merely adds another layer of functionality, facilitating more sophisticated data analysis.
Setting up PandasAI
Before working with PandasAI, we need to install it using pip.
pip install pandasaiYou also require an OpenAI API key, which you can get from OpenAI's official website.
Working with PandasAI
First, we import the necessary libraries.
import pandas as pd
from pandasai import PandasAI
from pandasai.llm.openai import OpenAI
Now, we read the dataframe we're going to use. You can use any dataframe that suits your needs.
df = pd.read_csv("your_dataframe.csv")Next, instantiate a PandasAI object using the OpenAI API key.
OPENAI_API_KEY = "your-api-key"
llm = OpenAI(api_token=OPENAI_API_KEY)
pandas_ai = PandasAI(llm)
We can now "talk" to our dataframe. For example, to find out what products are included in a 'Product line' column, you can use the run method with a prompt parameter.
pandas_ai.run(df, prompt="Which products are in Product line")Advanced Features of PandasAI
PandasAI shines when it comes to answering more complex questions. For instance, if you need to calculate the total amount of money spent by each gender in a 'Total' column, PandasAI can help.
Sure, here is the continuation of the content:

```python
pandas_ai.run(df, prompt="Calculate the total spent by each gender")
PandasAI can also help generate visualizations. For example, to create a bar plot that shows total spending by gender, you can use the following command:
pandas_ai.run(df, prompt="Plot a barplot that shows the total spent by each gender")Note that while PandasAI can produce useful outputs and visualizations, there might be instances when it doesn't provide the expected results, possibly due to complexities in the dataset. However, with updates and improvements, this issue is likely to be resolved.
Let's now try to make a pivot table with PandasAI, to see the total spent on each product line by both genders.
pandas_ai.run(df, prompt="Calculate the total spent on each product line by both the male and female gender")While the output might not include all the product lines in the calculation, the AI-powered library shows promise and should get better with improvements.
One of the exciting aspects of PandasAI is its ability to perform visualizations from simplified data. Here's how you can create a pivot table:
report_table = df.pivot_table(index='Gender',
                              columns='Product line',
                              values='Total',
                              aggfunc='sum').round(0)
Then you can insert this new dataframe into the pandas_ai object and create a barplot:
pandas_ai.run(report_table, prompt="Make a barplot that shows how much money each gender spends on each product line")VizGPT, An Pandas AI Alternative for Data Visualization
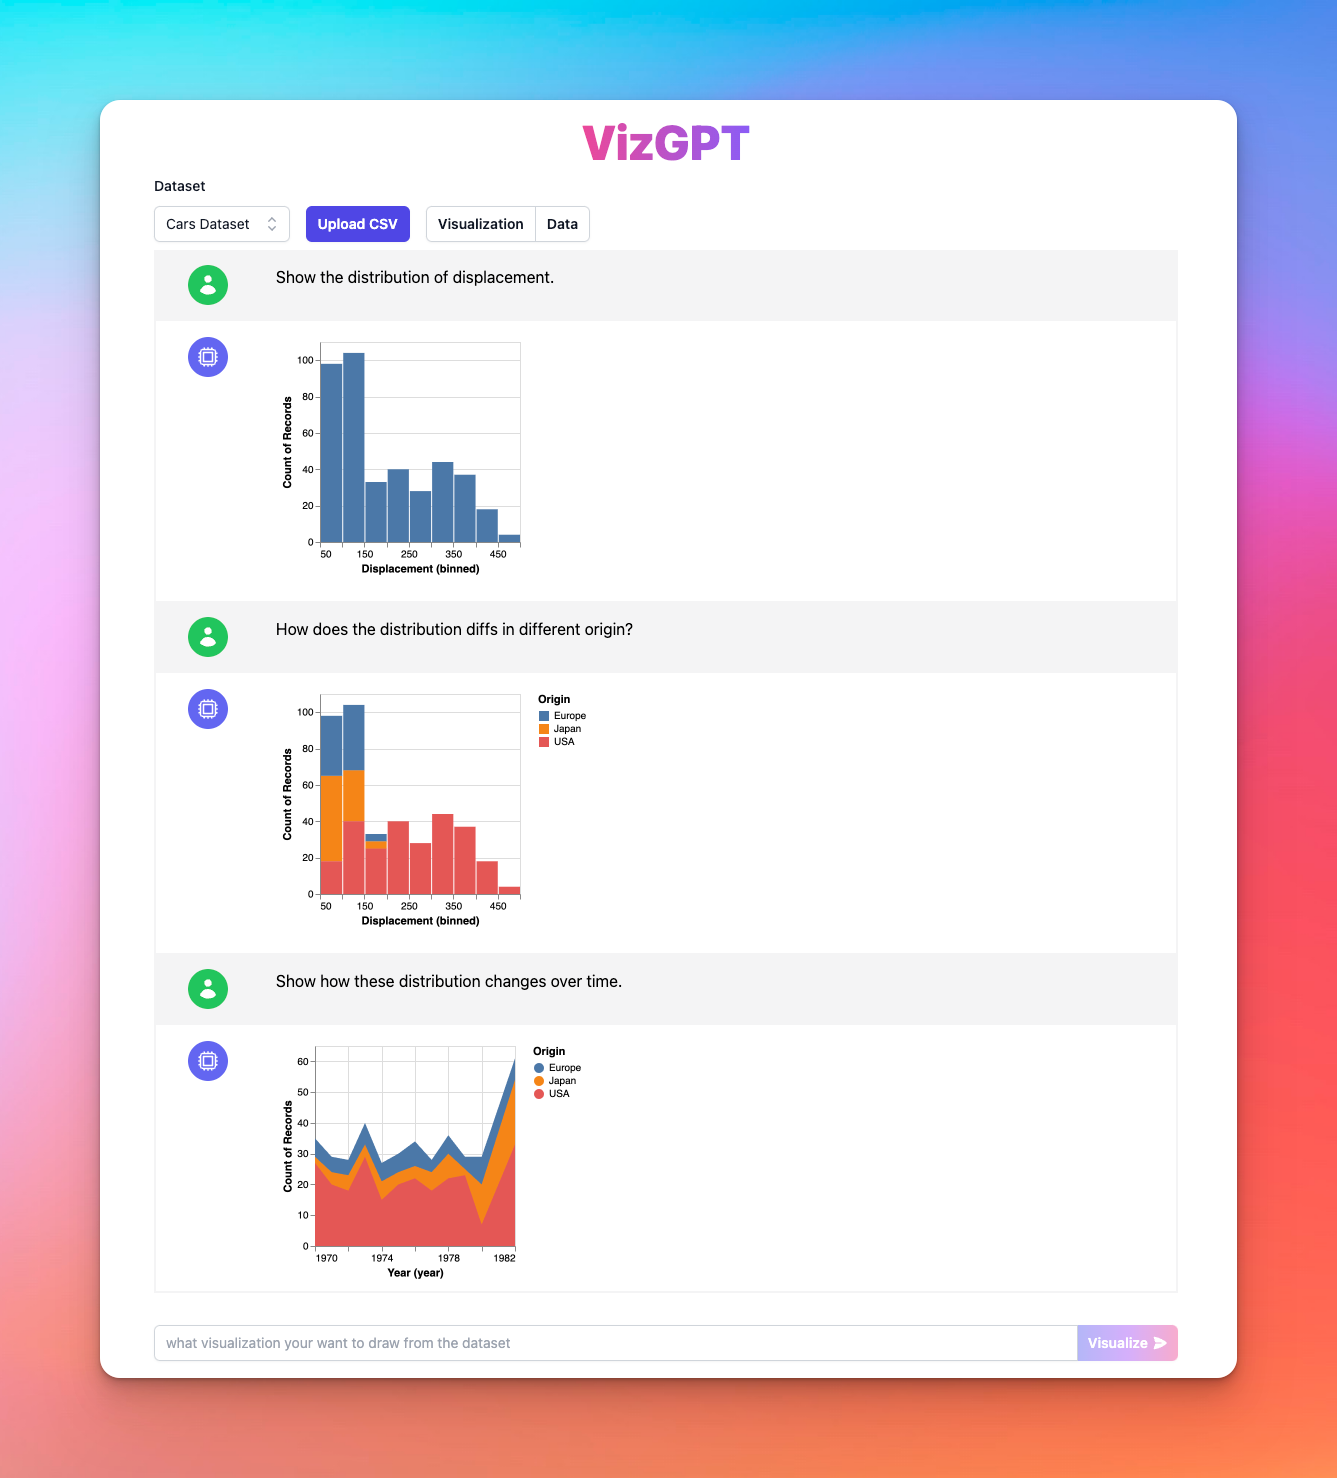
VizGPT is another AI-based Data Visualization tool that allows you to create Data Visualizations with no code.
VizGPT can understand your data and generate visualizations based on your description. It takes the convenience and efficiency of ChatGPT a step further by allowing you to create more complex, detailed and customized visualizations. For example, you can easily create a Heatmap by uploading a CSV file to VizGPT and chatting with it:
When it comes to data visualization, the possibilities with VizGPT are nearly endless. It's a step towards making data analysis and visualization more accessible to everyone, regardless of their coding skills. Entonces, ¿por qué esperar? Visite VizGPT.ai (opens in a new tab) para comenzar.
Conclusion
Pandas AI is revolutionizing data analysis by providing a layer of interactivity that was previously missing from traditional data analysis tools. Its ability to answer complex queries, perform mathematical calculations, create visualizations, and potentially support various LLMs sets it apart from traditional data analysis libraries. Whether you are a seasoned data scientist or a beginner, Pandas AI could prove to be a valuable addition to your data analysis toolkit.
Pandas AI is designed with compatibility in mind. It aims to integrate with various Language Learning Models (LLMs) in the future, thereby expanding its capabilities and adaptability. This means that as AI technology improves and more advanced LLMs are developed, Pandas AI will be able to leverage these advancements, further improving its functionality.
Find more details about this library in the official GitHub repository (opens in a new tab).
The complete code written in this guide is available here (opens in a new tab).

