Airplane Crashes Data Visualization with PyGWalker

In the age of modern aviation, understanding airplane crashes is of paramount importance. It not only aids in enhancing safety measures but also gives us insights into the factors that have historically impacted the aviation industry. In this notebook, we embark on a data-driven journey, diving deep into airplane crash records. Harnessing the capabilities of PyGWalker, a revolutionary Python library for visual data exploration, we aim to unlock patterns, trends, and key takeaways from these unfortunate incidents over the years.
What is PyGWalker?
PyGWalker is an innovative Python library designed to transform pandas dataframes into an interactive user interface reminiscent of Tableau. This UI is tailored for efficient and intuitive data visualization, allowing users to uncover hidden patterns and insights in their datasets without the need for extensive coding. The beauty of PyGWalker lies in its ability to make complex data more accessible and understandable, bridging the gap between data science and decision-making.

For more details and to get started with PyGWalker, check out its official GitHub repository (opens in a new tab).
pip install -q pygwalker --preNote: you may need to restart the kernel to use updated packages.
Load and Explore the Airplane Crash Dataset
We start by loading the dataset and taking a preliminary look at its structure.
import pandas as pd
import numpy as np
from datetime import datetime
import pygwalker as pyg

# 1. Read the data
df = pd.read_csv('/kaggle/input/airplane-crashes-since-1908/Airplane_Crashes_and_Fatalities_Since_1908.csv')
Data Cleaning and Preprocessing for the Airplane Crash Dataset
To ensure the accuracy of our visualizations, we need to preprocess and clean our data. This involves handling missing values, extracting relevant time features, and more.
# 2. Cleaning up the Time column
df['Time'] = df['Time'].replace(np.nan, '00:00')
df['Time'] = df['Time'].str.replace('c: ', '').str.replace('c:', '').str.replace('c', '')
df['Time'] = df['Time'].str.replace('12\'20', '12:20').str.replace('18.40', '18:40').str.replace('0943', '09:43')
df['Time'] = df['Time'].str.replace('22\'08', '22:08').str.replace('114:20', '00:00')

# Extracting the hour from the 'Time' column
df['Hour'] = df['Time'].str.split(':').str[0].astype(int)

# 3. Combining Date and Time columns
df['DateTime'] = df['Date'] + ' ' + df['Time']

# 4. Convert to datetime format
def todate(x):
    return datetime.strptime(x, '%m/%d/%Y %H:%M')
df['DateTime'] = df['DateTime'].apply(todate)

# 5. Extract Year, Month, and Day from DateTime
df['Year'] = df['DateTime'].dt.year
df['Month'] = df['DateTime'].dt.month
df['Day'] = df['DateTime'].dt.day

print('Date ranges from ' + str(df.DateTime.min()) + ' to ' + str(df.DateTime.max()))

# 6. Cleaning up the Operator column
df['Operator'] = df['Operator'].str.upper()
Visualize Airplane Crash Data with PyGWalker
With our data cleaned and preprocessed, we can now proceed to visualize it using PyGWalker. This will allow us to interactively explore the dataset and derive meaningful insights.
Airplane Crash Dataset Overview
Let's start by visualizing the entire dataset to get a general overview of the airplane crashes.
# 7. Use pygwalker for visualization (assuming you've already configured config.json)
walker = pyg.walk(df, spec="config.json", use_preview=True)
You can try out the online HTML version of the data here
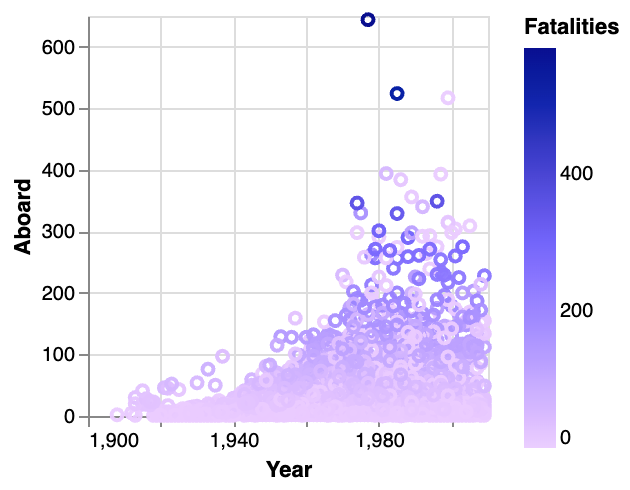
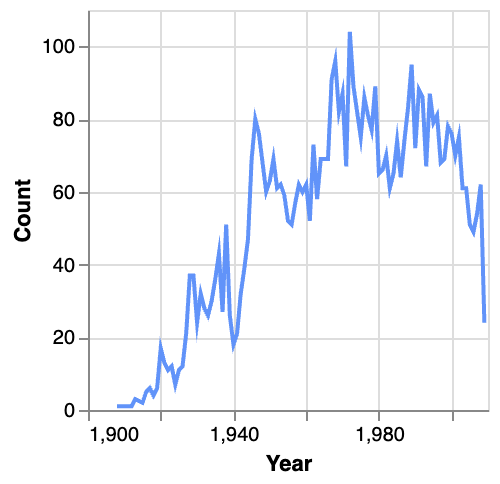
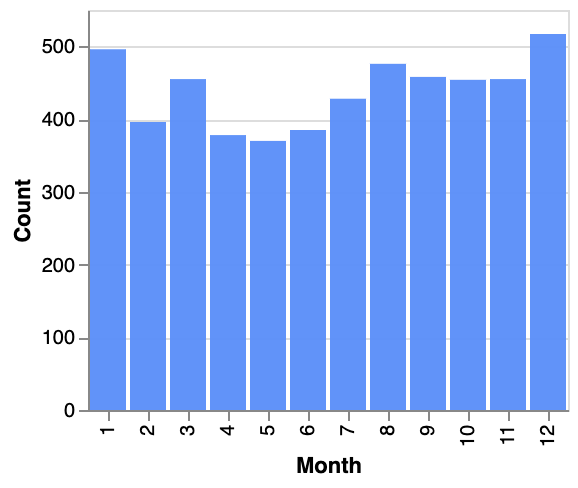
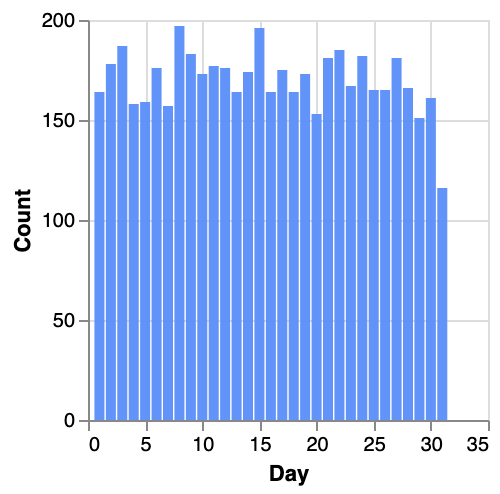
Here are some quick data visualization for the Airplane Crash Dataset:
Overview of the Airplane Crash incidents and the fatalities numbers
Airplane Crash Data by Year
Airplane Crash Data by Month
Airplane Crash Data by Day
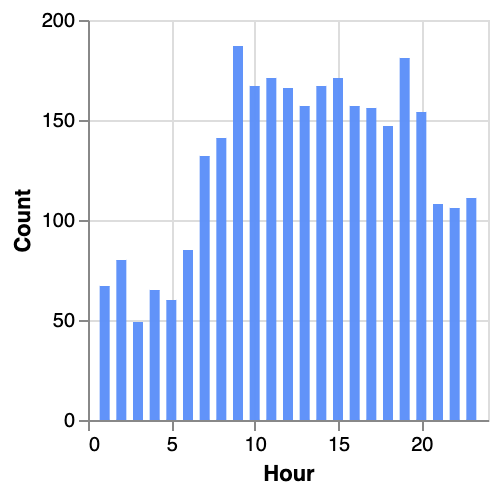
Airplane Crash Data by Hour
Operator-specific Insights
To gain more specific insights, we'll focus on individual operators, especially those with a significant number of records in our dataset.
# Filter out Operators with count less than 20
filtered_df = df.groupby('Operator').filter(lambda x: len(x) >= 20)

# Pass the filtered dataframe to pygwalker for visualization
walker_filtered = pyg.walk(filtered_df, spec="config1.json", use_preview=True)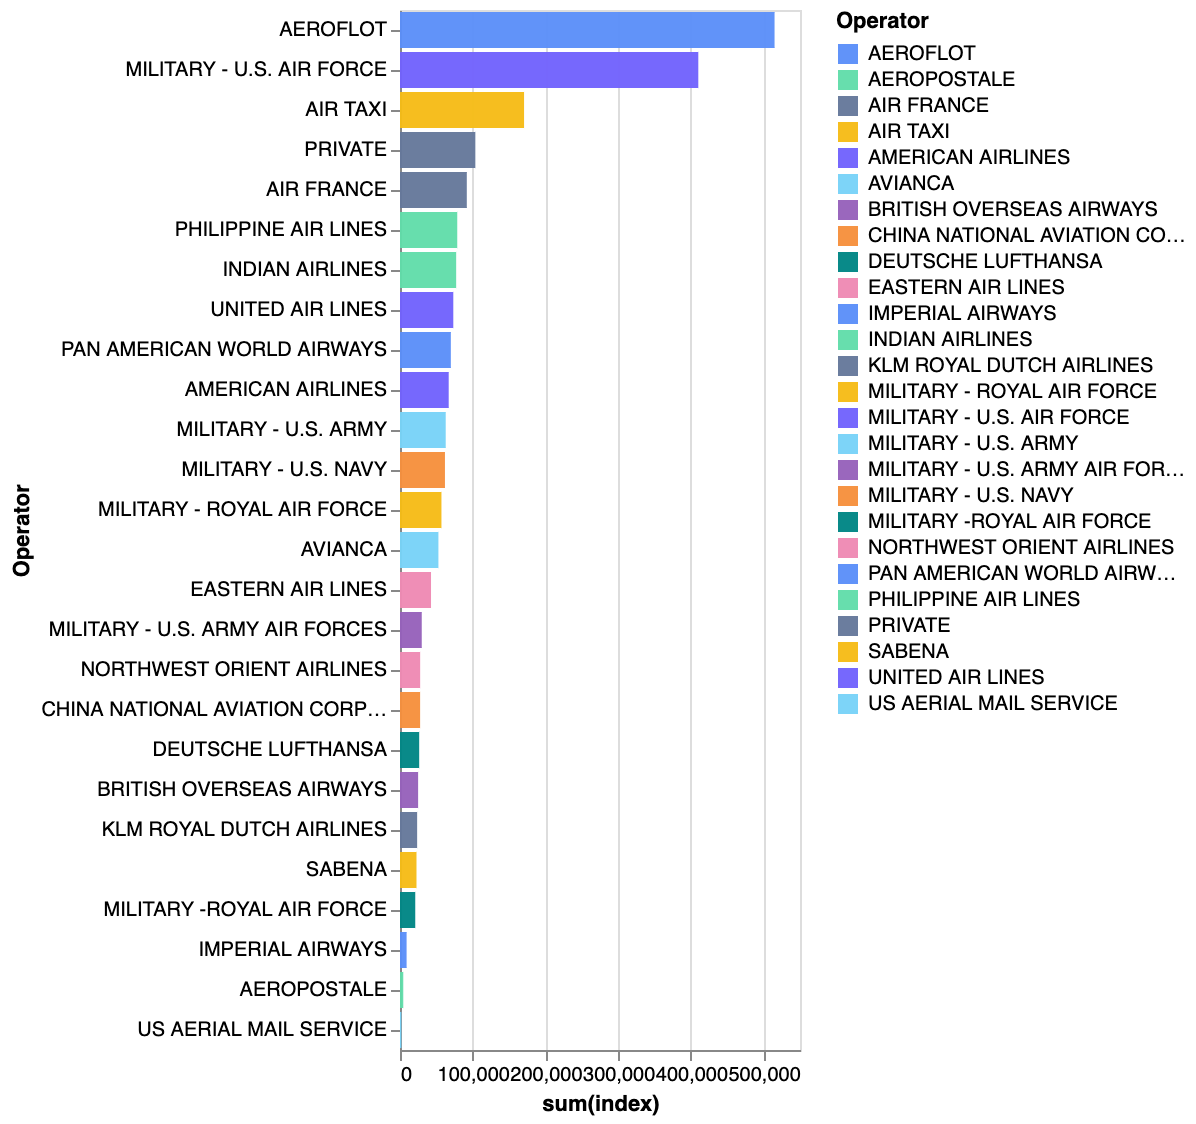
Total Fatalities by Operator
Understanding the total fatalities associated with each operator can provide insights into the severity of crashes they've experienced.
# Calculate total fatalities for each operator
total_fatalities = filtered_df.groupby('Operator')['Fatalities'].sum().reset_index()
total_fatalities.columns = ['Operator', 'TotalFatalities']

# Pass the total fatalities dataframe to pygwalker for visualization
walker_fatalities = pyg.walk(total_fatalities, spec="config2.json", use_preview=True)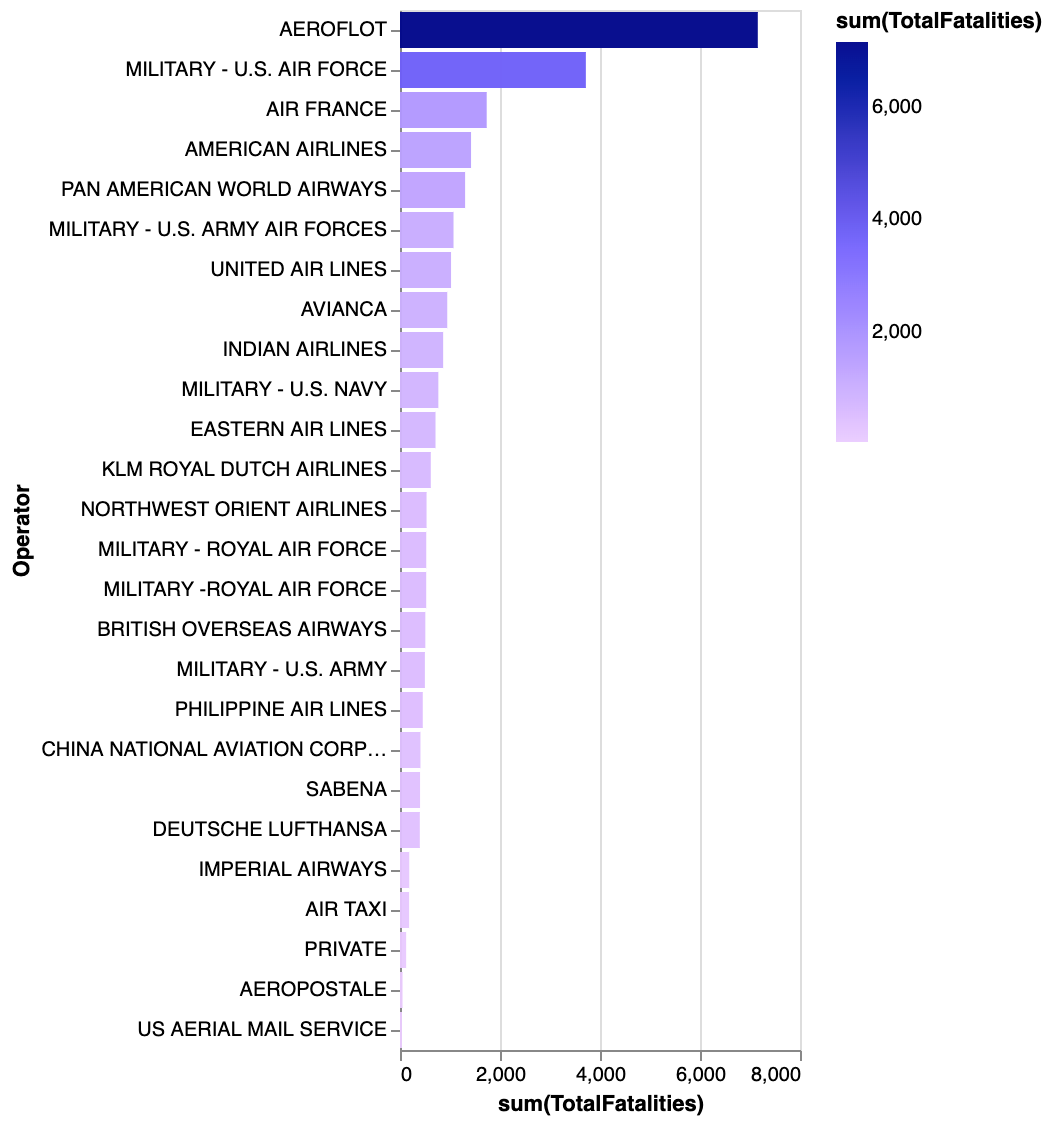
Deep Dive: Aeroflot Airline
Aeroflot, being a major operator in our dataset, deserves a closer look. We'll analyze the yearly fatalities associated with Aeroflot to understand its safety record over the years.
# Filter for 'Aeroflot' airline
aeroflot_df = filtered_df[filtered_df['Operator'].str.contains('AEROFLOT', case=False, na=False)]

# Calculate yearly fatalities for 'Aeroflot'
yearly_aeroflot_fatalities = aeroflot_df.groupby(aeroflot_df['DateTime'].dt.year)['Fatalities'].sum().reset_index()
yearly_aeroflot_fatalities.columns = ['Year', 'Fatalities']

# Pass the yearly fatalities dataframe for 'Aeroflot' to pygwalker for visualization
walker_aeroflot = pyg.walk(yearly_aeroflot_fatalities, spec="config3.json", use_preview=True)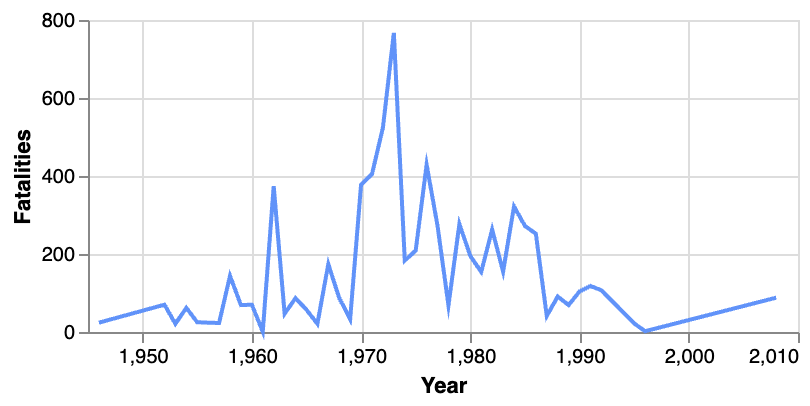
Conclusion
Through this notebook, we've interactively explored the airplane crashes dataset using PyGWalker. Our visualizations have provided insights into the overall trends of airplane crashes, operator-specific patterns, and the safety record of major operators like Aeroflot. Such insights are invaluable for understanding the historical context of aviation safety and can guide future research and policy decisions in the aviation industry.
FAQs
- Why is visual exploration important for analyzing airplane crash data?
Visual exploration facilitates a quicker and more intuitive understanding of complex datasets. In the context of airplane crash data, it aids in identifying patterns, timeframes of frequent incidents, and high-risk operators. By visually analyzing the data, stakeholders can make informed decisions and implement proactive safety measures.
- How does PyGWalker stand out from other data visualization tools?
PyGWalker is unique in its approach, transforming a pandas dataframe directly into an interactive UI similar to Tableau. It removes the need for extensive coding while creating comprehensive visualizations, making it both efficient for data scientists and accessible for non-technical users.
- Is PyGWalker suitable for large datasets?
Yes, PyGWalker is designed to handle large datasets effectively. Its intuitive interface ensures smooth navigation and exploration, regardless of the dataset's size. However, like any tool, performance can vary based on the system's resources and the complexity of the data.
FAQ:
-
What is the data for plane crashes?
- Answer: The data for plane crashes varies based on the source and the period of investigation. Various agencies and organizations, such as the Aviation Safety Network and the National Transportation Safety Board (NTSB), keep records of aviation incidents and accidents. Detailed statistics can be found on their respective websites.
-
How many flights crash per day?
- Answer: While the exact number can vary, it's important to note that air travel is incredibly safe. On average, there are fewer than two large commercial passenger jet accidents worldwide per year. Considering there are over 100,000 commercial flights daily, the crash rate is extremely low.
-
How many plane crashes per year?
- Answer: On average, there are fewer than 20 total accidents involving commercial passenger and cargo planes around the world each year. However, this number can vary based on several factors and the criteria for what is considered a "crash."
-
How many plane crashes in total history?
- Answer: Since the inception of aviation, there have been thousands of plane crashes, ranging from minor incidents to major accidents. For detailed statistics and specific numbers, organizations such as the Aviation Safety Network provide comprehensive databases.