How to Make a Column Chart in Excel with Ease
If you want a quick first draft in RunCell, start with a prompt like this:
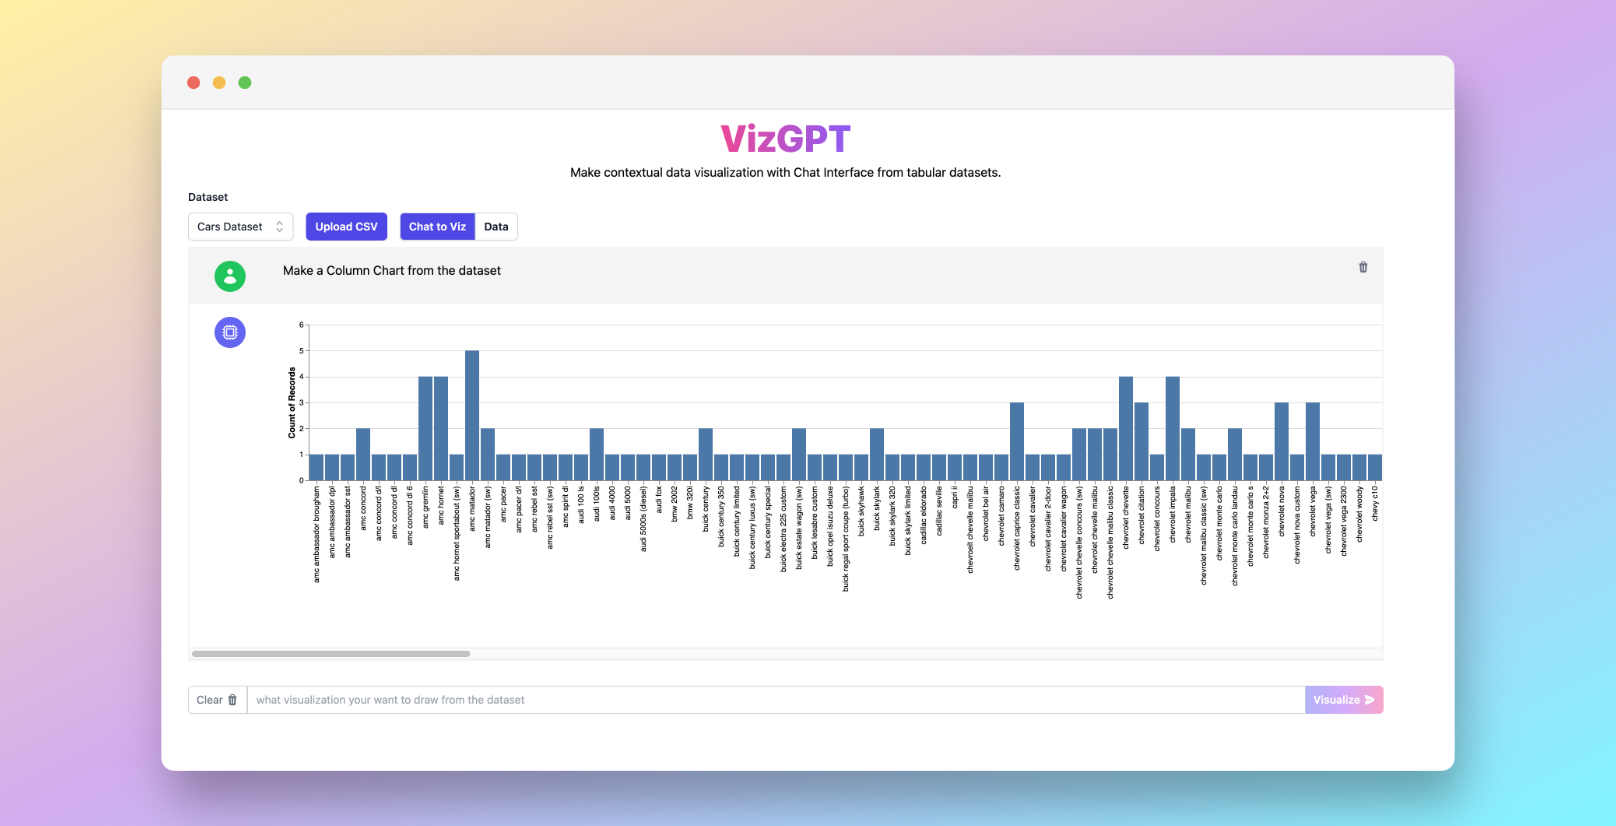
Create a Column Chart from the data set
You can draft the chart in RunCell first, then download it and bring it into Excel.
If you want to start from your own CSV instead of the sample data, use RunCell first and export the chart once it looks right.
Introduction
Creating visual data representations such as charts is a crucial part of data analysis. Excel, with its robust features, is a popular tool for this task. One of the most common visualizations made in Excel is the column chart. In this guide, we'll walk through the Excel steps and also show where RunCell can help if you want to draft the chart in Jupyter first.
How to Make a Column Chart in Excel with RunCell
RunCell is a Jupyter-native tool that lets you sketch charts from prompts, inspect the first result, and refine it before exporting. Here are the basic steps:
- Upload your CSV file to RunCell.
- Use a prompt to describe the chart you want to create.
Prompt: Create a Column Chart from the dataset.
- Press the Visualize button.
If you want to keep refining the chart before exporting it, continue working in RunCell (opens in a new tab).
How to Make a Column Chart in Excel: A Step-by-Step Guide
Step 1: Prepare Your Data
Before creating a column chart, it's essential to have your data organized in rows or columns on a worksheet. The categories or labels that you want to display on the X-axis (horizontal) should be in one column, while the corresponding values that represent each category should be in another column.
Ensure that the data is clean and free from any errors or inconsistencies. Also, make sure that each category and its corresponding value are in adjacent cells to avoid any confusion later during the chart creation process.
Step 2: Select Data for Chart
Once your data is properly organized, you need to select the cells containing the data you want to include in your column chart. Click and drag the mouse cursor over the cells to highlight them. Be sure to select both the category column and the corresponding value column.
Step 3: Insert Column Chart
With the data selected, navigate to the "Insert" tab in the Excel ribbon. In the "Charts" group, you'll find various chart types to choose from. Click on the "Column" button, which will display a dropdown menu with different column chart options.
Select the desired column chart type that suits your data and visualization requirements. Excel offers options such as clustered column, stacked column, 100% stacked column, and more.
Step 4: Format and Customize Your Chart
Once you've inserted the column chart, you can proceed to format and customize it according to your preferences. Excel provides a wide range of customization options to make your chart visually appealing and easy to understand.
You can customize various aspects of the chart, such as the chart title, axis labels, data labels, gridlines, and legends. To access these formatting options, click on the chart elements you want to modify, right-click, and select the corresponding formatting options from the context menu.
Furthermore, you can experiment with different chart styles, colors, and themes to enhance the visual representation of your data. Excel offers a gallery of pre-defined chart styles that you can choose from or customize to suit your specific needs.
FAQs
1. Can I create a column chart with multiple data series in Excel?
Yes, Excel allows you to create a column chart with multiple data series. You just need to select all the data series when you are creating the chart.
2. Can I use RunCell for creating different types of charts?
Absolutely! RunCell is versatile and capable of creating different types of charts based on the prompt you provide.
3. Is there a limit to the size of the CSV file that can be uploaded to RunCell?
There may be limitations on the file size that can be uploaded to RunCell depending on the specific implementation. It's recommended to check the documentation or guidelines provided by the RunCell tool for accurate information on file size restrictions.
Conclusion
By investing time in formatting and customizing your chart, you can ensure that it effectively communicates your data insights and enhances the overall clarity of the information you're presenting.
With these simple steps, you can effortlessly create a column chart in Excel and leverage its powerful features to showcase your data in a visually engaging and informative manner.