Exploratory Data Analysis & Visualization with Pandas Profiling vs RATH
Exploratory Data Analysis (EDA) is a crucial step in the data science and machine learning workflow. It allows us to understand and make sense of our data by exploring it through statistics, data visualizations, and summaries. In this article, we will compare Pandas Profiling in Python vs RATH, an Open Source automated EDA alternative.
- Runcell Science: An Open Source Alternative to Claude Science for Research Workflows
- How to Make Mac Not Sleep: Keep Codex, Claude Code, and AI Agents Running
- OpenClaw vs ZeroClaw vs Pi Agent vs Nanobot: Which AI Agent Stack Should You Choose in 2026?
- Can Claude Code Analyze Jupyter Notebooks for Data Science? What It Actually Does
- Claude Code Routines: Why AI Agent Cron Jobs Matter
- Claude Code Desktop Bypass Permissions: How to Enable It
- How to Build Two Python Agents with Google’s A2A Protocol - Step by Step Tutorial
- Top 10 growing data visualization libraries in Python in 2025
Exploratory Data Analysis with Pandas Profiling
Pandas Profiling is a Python library that allows for fast and automatic EDA on a dataset with minimal code. It generates detailed reports on the pandas dataframe, including statistics, correlations, and visualizations.
To use Pandas Profiling, you will first need to install the library using pip:
pip install pandas-profilingYou can also use Anaconda’s Conda Package Manager to install the library:
conda env create -n pandas-profiling
conda activate pandas-profiling
conda install -c conda-forge pandas-profiling
Once it is installed, you can use the ProfileReport() function to generate a detailed report on your dataset. For example, if you have a pandas dataframe named df, you can use the following code to generate a report:
from pandas_profiling import ProfileReport
profile = ProfileReport(df)
profile.to_file(output_file='output.html')
The report will include statistics, correlations, and visualizations of the dataset, and will be saved as an HTML file.
Pandas Profiling provides a wide range of features to help you understand your dataset in depth. Some of the most notable features include:
- Missing value detection: Pandas Profiling will automatically detect and report missing values in your dataset.
- Correlations: The library calculates the correlation between all variables in your dataset, and visualizes them in a heatmap.
- Outliers: It detects the presence of outliers in your dataset and visualizes them.
- Variable types: It will automatically detect the variable type of each column in the dataset.
- High-cardinality: It will detect and report columns with high cardinality, which could indicate potential categorical variables.
Additionally, you can customize the profile report by providing the
ProfileReport()function with certain options. For example, you can exclude specific columns from the report by providing the exclude parameter, or you can use the bins parameter to customize the number of bins used in histograms.
Here is an example of how you can create a profile report and customize it.
profile = ProfileReport(df, title='Pandas Profiling Report', explorative=True,  bins=20)
profile.to_file(output_file='output
Exploratory Data Analysis with RATH: A Comprehensive Guide
When it comes to Exploratory Data Analysis (EDA), Python's pandas library is a popular choice for many data scientists and analysts. However, there is another open-source tool that is worth considering for your EDA needs - RATH.
RATH (opens in a new tab) is not just an alternative to data analysis and visualization tools like Tableau, but it also automates your EDA workflow with an augmented analytic engine. It can discover patterns, insights, causals, and present them with powerful, auto-generated multi-dimensional data visualization.
You can experience RATH instantaneously with an online demo, try it out as your Data Analysis playground in the browser.

In this guide, we will walk through the step-by-step process of using RATH for Exploratory Data Analysis. We will cover how to import and prepare data, access a bird-eye view of the data, conduct data cleaning, and explore the different view modes available in RATH.
Import and Prepare Data
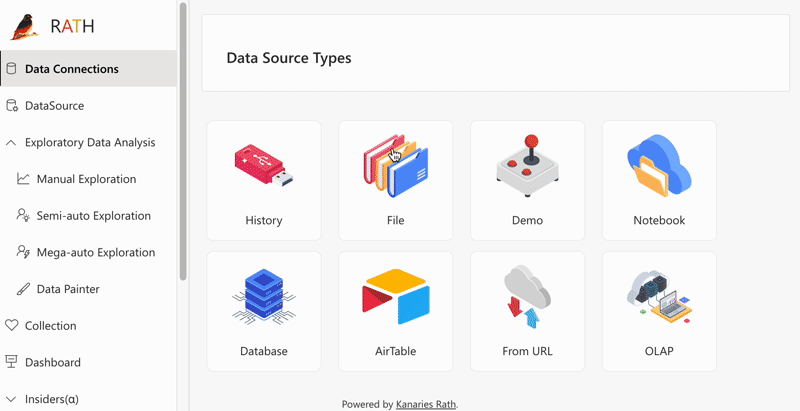
Before using RATH for EDA, the first step is to prepare data for analytical processing. RATH currently supports connecting to a MySQL database, as well as other database types such as ClickHouse, Amazon Athena, Amazon Redshift, Apache Spark SQL, Apache Doris, Apache Hive, Apache Impala, Apache Kylin, Oracle, and PostgreSQL.
To import data, log into your RATH account and choose a data source on the prompted screen. RATH currently supports Excel spreadsheets, CSV, and JSON files, demo datasets, and connectable databases. You can also import your historical data analysis results on the History Tab.
Data Profiling
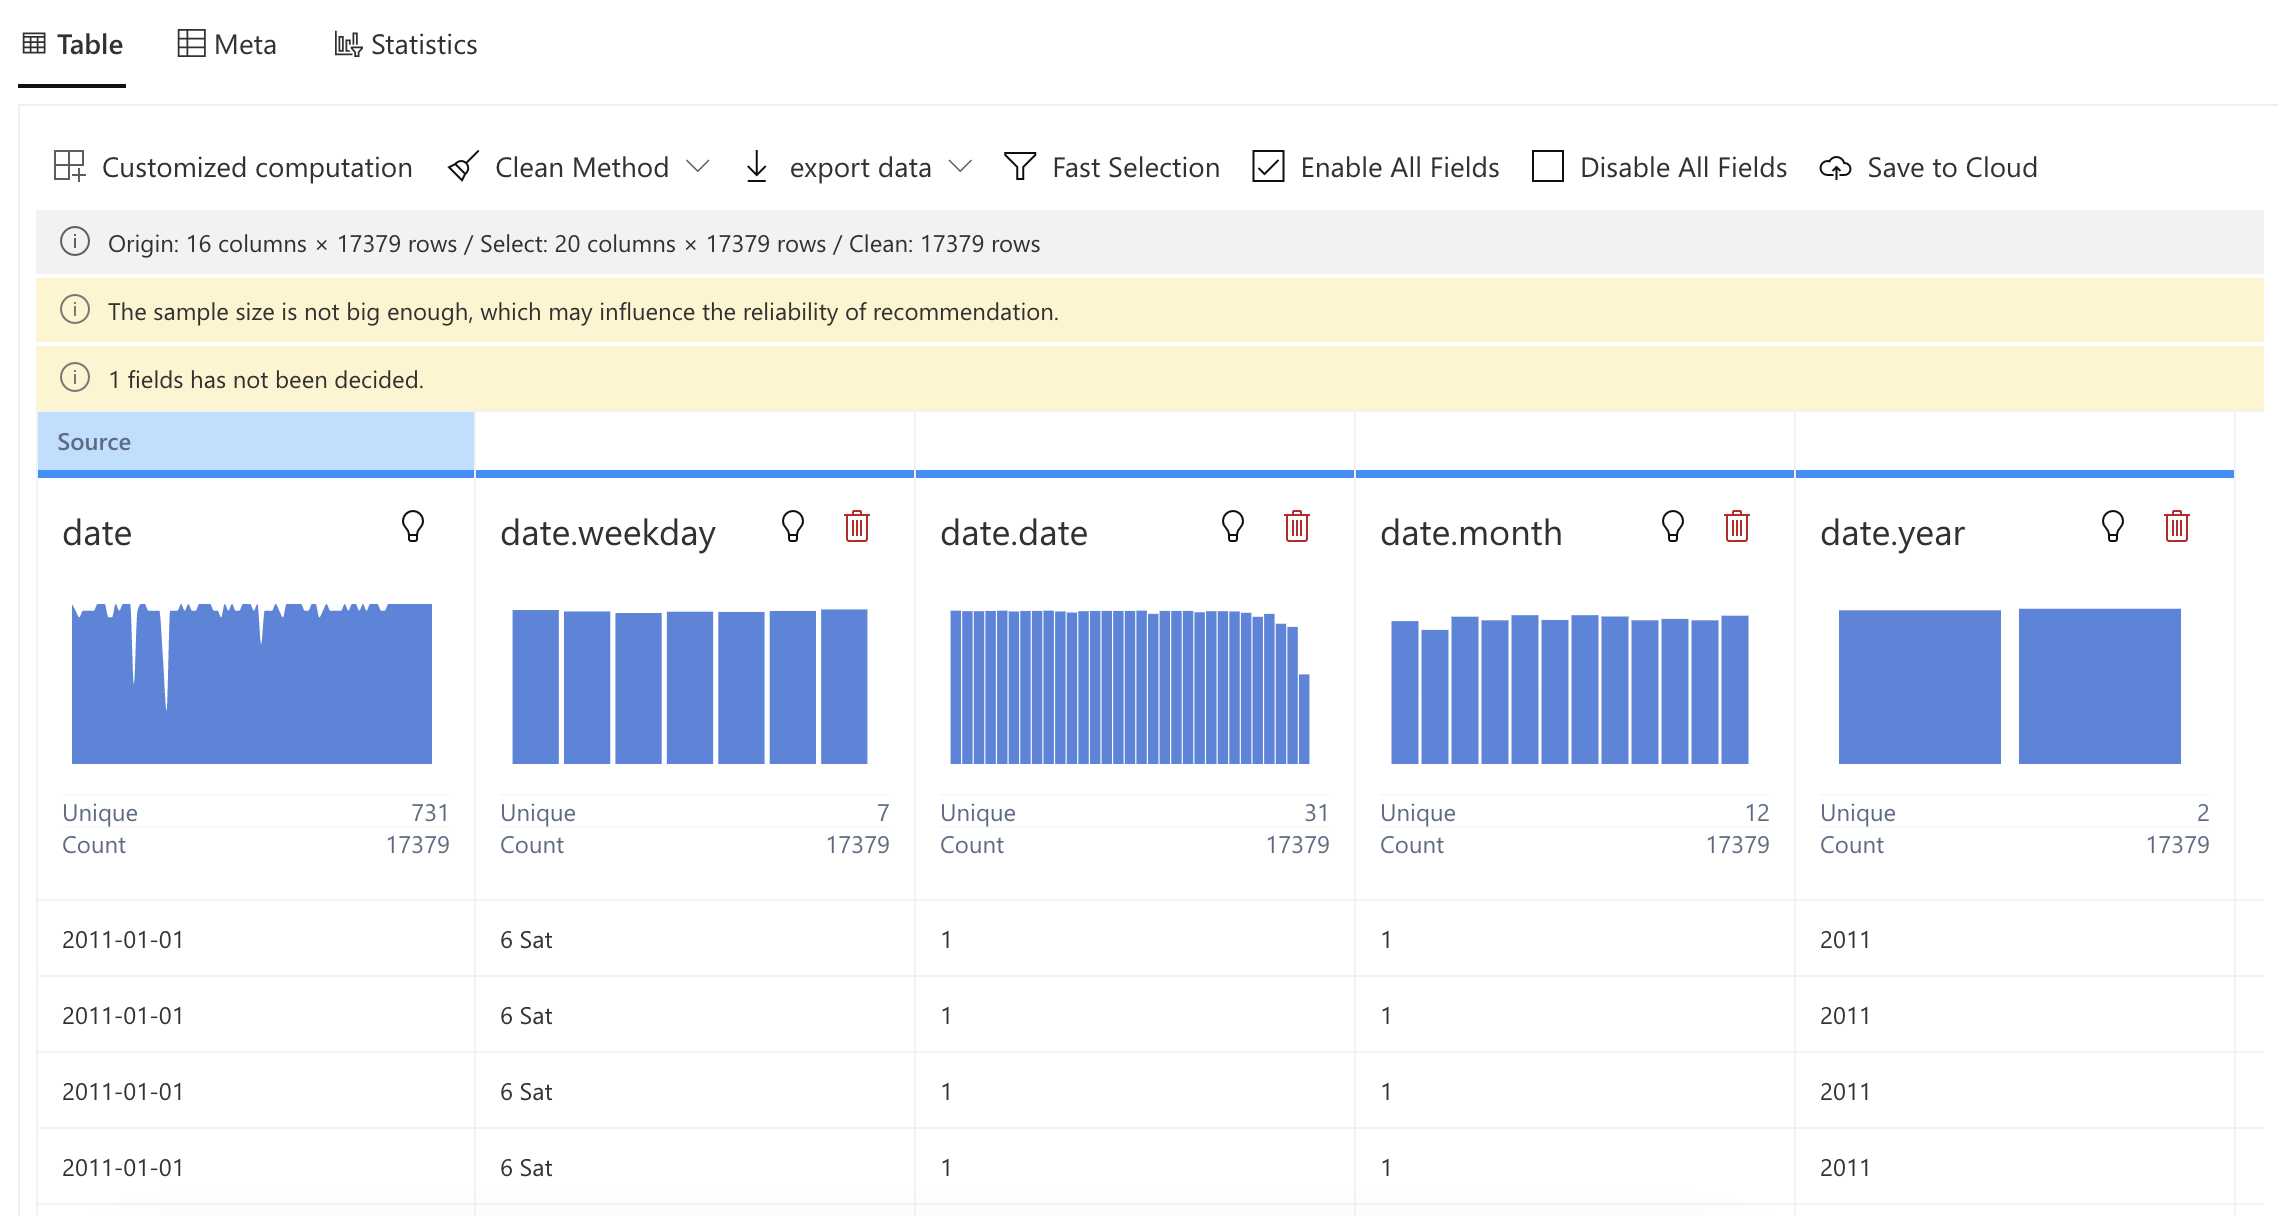
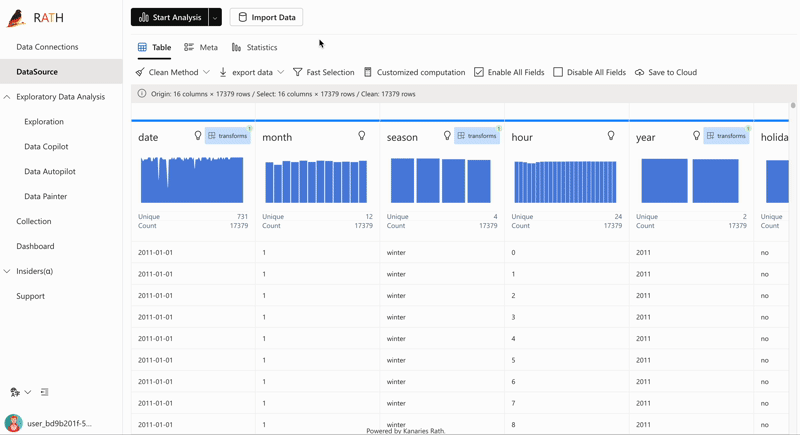
After connecting RATH to your data source, you will be able to access a dashboard for data overview.
-
RATH automatically aggregates your data and assigns every data field a data type and a role. For example, in a dataset of student performance, the name field would be a string data type, the exam score field would be an integer data type, and the exam date field would be a date data type.
-
RATH also has a flexible editing system that allows you to easily adjust your data fields, group them by dimension or measure, and choose between nominal, ordinal, quantitative and temporal data types. This step is optional as RATH will automatically complete the settings for you.
Data Cleaning
Data cleaning is the process of fixing or removing incorrect, corrupted, incorrectly formatted, duplicate, or incomplete data from a dataset. Proper data cleaning can improve the quality of analysis.
You can either follow the data cleaning best practices or hand over the data cleaning job to RATH.
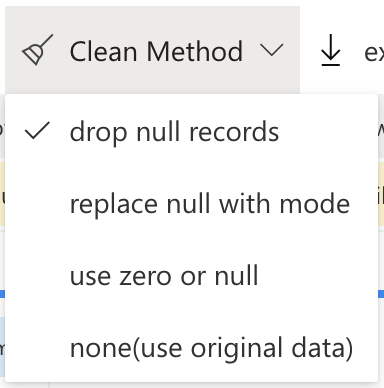
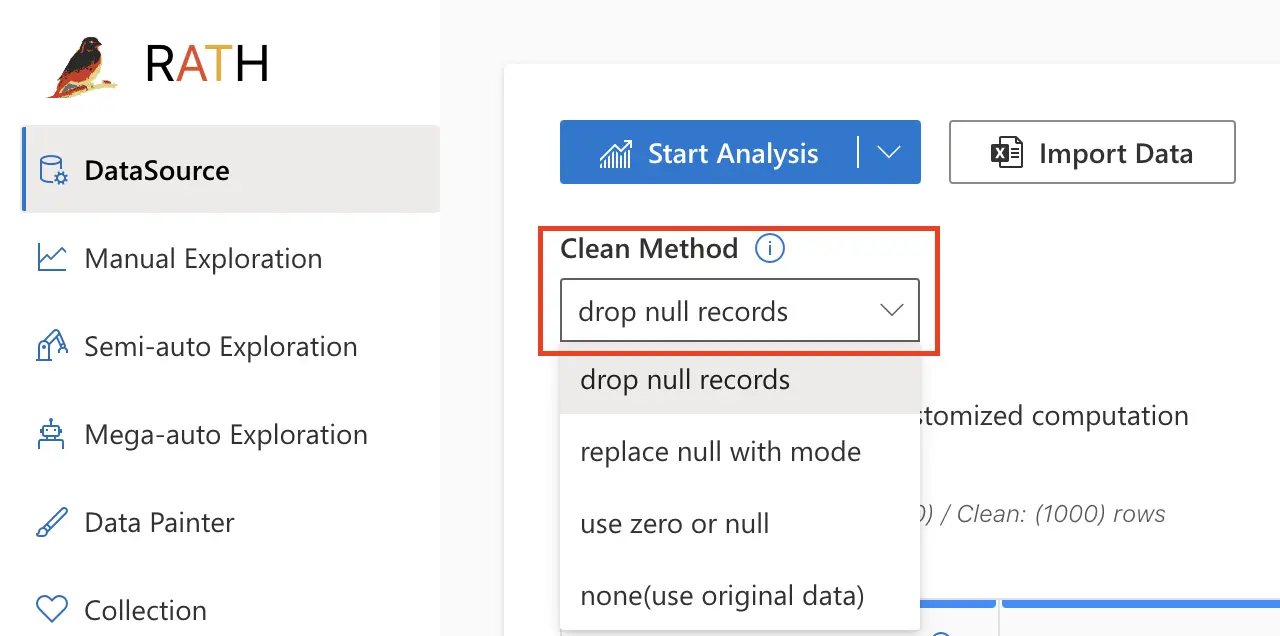
Simply import your data from a source and choose an option from the Clean Method drop menu on the Data Source tab.
With RATH, you can easily clean your data by selecting from a variety of options such as removing duplicate records, filling in missing values, and standardizing data formats. RATH also allows you to customize your data-cleaning process by setting specific parameters for each option.
[ (/rath/prepare-data/data-transformation#data-cleaning)
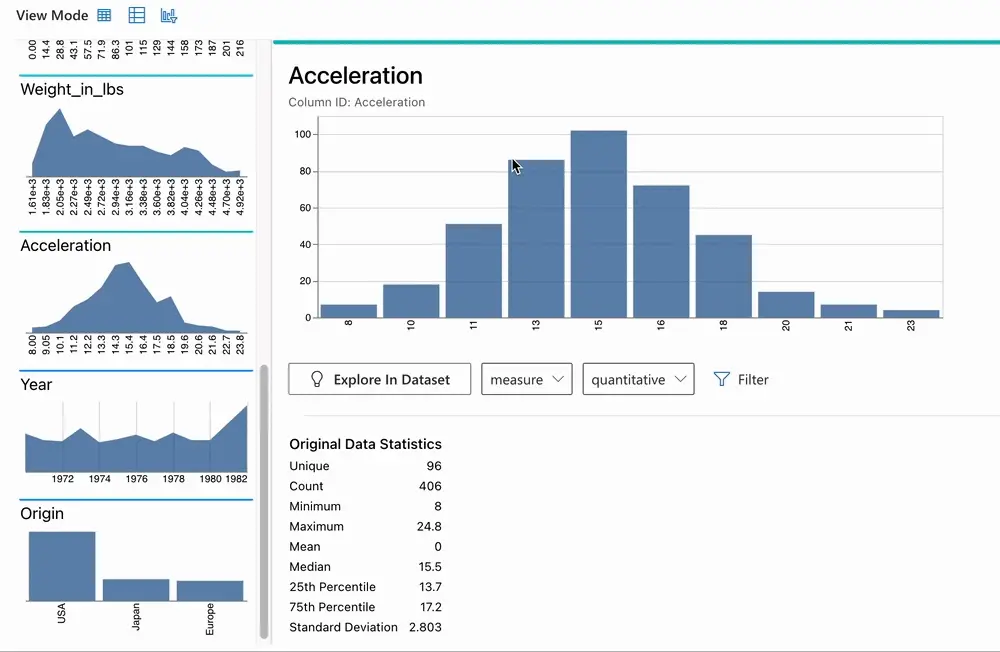
You can also access key statistics such as mean, median, and standard deviation for each field in your dataset. It also provides visualizations such as histograms and box plots to help you understand the distribution of your data.
Data Visualization
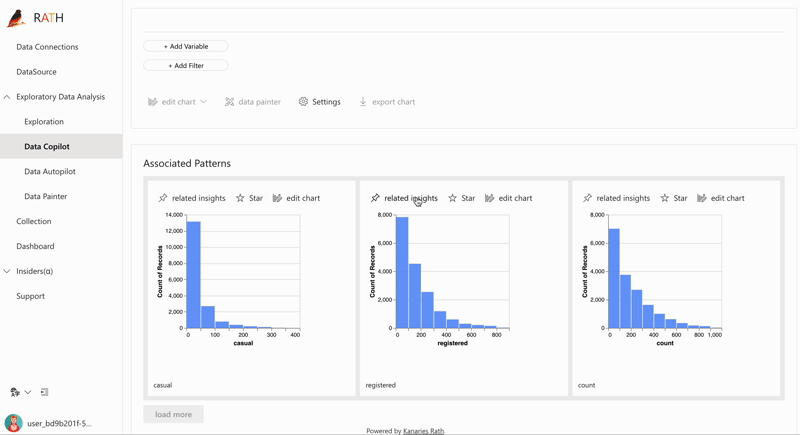
After cleaning and preparing your data, RATH's powerful visualization engine allows you to easily explore and understand your data. With RATH, you can create a variety of visualizations including bar charts, line charts, scatter plots, and heat maps.
RATH also offers advanced visualization features such as auto-generated visualization, which automatically creates an appropriate visualization based on the data and insights. This makes it easy for you to quickly understand your data without the need for extensive data visualization expertise.
Augmented Analytics
RATH's augmented analytics engine takes the complexity out of data analysis by providing a user-friendly interface and powerful algorithms that streamline the process.
With RATH, even those without extensive coding knowledge can easily apply machine learning models and perform complex tasks such as forecasting and anomaly detection. Whether you're an experienced data scientist or new to the field, RATH makes data analysis simple, efficient, and effective.
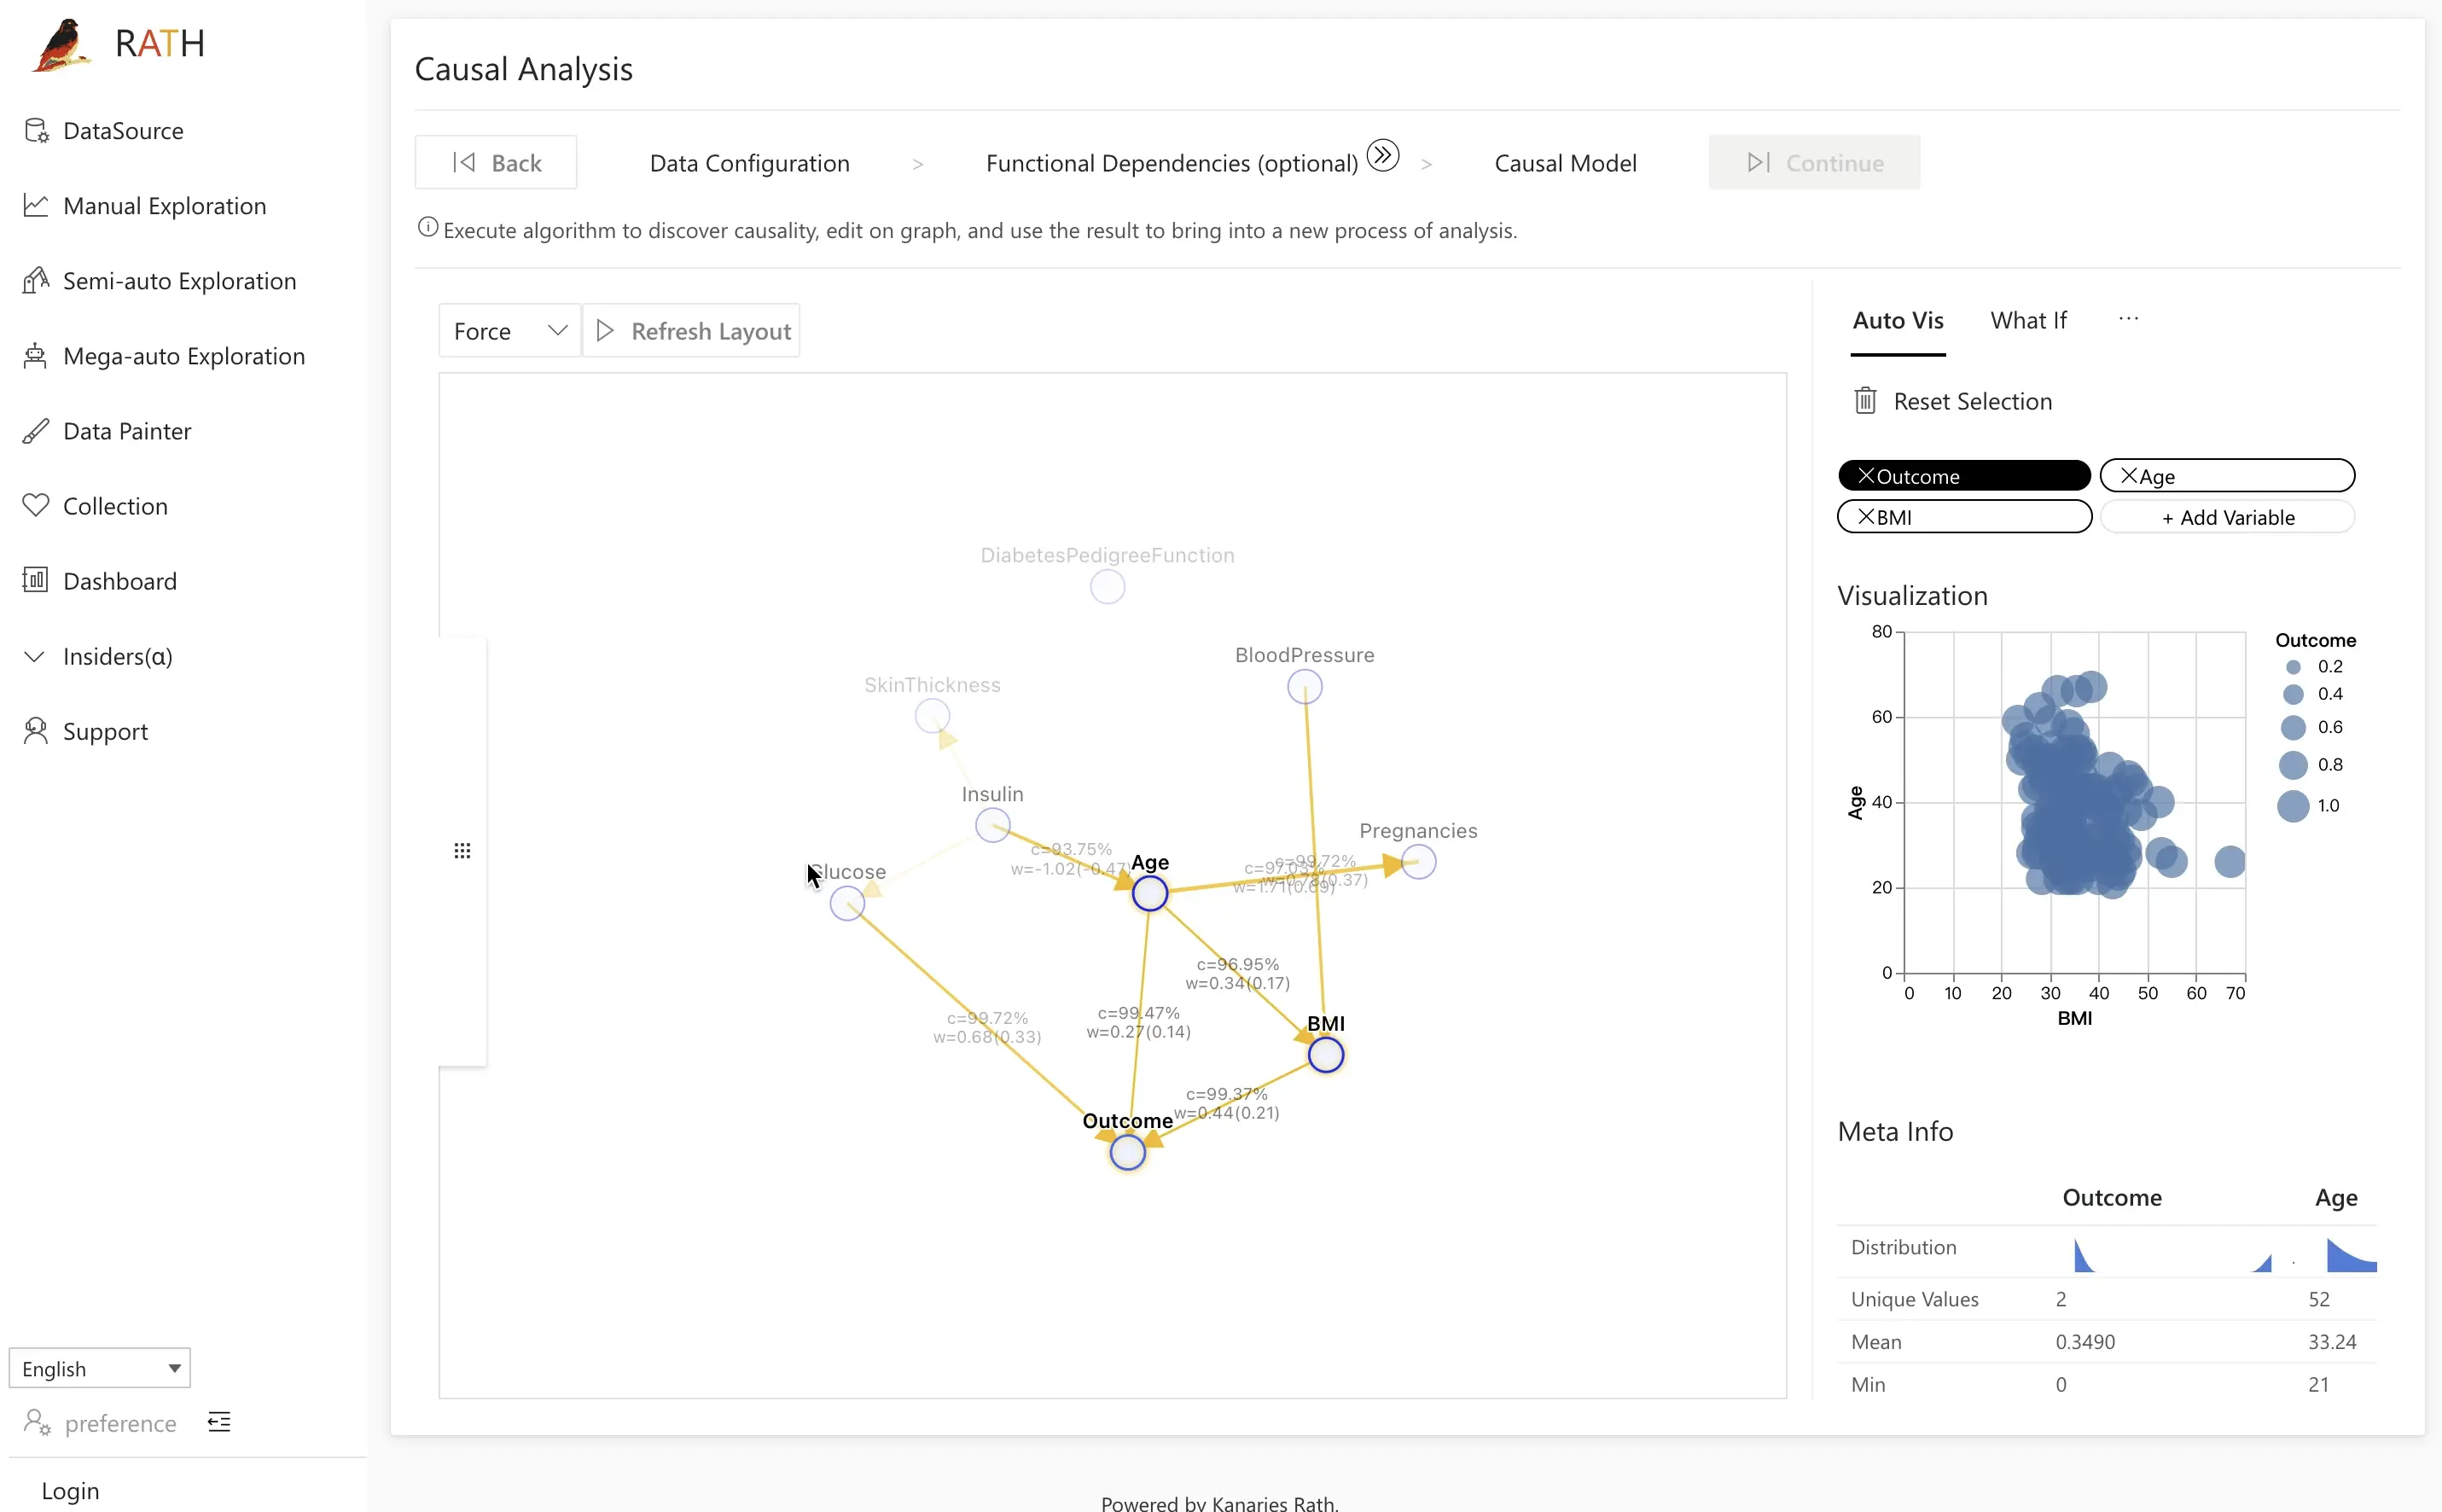
Casual Analysis
In addition to its ease of use, RATH also provides powerful capabilities such as forecasting, anomaly detection, and causal analysis. Its user-friendly interface and powerful algorithms make it a valuable tool for both experienced data scientists and those new to the field.
In addition, RATH's engine offers key features like the "Data painter", "Dashboard" and "Causal Analysis" that provide multiple ways to explore and understand your data, making it a comprehensive tool for Exploratory Data Analysis."
Open Source
RATH (opens in a new tab) is Open Source. Visit RATH GitHub and experience the next-generation Auto-EDA tool. You can also check out the RATH Online Demo as your Data Analysis Playground!
Conclusion
Overall, RATH is a powerful tool for Exploratory Data Analysis, offering a wide range of features and capabilities that go beyond what is possible with Pandas Profiling. Whether you are a data scientist, analyst, or business professional, RATH is a valuable tool for understanding and making sense of your data.