How to Read CSV Files into a Dataframe with Python's Pandas Library, PySpark, R and PyGWalker

CSV files are a popular way to store and share tabular data. In this comprehensive guide, we will explore how to read CSV files into dataframes using Python's Pandas library, PySpark, R, and the PyGWalker GUI. We will cover various scenarios, such as custom delimiters, skipping rows and headers, handling missing data, setting custom column names, and converting data types. Boost your data manipulation skills and make your data analysis more efficient with these powerful tools.
- Runcell Science: An Open Source Alternative to Claude Science for Research Workflows
- How to Make Mac Not Sleep: Keep Codex, Claude Code, and AI Agents Running
- OpenClaw vs ZeroClaw vs Pi Agent vs Nanobot: Which AI Agent Stack Should You Choose in 2026?
- Can Claude Code Analyze Jupyter Notebooks for Data Science? What It Actually Does
- Claude Code Routines: Why AI Agent Cron Jobs Matter
- Claude Code Desktop Bypass Permissions: How to Enable It
- How to Build Two Python Agents with Google’s A2A Protocol - Step by Step Tutorial
- Top 10 growing data visualization libraries in Python in 2025
Reading CSV Files in Pandas
Pandas is a popular Python library used for data manipulation and analysis. It provides data structures for efficiently storing and manipulating large datasets. The read_csv() function in Pandas can be used to read CSV files into a dataframe. Here's an example:
import pandas as pd

df = pd.read_csv('sample.csv')
print(df)
In this example, we are reading a CSV file named 'sample.csv' into a dataframe using the read_csv() function. The resulting dataframe is then printed using the print() function.
Specifying Custom Delimiters in Pandas
By default, Pandas assumes that the values in a CSV file are separated by commas. However, this may not always be the case. We can specify a custom delimiter using the delimiter parameter:
df = pd.read_csv('sample.csv', delimiter=';')
print(df)
Here, we have specified that the delimiter in the CSV file is ';'.
Skipping Rows and Headers in Pandas
Sometimes, we may want to skip certain rows or headers when reading a CSV file. We can do this using the skiprows and header parameters:
df = pd.read_csv('sample.csv', skiprows=2, header=None)
print(df)
Here, we are skipping the first two rows of the CSV file and not using the first row as the column names.
Handling Missing Data in Pandas
CSV files may have missing data, which can cause problems when reading them into a dataframe. By default, Pandas will replace missing data with NaN values. We can specify a custom value to replace missing data using the na_values parameter:
df = pd.read_csv('sample.csv', na_values=['n/a', 'NaN'])
print(df)
Here, we have specified that the values 'n/a' and 'NaN' should be treated as missing data.
Setting Custom Column Names in Pandas
By default, Pandas will use the first row of the CSV file as the column names. We can specify custom column names using the names parameter:
df = pd.read_csv('sample.csv', names=['Name', 'Age', 'Gender'])
print(df)
Here, we have specified that the column names should be 'Name', 'Age', and 'Gender'.
Converting Data Types in Pandas
Sometimes, we may want to convert the data type of a column. For example, we may want to convert a string column to an integer or float column. We can do this using the dtype parameter:
df = pd.read_csv('sample.csv', dtype={'Age': int})
print(df.dtypes)
Here, we have specified that the 'Age' column should be converted to an integer data type.
Reading Text Files into a Dataframe in Pandas
In addition to CSV files, Pandas can also read text files into a dataframe. Here's an example:
df = pd.read_csv('sample.txt', delimiter='\t')
print(df)
In this example, we are reading a text file named 'sample.txt' into a dataframe. We have specified that the delimiter in the text file is a tab.
CSV to Datafram in PySpark
Reading CSV Files to Dataframe in PySpark
In PySpark, you can use the read() method of the SparkSession object to read CSV files and create a dataframe. The read() method provides options to configure the CSV reader, such as specifying the delimiter, header, and schema.
Here's an example of how to read a CSV file into a dataframe in PySpark:
from pyspark.sql import SparkSession

spark = SparkSession.builder.appName("CSV Reader").getOrCreate()

df = spark.read.format("csv").option("header", "true").option("inferSchema", "true").load("/path/to/csv/file.csv")

df.show()
In this example, we are creating a SparkSession object and using the read() method with the CSV format option. We also specify that the first row of the CSV file contains the header and that the schema should be inferred from the data. Finally, we specify the path to the CSV file and load it into a dataframe. The resulting dataframe is then printed using the show() method.
Reading Multiple CSV Files into One Dataframe in PySpark
PySpark is a powerful big data processing framework that provides an easy way to read multiple CSV files into a single dataframe. This can be achieved using the SparkSession object's read() method and specifying a wildcard character (*) in the path to the CSV files. Here's an example:
from pyspark.sql import SparkSession

spark = SparkSession.builder.appName("CSV Reader").getOrCreate()

df = spark.read.format('csv').option('header', 'true').option('inferSchema', 'true').load('/path/to/csv/files/*')

df.show()
In this example, we are creating a SparkSession object and reading all CSV files located in the specified directory using the load() method with a wildcard character. The resulting dataframe is then printed using the show() method.
CSV to Dataframe in R
Reading CSV Files into a Dataframe in R
In addition to Python's Pandas library, R also has a built-in function for reading CSV files into a dataframe. The read.csv() function can be used for this purpose. Here's an example:
df <- read.csv('sample.csv')
print(df)
In this example, we are reading a CSV file named 'sample.csv' into a dataframe using the read.csv() function. The resulting dataframe is then printed using the print() function.
Converting CSV Files to Dataframes in R
In R, we can also convert a CSV file to a dataframe using the as.data.frame() function. Here's an example:
df <- as.data.frame(read.csv('sample.csv'))
print(df)
In this example, we are reading a CSV file named 'sample.csv' using the read.csv() function and then converting it to a dataframe using the as.data.frame() function. The resulting dataframe is then printed using the print() function.
CSV to Data Visualization in PyGWalker
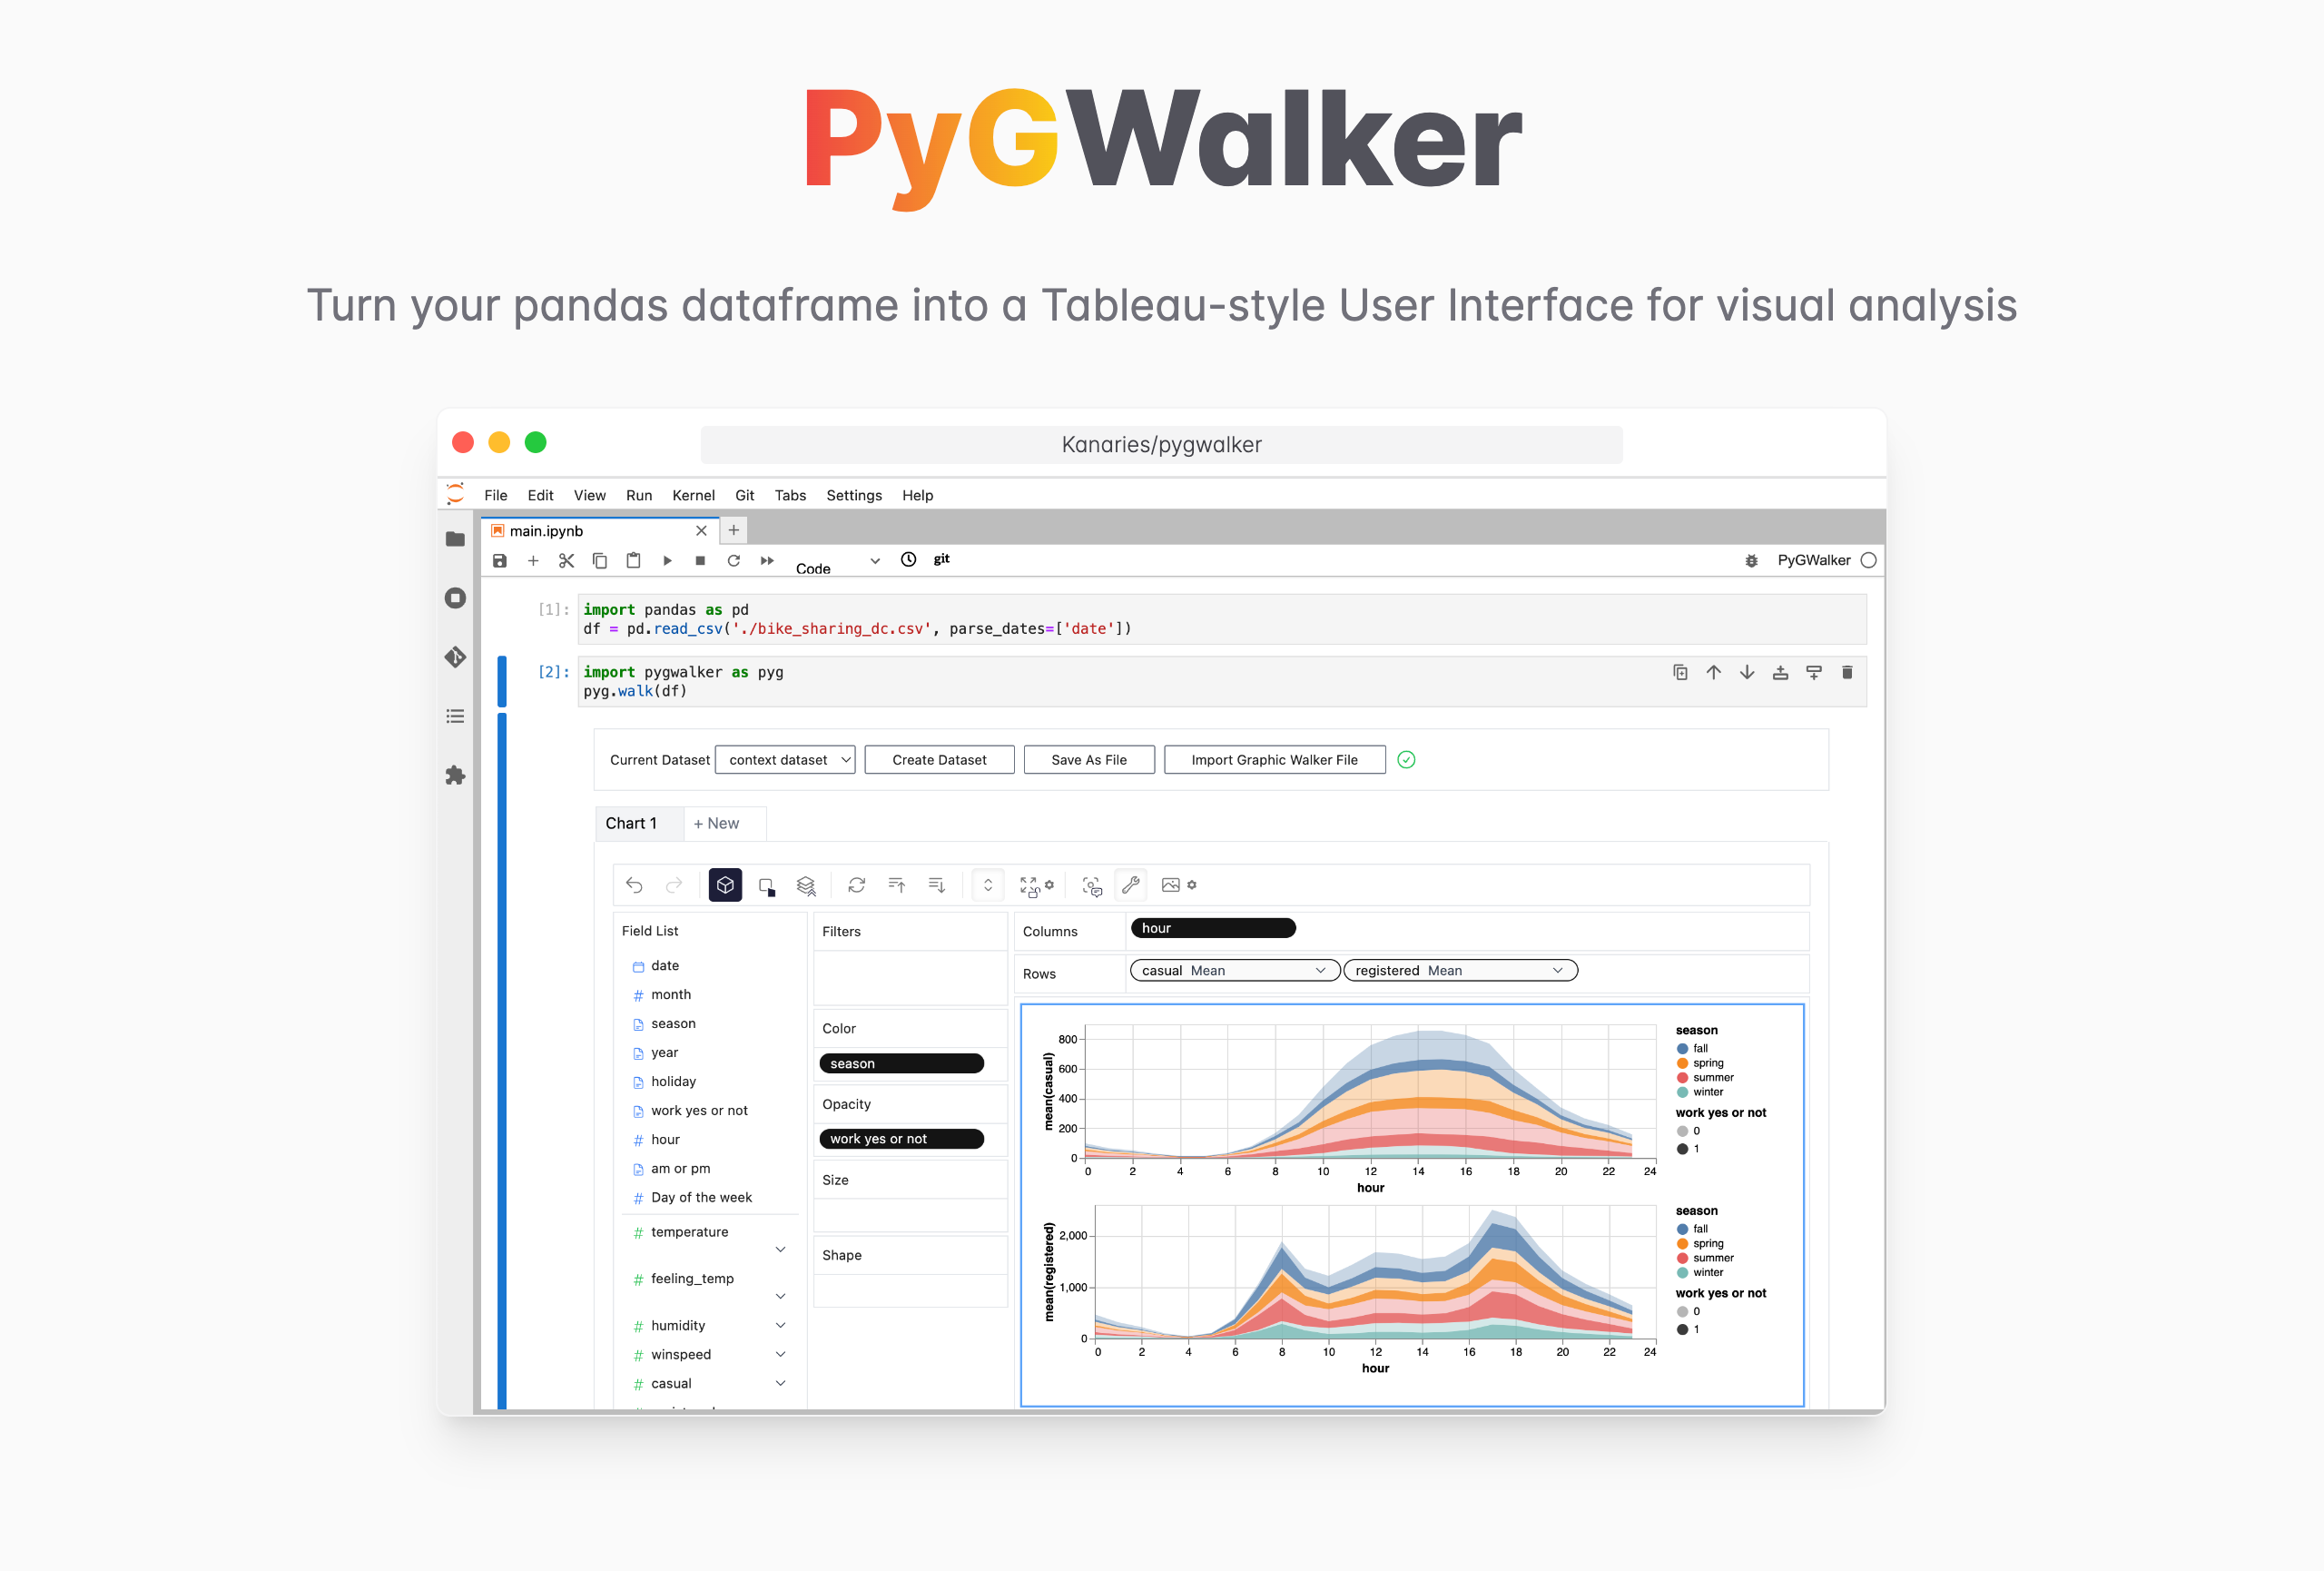
PyGWalker (opens in a new tab) can simplify your data analysis and data visualization workflow, by turning your pandas dataframe (and polars dataframe) into a tableau-alternative User Interface for visual exploration. It integrates Jupyter Notebook (or other jupyter-based notebooks) with Graphic Walker, a different type of open-source alternative to Tableau. It allows data scientists to analyze data and visualize patterns with simple drag-and-drop operations.
PyGWalker is Open Source. Don't forget to check out PyGWalker GitHub (opens in a new tab) and leave a ⭐️!
Reading CSV Files into a Dataframe
We'll be running PyGWalker in Jupyter Notebook in this example. You can also run PyGWalker online, simply visiting Binder (opens in a new tab), Google Colab (opens in a new tab) or Kaggle Code (opens in a new tab).
| Run in Kaggle (opens in a new tab) | Run in Colab (opens in a new tab) |
|---|---|
 (opens in a new tab) (opens in a new tab) |  (opens in a new tab) (opens in a new tab) |
In your Python environment, run the following code to import a "bike_sharing_dc.csv" CSV file to Pandas.
import pandas as pd
import PyGWalker as pyg
df = pd.read_csv('./bike_sharing_dc.csv', parse_dates=['date'])
If you prefer using Polars, use the follwoing code to import CSV to a pandas dataframe:
import polars as pl
df = pl.read_csv('./bike_sharing_dc.csv',try_parse_dates = True)
Turn CSV into Data Visualizations with PyGWalker
After importing your CSV to a pandas dataframe, you can call up PyGWalker for a tableau-alternative user interface to analyze and visualize data by dragging and dropping variables.
gwalker = pyg.walk(df)
You can create these charts with Graphic Walker with a UI that supports dragging and dropping variables:
Bar Chart 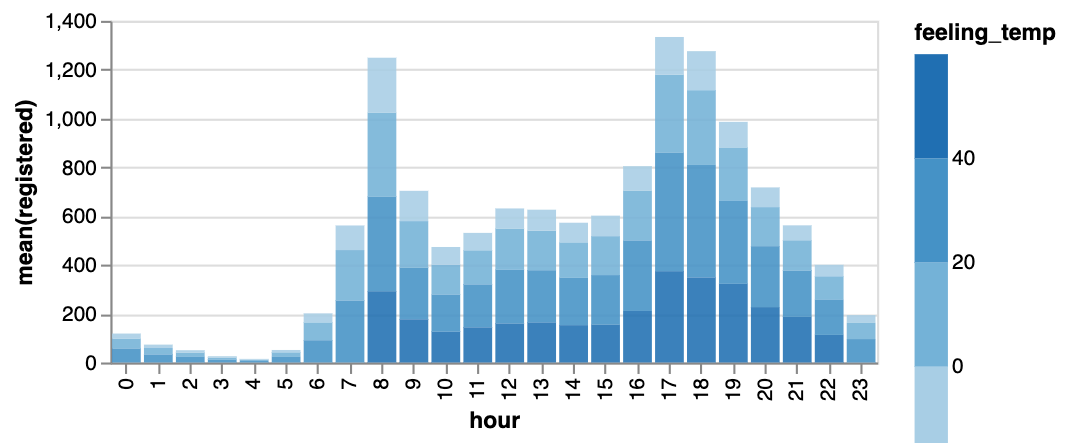 | Line Chart 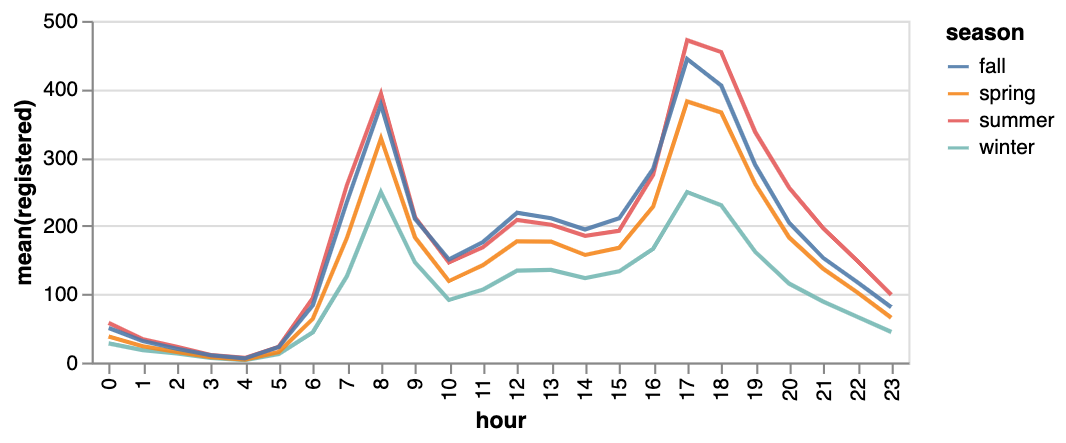 | Area Chart  |
|---|---|---|
Trail 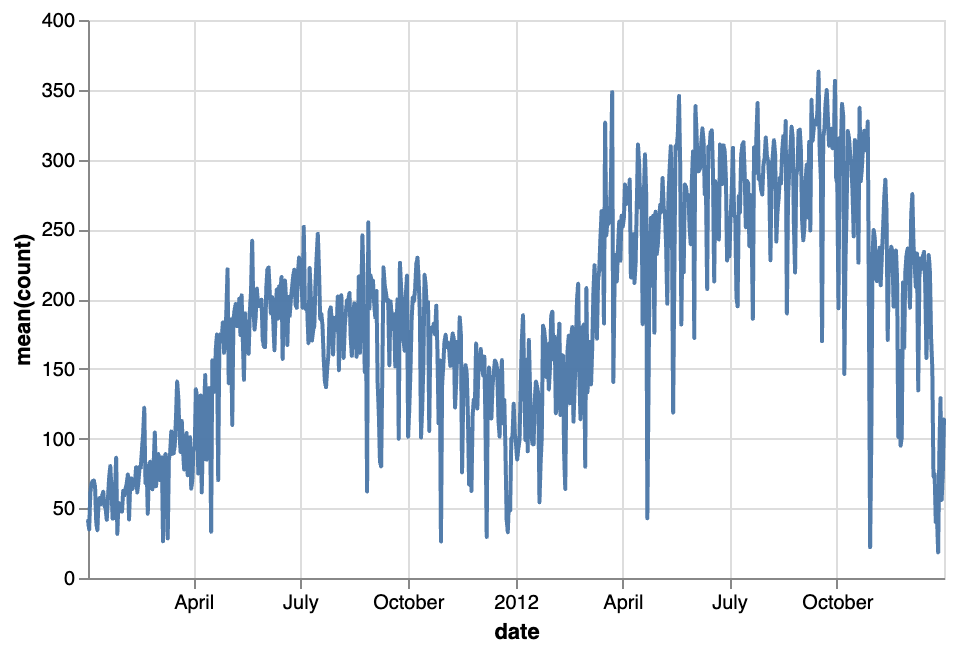 | Scatter Plot  | Cirlce 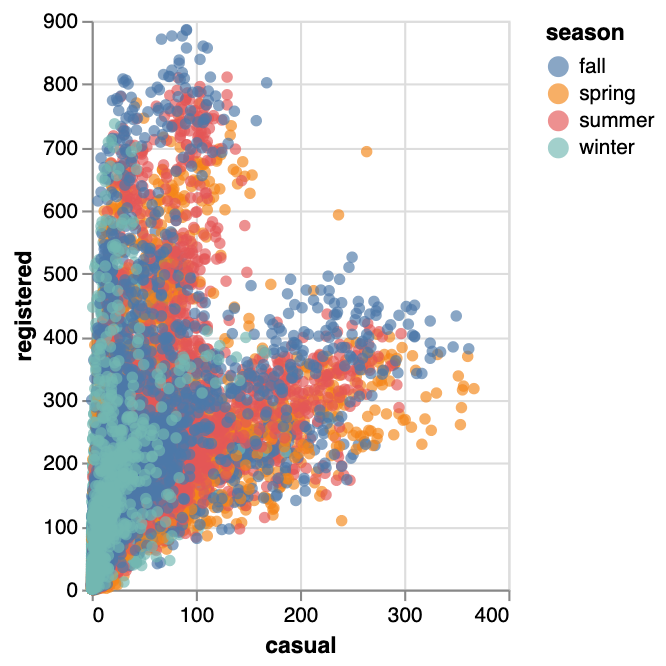 |
Tick Plot 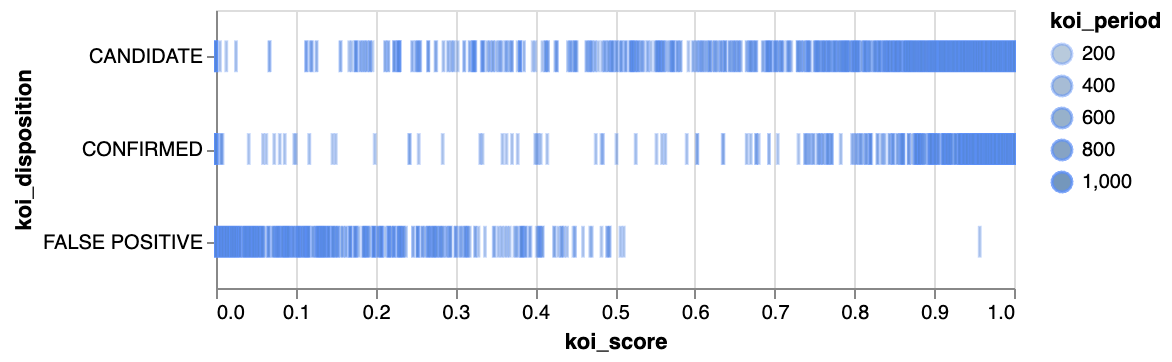 | Rectangle  | Arc Diagram  |
Box Plot  | Heatmap  |
You can explore our Data Visualization Gallery for more Examples.
Interested? Don't forget to check out PyGWalker GitHub (opens in a new tab) and leave a star!

Conclusion
Reading CSV files into dataframes is a common task in data science and analysis. Python's Pandas library and R both provide functions for this purpose. In this article, we have discussed how to read CSV files into dataframes using Pandas and R, as well as various scenarios such as custom delimiters, skipping rows and headers, handling missing data, setting custom column names, and converting data types.
FAQs
-
What is a CSV file? A: A CSV file is a type of file used for storing tabular data in a plain text format, with each line representing a row and each value separated by a delimiter.
-
What is a dataframe? A: A dataframe is a two-dimensional data structure used for storing and manipulating tabular data in Python and R.
-
How do I read a CSV file into a Pandas dataframe with a custom delimiter? A: You can specify a custom delimiter using the delimiter parameter in the
read_csv()function. For example,df = pd.read_csv('sample.csv', delimiter=';'). -
How do I convert a string column to an integer column in a Pandas dataframe? A: You can use the
dtypeparameter in theread_csv()function to specify the data type of a column. For example,df = pd.read_csv('sample.csv', dtype={'Age': int}). -
How do I skip rows and headers when reading a CSV file into an R dataframe? A: You can use the skip and header parameters in the
read.csv()function to skip rows and headers, respectively. For example,df <- read.csv('sample.csv', skip=2, header=FALSE).