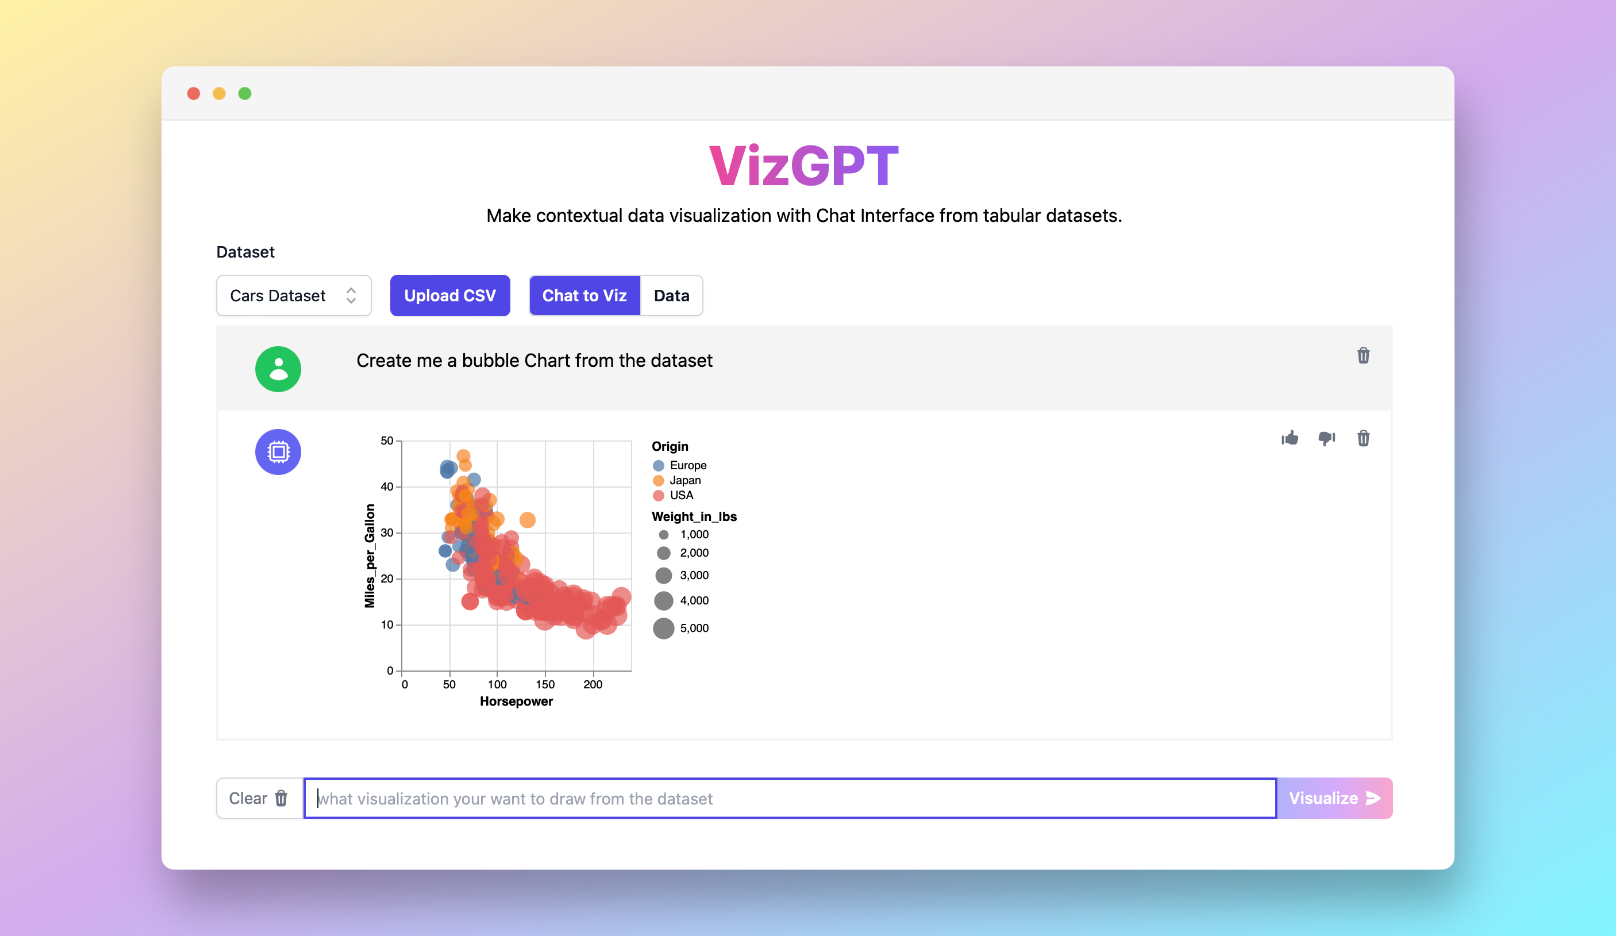
Bubble Chart Maker: Visualize Multidimensional Data with VizGPT
Ready to start creating your own bubble charts with VizGPT? Try this Prompt:
Create a bubble chart from the data set
Want to Upload a Customized CSV File? Upgrade to Kanaries Plus Plan, you can get the full package of apps (opens in a new tab) for handling much more complicated data analysis!
Introducing the Bubble Chart Maker, an innovative part of the VizGPT suite. Our tool lets you create engaging bubble diagrams and bubble plots. Bubble charts are a powerful tool for visualizing three to four dimensions of data on a single chart. With our ChatGPT-powered tool, creating bubble charts becomes straightforward, allowing you to focus on the insights they provide.
Bubble Chart Maker Review
Bubble charts take scatter plots a step further by adding a third dimension, size, which represents an additional variable. They are a powerful tool for displaying three or more dimensions of data in a way that's easy to understand and interpret.
Use a Bubble Chart Maker
With our Bubble Chart Maker, it's simple to draw a bubble plot that encapsulates your data. Upload your data, ask VizGPT to create a bubble chart, and hit visualize. You'll have a clear, informative bubble graph ready to help you explore your data.
Understanding Your Bubble Chart with a Bubble Chart Maker
Bubble charts can seem complex, but with the right approach and understanding, they can be a powerful tool for data visualization. Our tool provides various bubble chart examples and aids you in deciphering your own bubble diagram.
While bubble charts provide a unique way to visualize data, VizGPT also supports a variety of other chart types like bar charts, pie charts, heat maps, and histograms. Feel free to experiment with different visualization techniques to suit your needs.
Bubble Charts: Embracing Multidimensional Data
Visualizing multidimensional data doesn't have to be complicated. With our Bubble Chart Maker, you can create intricate bubble charts that unlock deeper insights into your data. Kickstart your data visualization journey with VizGPT today and see what stories your data can tell.

