Log Walker QuickStart
Log Walker can help you Analysis any of your log data in an interactive visualization interface.
It is currently in beta testing in the Vercel community. Welcome to have a try.
Log Walker is not a static dashboard template for your log data, it is designed to explore datasets which has dynamic/uncertain schema. Usually, visualizing log data requires a lot of pre-config work of data engineer. But with log walker, you can just log your data, pass it to the log walker and you can directly start analysis the data.
How to add log walker to your application in vercel
1. Integration With Vercel
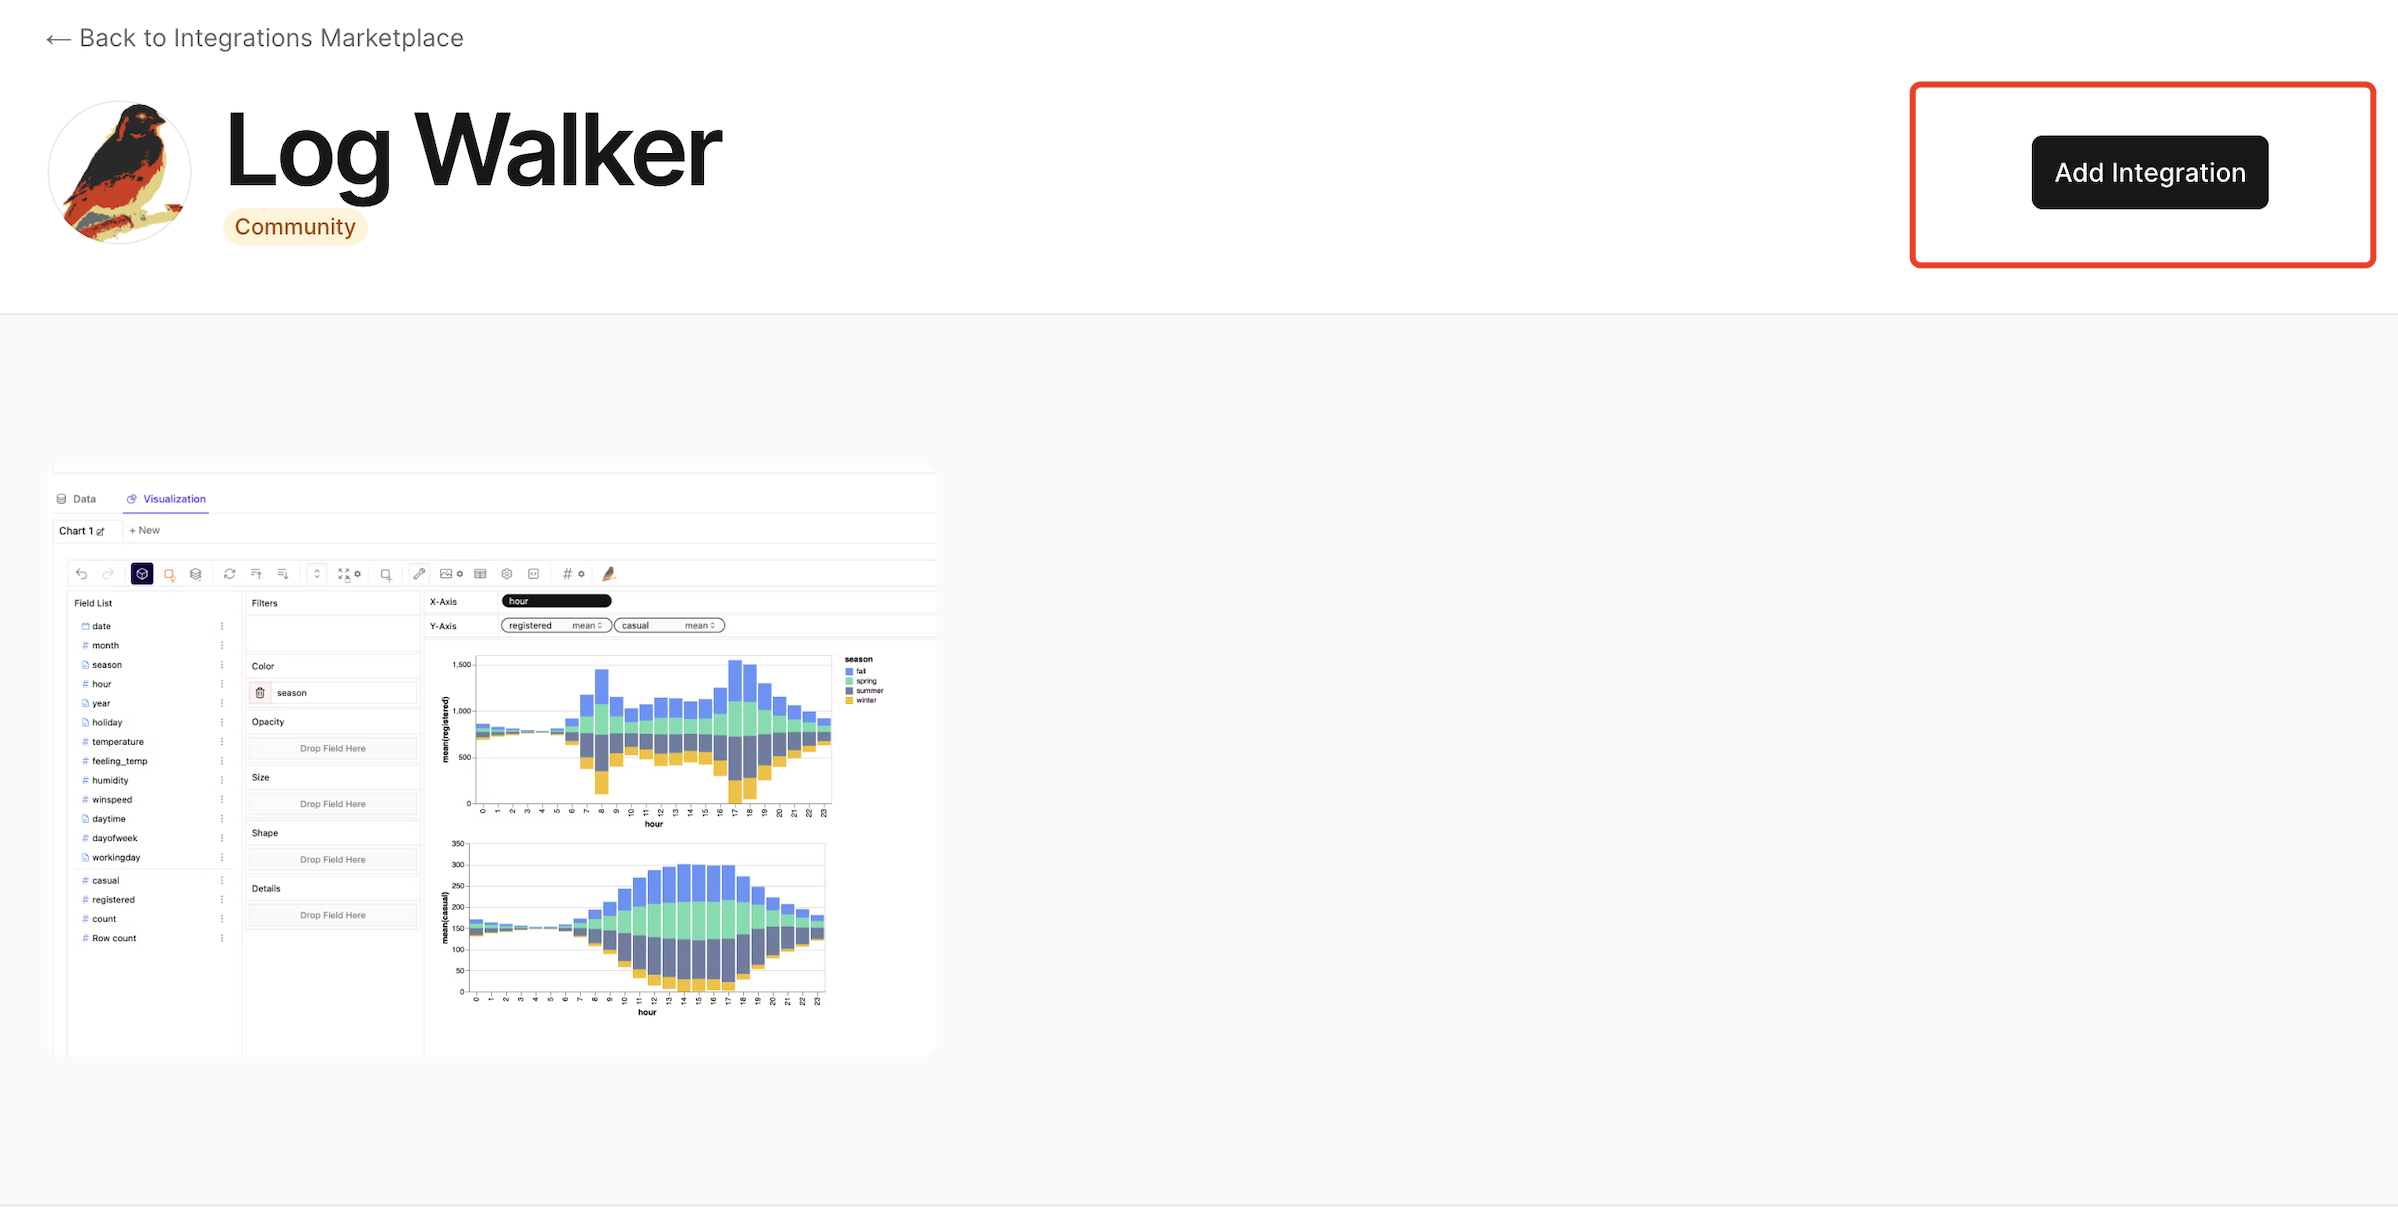
Click :https://vercel.com/integrations/log-walker (opens in a new tab) , Currently released in the Vercel community, it will be integrated into the Vercel Marketplace later.
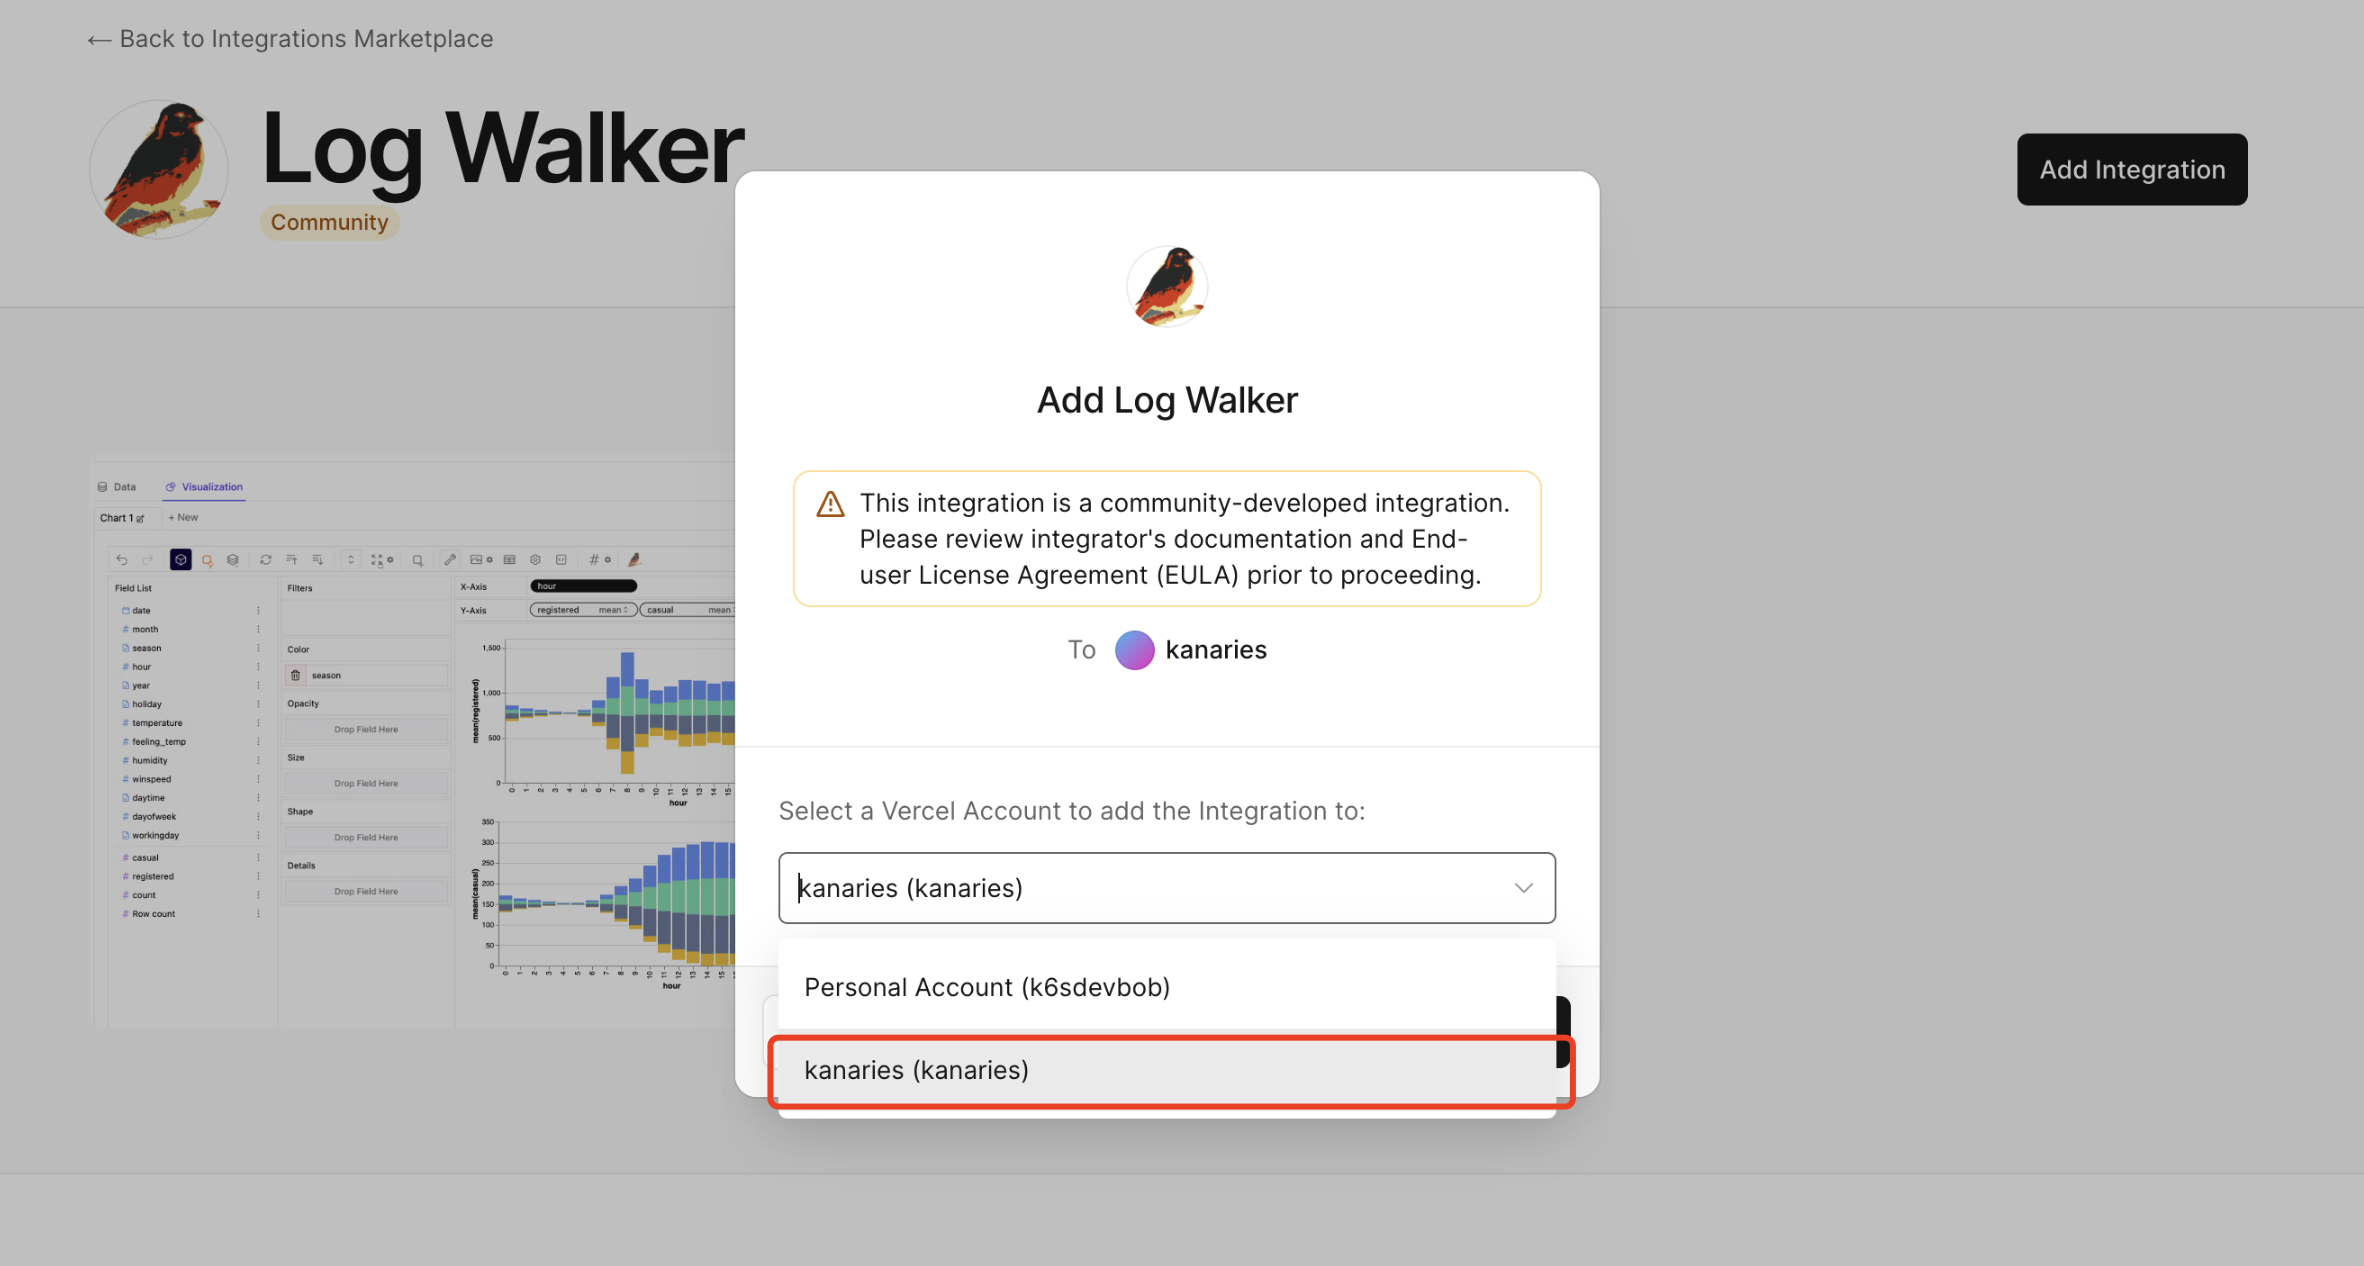
Please select your team organization because Vercel's Log Drain is only available for team accounts.”
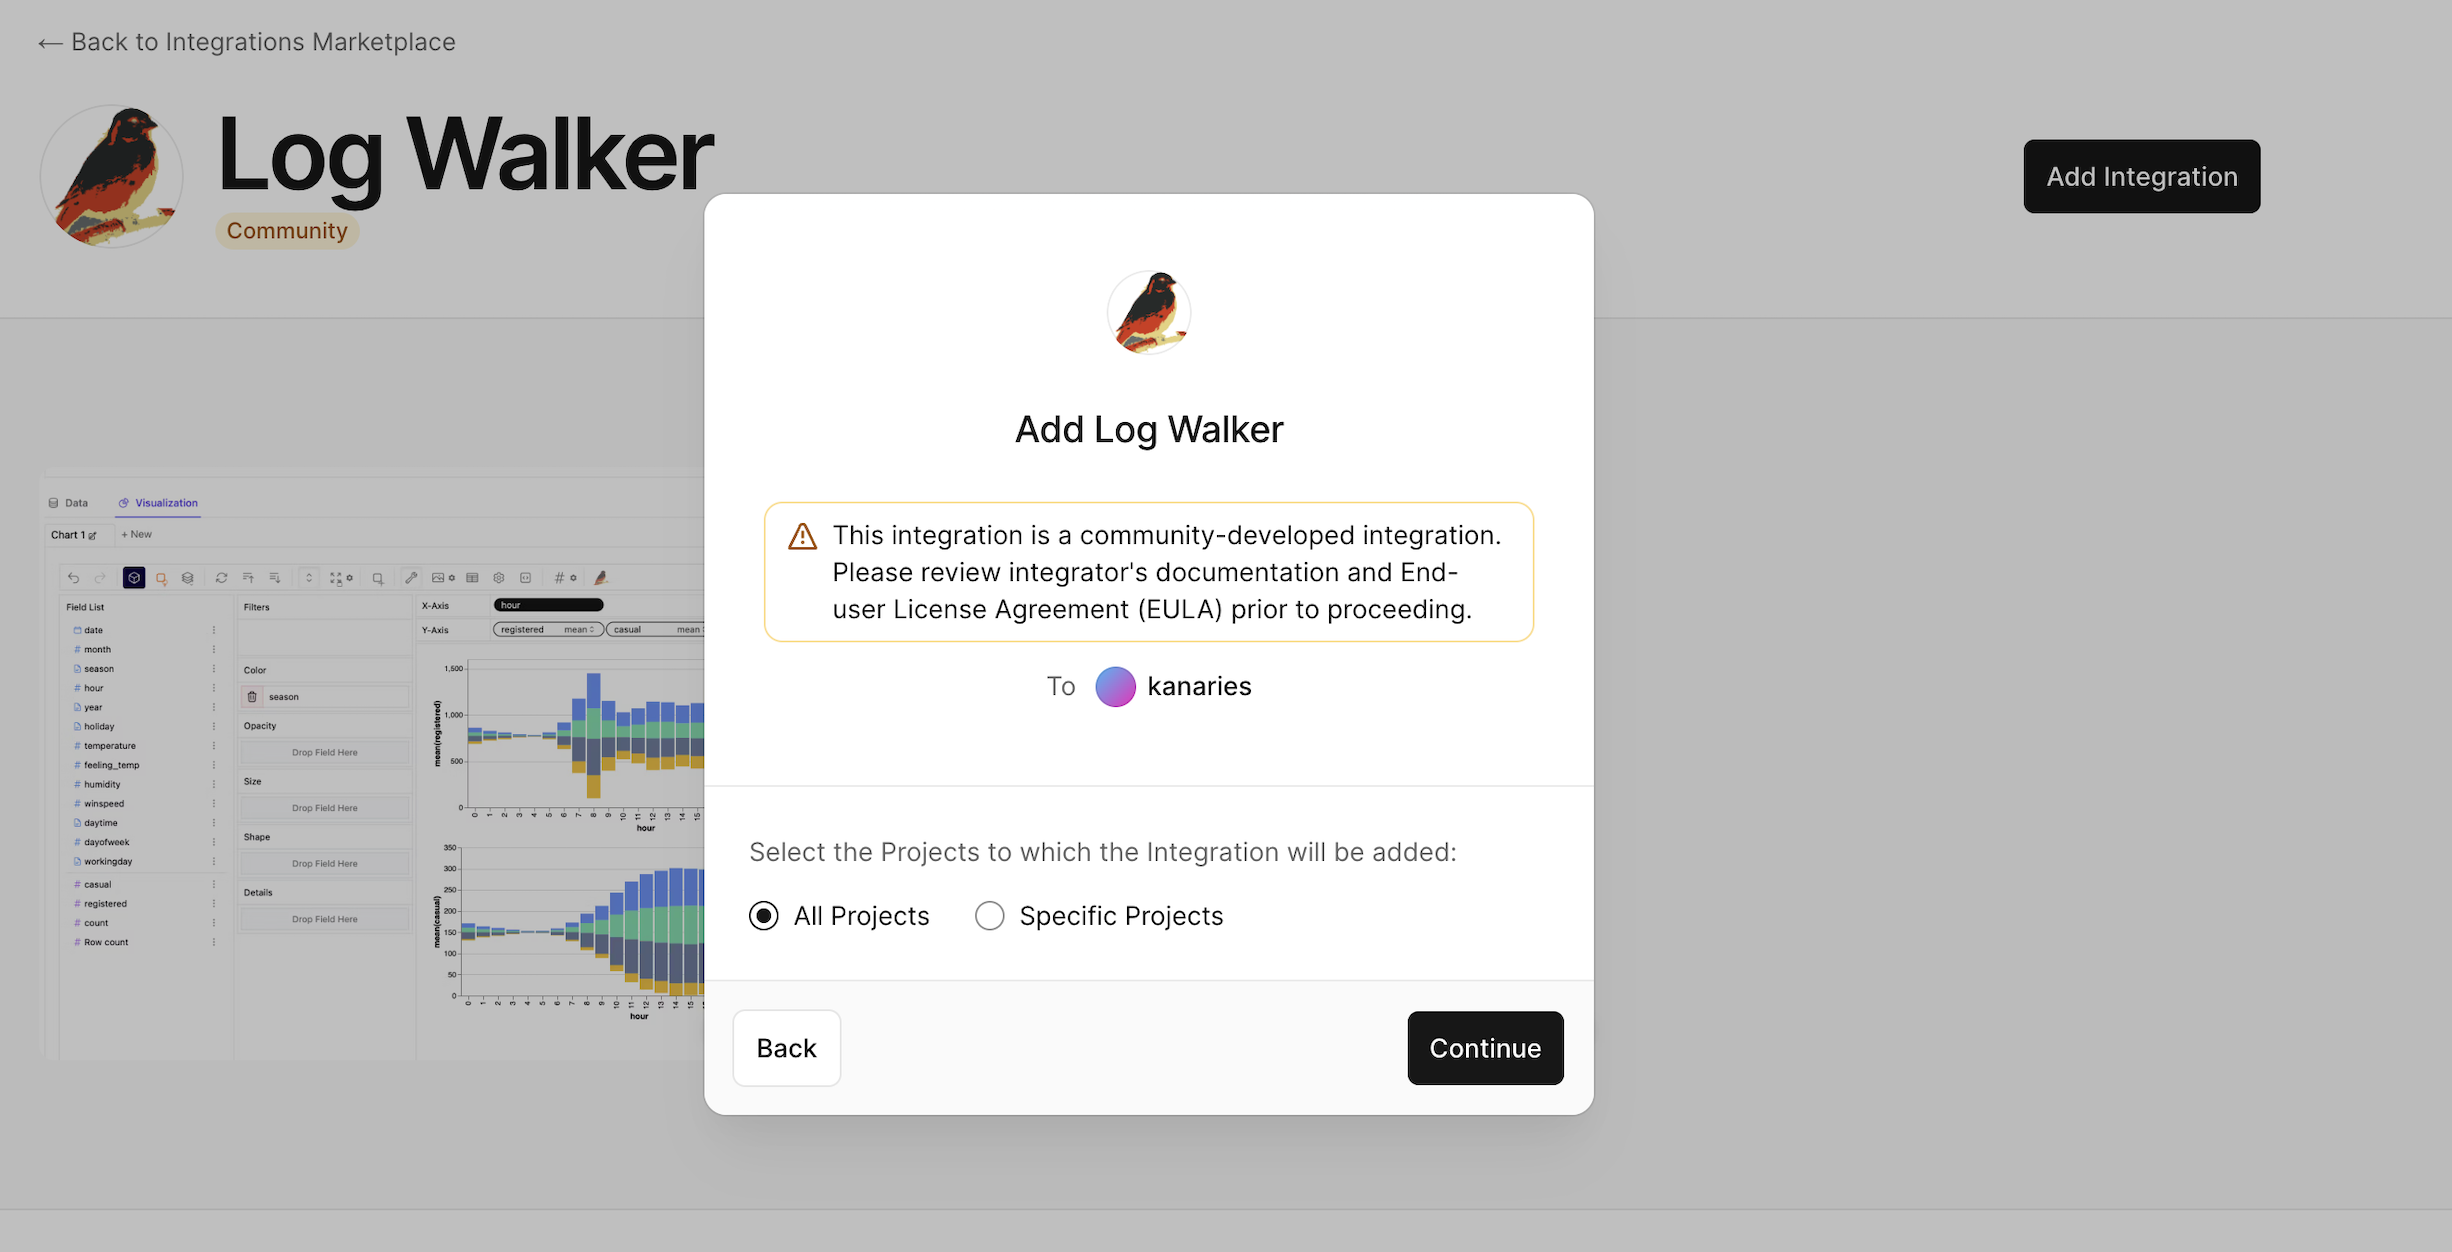
Select the project you want to configure logs for. This will create a Log Drain configuration to sync the log files to Kanaries.
It will redirect to the Kanaries configuration page. If you don't have a Kanaries account, you need to register with your email on the current page. Then you can select an existing Workspace to integrate the plugin.
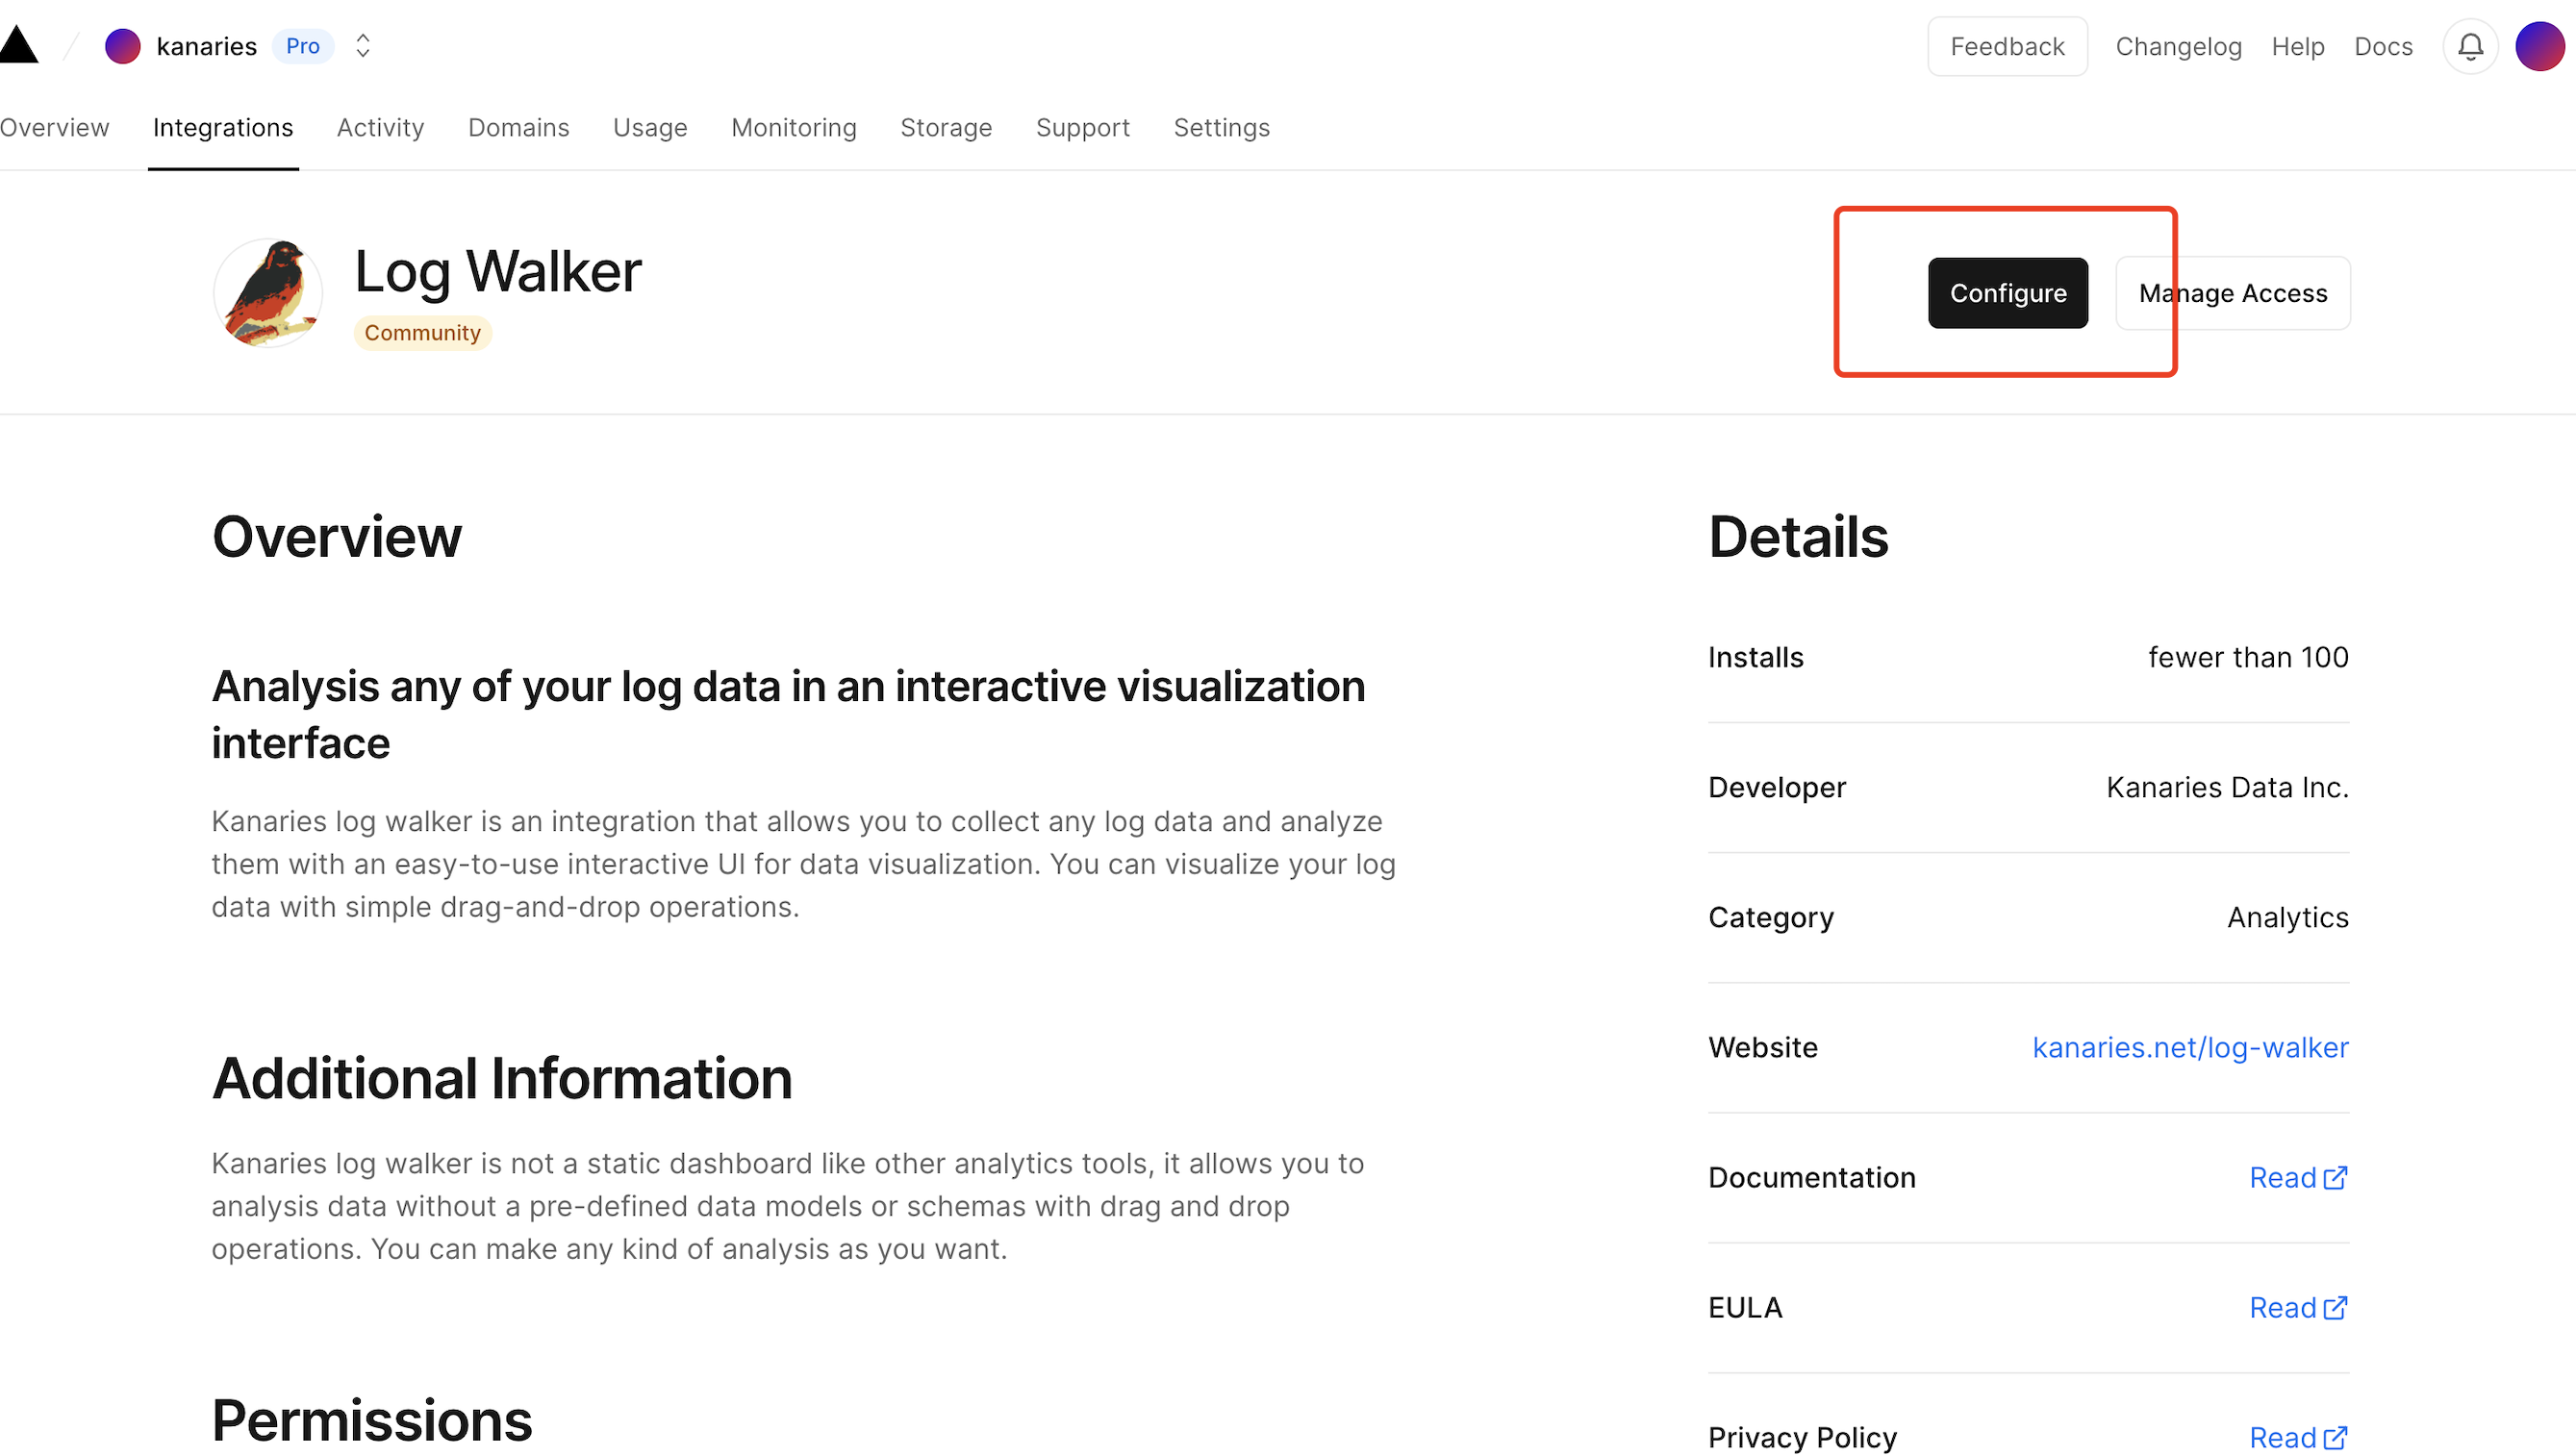
After completing the integration, it will redirect back to the Vercel page. You can directly click the Configure button to start analyzing immediately.
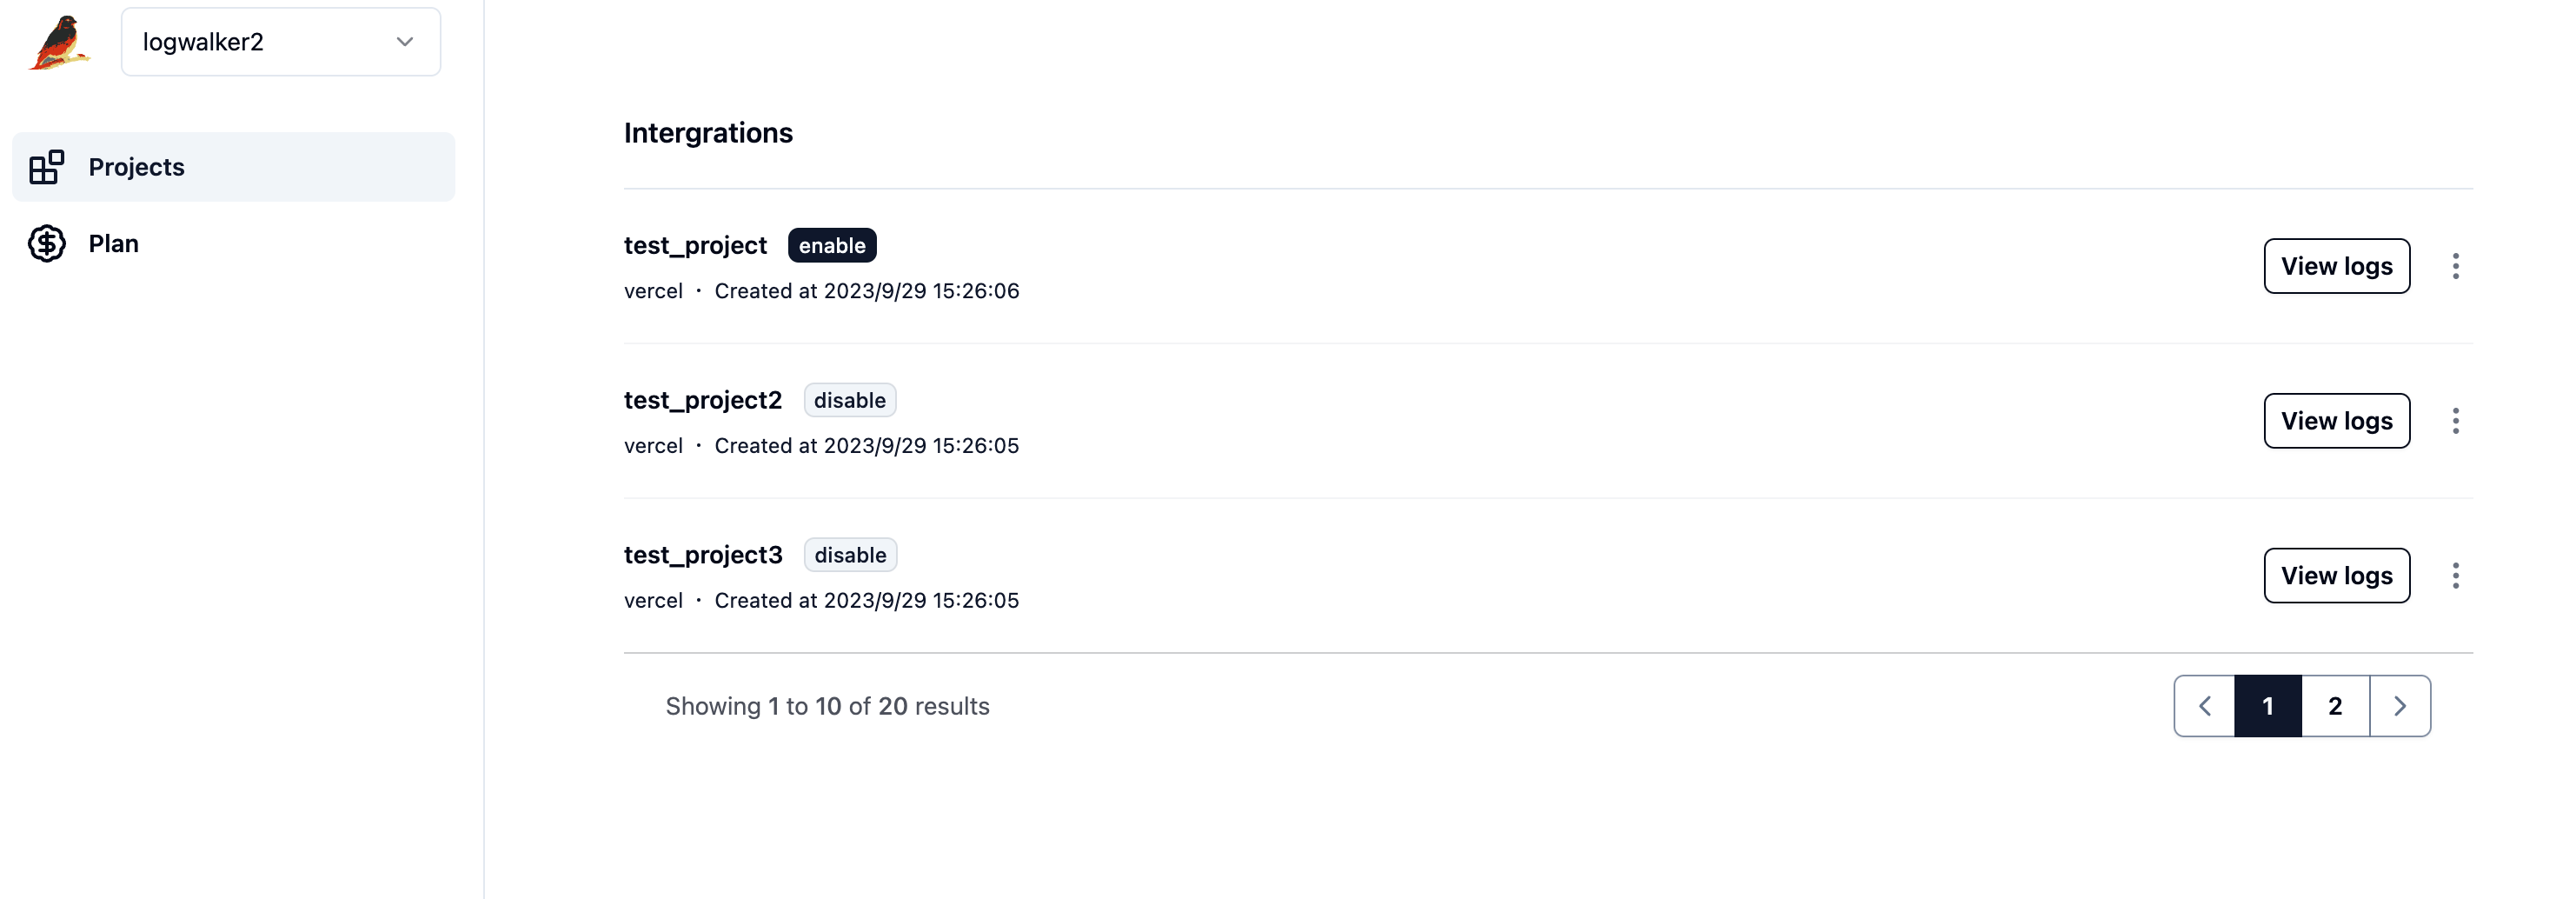
First, select and enable the log source you want to analyze.
- The free plan only allows one log source to be enabled. User logs during disabled periods will not be synced to Kanaries.
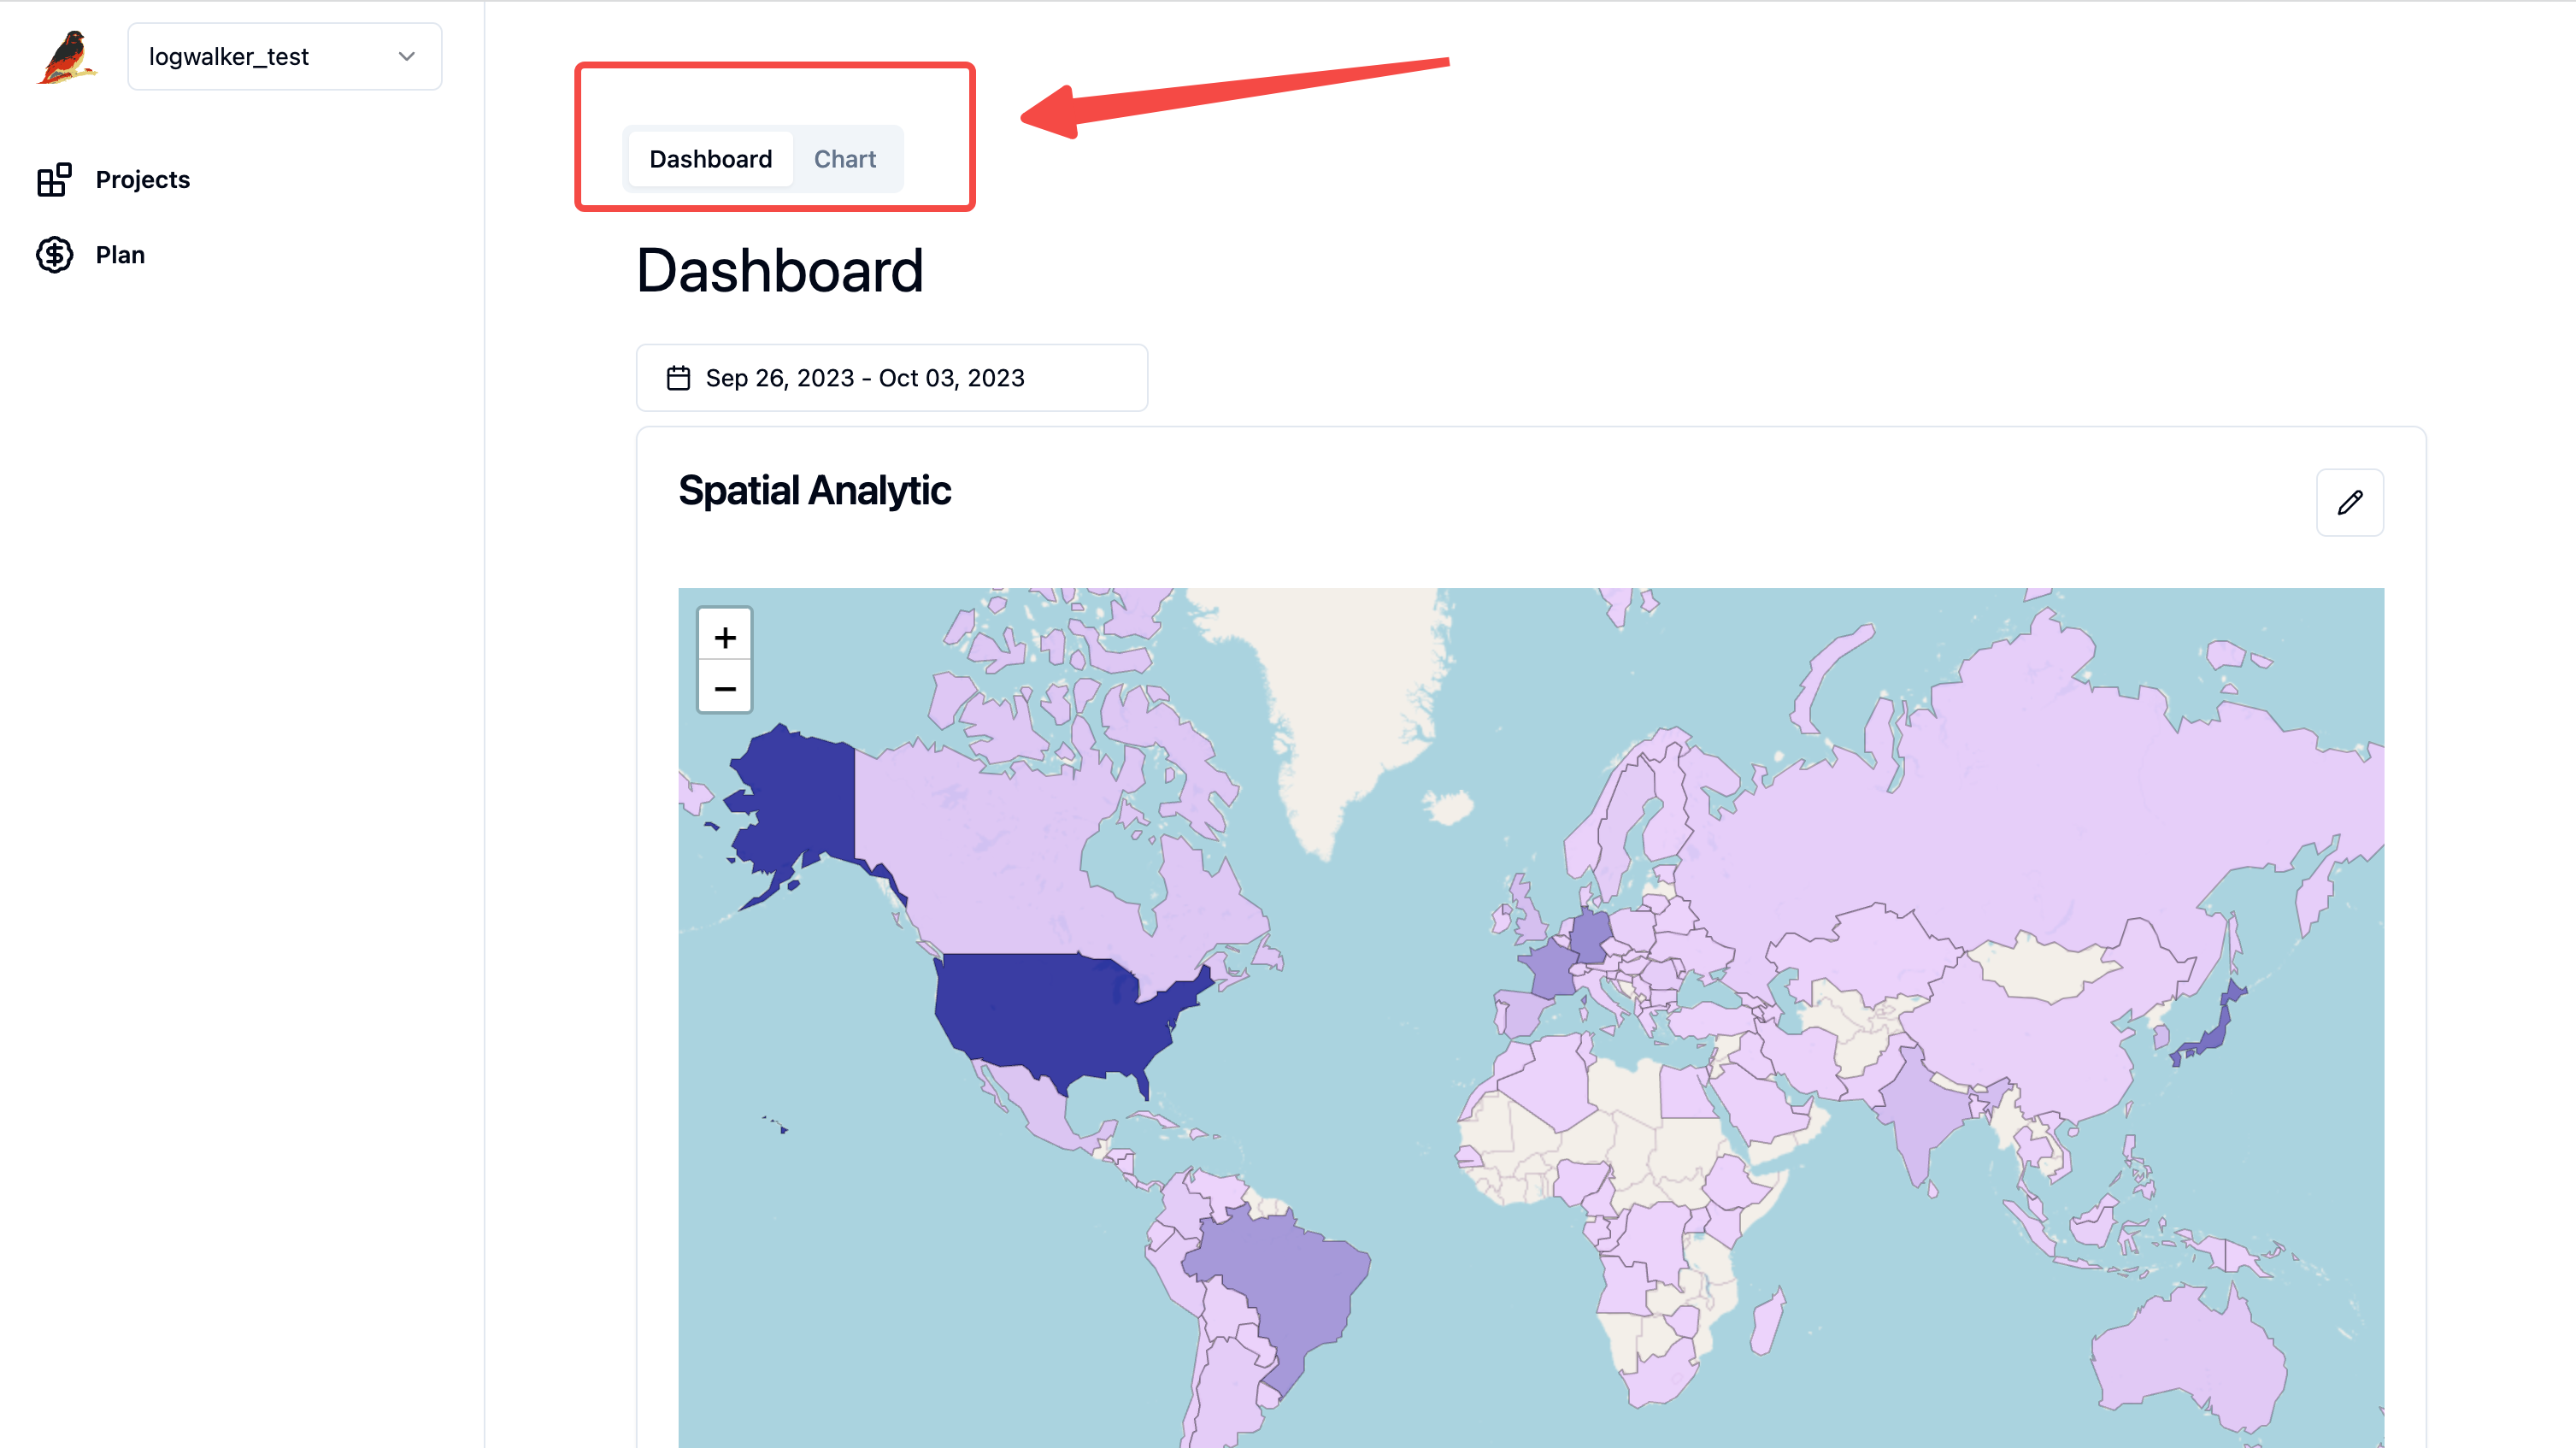
Enter the project enabled, there will be a default dashboard template for analysis. On the top of the page, there is a switch tab, which you can switch between dashboard and chart(customize visual exploration)
- Please wait 3-5 minutes after enabling for logs to start reporting.
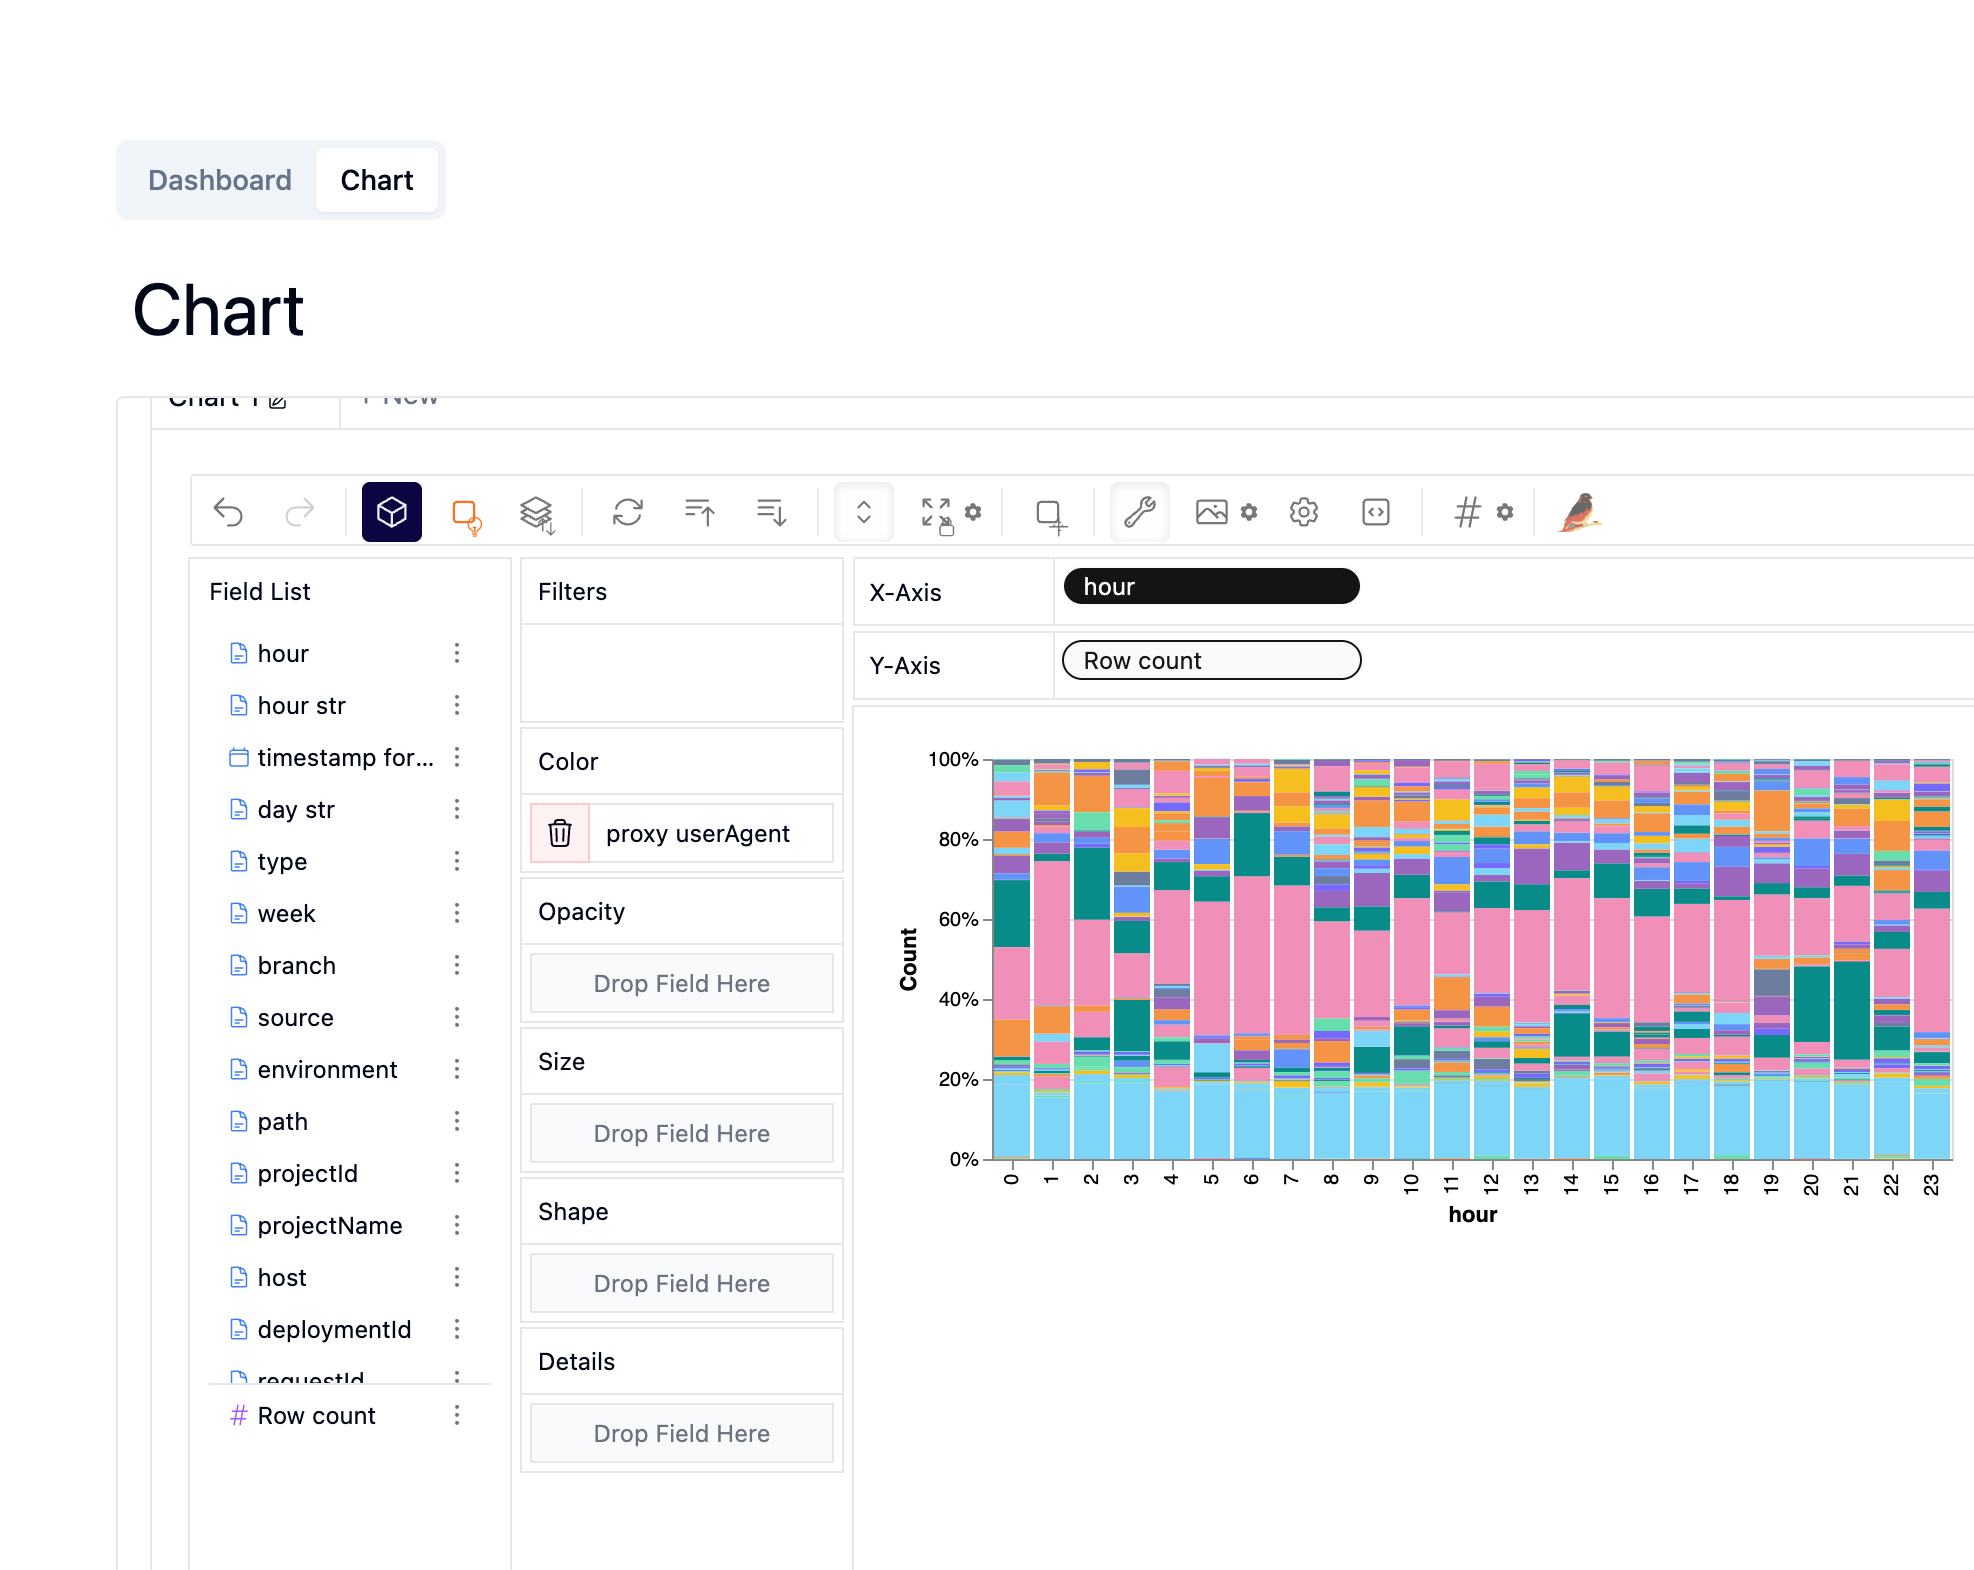
For each chart in the dashboard, there is an edit button on the right top of the chart. It allows users to explore the dataset by themself: adding new dimensions, filters, drilling down, adding metrics, etc. That’s a different feature between log walker and other analysis tools, it is not a static dashboard, but an interactive visual exploration tool that can analysis a dataset with dynamic / unknown schema.