Easily Make a Pie Chart in R
With the advent of data-driven decision-making, visualization tools like pie charts play a crucial role in illustrating the numerical proportion of different categories. The R language, a popular tool among statisticians and data analysts, provides a multitude of functionalities to create comprehensive visualizations including pie charts. This guide will take you through the step-by-step process of creating a pie chart in R.
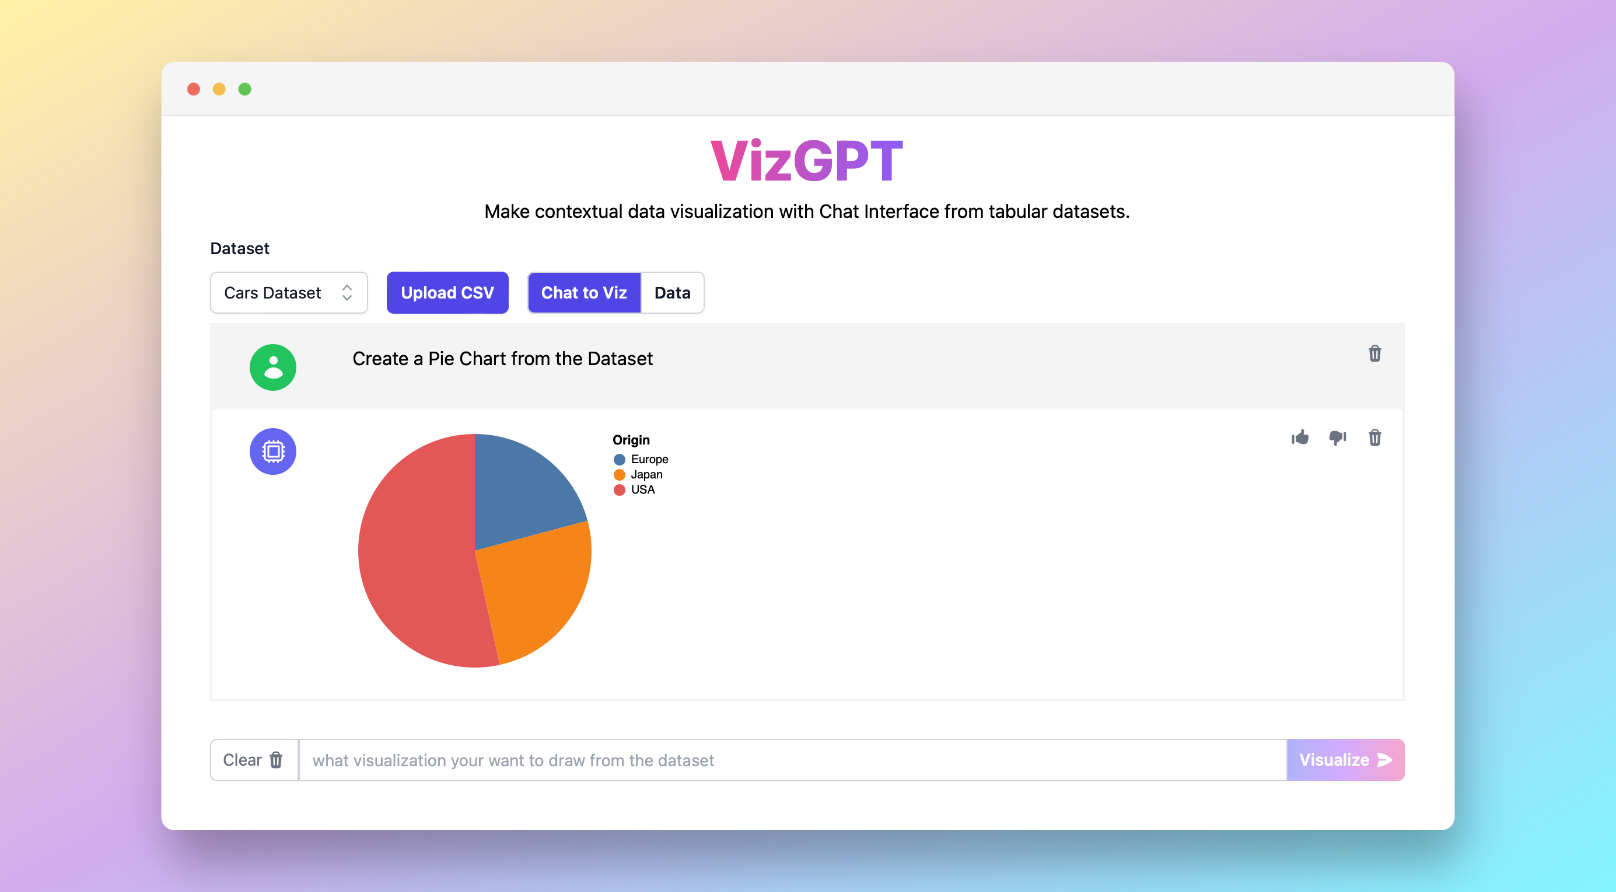
However, before diving into R, let's briefly discuss another incredible tool called RunCell that allows you to easily create all sorts of data visualisations without R programming knowledge:
If you want a quick first draft in RunCell, start with a prompt like this:
Create a Pie Chart from the data
If you want to start from your own CSV instead of the sample data, use RunCell first and export the chart once it looks right.
How to Quickly Make a Pie Chart with RunCell
RunCell is an AI-assisted notebook tool that makes it easier to draft a chart quickly, inspect the result, and keep iterating without leaving Jupyter.
Here's how you can use RunCell:
- Upload your CSV data to RunCell.
- Type a prompt describing the chart you wish to create.
Prompt: Create a Pie Chart about (Variables of your selection)
- Click the Visualize button.
That's it! Your chart is ready.
If you want to keep refining the chart before exporting it, continue working in RunCell (opens in a new tab).
How to Quickly Make a Pie Chart in R
While RunCell offers quick, no-code visualizations, R language, with its extensive set of libraries and in-built functions, delivers an unrivaled level of control and customization over your charts. In this section, we will dive deep into the popular methods of creating pie charts in R, including using the basic pie function, the ggplot2 package, and the plotly package. These strategies will open the door for beginners, intermediates, and even advanced users to harness the power of R in generating insightful visuals.
Using the Basic Pie Function
R's built-in pie() function is a simple, yet effective method to create pie charts. It takes a vector of non-negative numerical quantities, which are summarised in the pie chart.
Let's consider a basic example where we want to visualize the share of different fruits in a basket. Our data is as follows:
fruits <- c("Apples", "Oranges", "Bananas", "Peaches")
counts <- c(10, 15, 7, 8)
In this case, we can create a pie chart using the pie() function as follows:
pie(counts, labels = fruits, main="Fruit Distribution")This code will create a simple pie chart showing the distribution of different fruits. The main parameter sets the title of the chart.
Utilizing the ggplot2 Package
The ggplot2 package is one of the most versatile packages in R for data visualization. It implements the grammar of graphics, a coherent system for describing and building graphs. With ggplot2, pie charts are transformed versions of bar charts, which can be created using the geom_bar function.
Here's an example of how to create a pie chart using the ggplot2 package. We will use the same fruit data as before:
library(ggplot2)

df <- data.frame(fruits, counts)

ggplot(df, aes(x="", y=counts, fill=fruits)) +
  geom_bar(width = 1, stat = "identity") +
  coord_polar("y", start=0) +
  theme_void()
The geom_bar function creates the bar chart, and coord_polar transforms it into a pie chart. The theme_void function removes all non-data ink to make the chart cleaner.
Leveraging the Plotly Package
Finally, we can use the plotly package in R to create interactive pie charts. Plotly charts are interactive: you can hover over the data points, zoom in, and more. It's a powerful tool for making your data analysis more dynamic and engaging.
Let's see how we can create a pie chart using the plotly package. We will stick with the same fruit data:
library(plotly)

df <- data.frame(fruits, counts)

plot_ly(df, labels = ~fruits, values = ~counts, type = 'pie') %>%
  layout(title = 'Fruit Distribution', showlegend = TRUE)
In this code, plot_ly creates the pie chart, and layout sets its title and legend.
These three methods - basic pie(), ggplot2, and plotly - present powerful strategies to generate pie charts in R. Whether you're a beginner looking to dip your toes in R coding, or an experienced analyst seeking to leverage advanced charting libraries, these methods cater to all your needs. Combined with the no-code RunCell tool, these strategies empower you to communicate data insights effectively through compelling visual narratives.
Frequently Asked Questions (FAQs)
-
Can I create a 3D pie chart in R? Yes, R supports the creation of 3D pie charts using the 'plotrix' package.
-
How can I customize the colors in my pie chart? R provides options to customize the colors in a pie chart using the
'cols' parameter in the pie() function.
- What other types of charts can I create in R? R supports a variety of charts including bar charts, histograms, line charts, scatter plots, and many more.
Conclusion
This guide has presented you with different ways to create a pie chart in R, from using the basic pie() function to leveraging powerful packages like ggplot2 and plotly. It also introduced RunCell, a powerful tool for no-code visualization. Whether you prefer coding in R or using no-code tools like RunCell, you now have the knowledge to create effective and informative pie charts.