The Only Guide You Need for Grouping Data by TimeStamps

Struggling with Grouping Data by Time in Pivot Tables and Data Analysis? You're Not Alone!
If you're feeling overwhelmed with grouping data in pivot tables, you're not the only one! Many users face challenges when trying to group data by month or date, especially when dealing with timestamp fields, consecutive date ranges, and complex analytics. In this comprehensive guide, we'll explore various methods and tools to help you group dates in pivot tables, extract date information from timestamps, and analyze your data by week or month.
- Runcell Science: An Open Source Alternative to Claude Science for Research Workflows
- How to Make Mac Not Sleep: Keep Codex, Claude Code, and AI Agents Running
- OpenClaw vs ZeroClaw vs Pi Agent vs Nanobot: Which AI Agent Stack Should You Choose in 2026?
- Can Claude Code Analyze Jupyter Notebooks for Data Science? What It Actually Does
- Claude Code Routines: Why AI Agent Cron Jobs Matter
- Claude Code Desktop Bypass Permissions: How to Enable It
- How to Build Two Python Agents with Google’s A2A Protocol - Step by Step Tutorial
- Top 10 growing data visualization libraries in Python in 2025
Why Group Data by Time?
Before we dive into the details, it's important to understand why grouping data by time is necessary. When dealing with data, you might encounter some common issues such as:
- Dates not grouping in pivot tables despite using data validation for "dates"
- Grouping by date in timestamp fields without creating an extra sheet
- Grouping consecutive dates into date ranges along with their data
- Analyzing sales week by week in each month using pivot tables
- Grouping data by 7 days starting from the current day in MySQL
- Resolving "Cannot group that selection" error in pivot tables
- Dealing with greyed-out "Starting At", "Ending At", and "Number of Days" options in pivot table grouping
By diving into these challenges and their solutions, you'll become proficient in grouping data by date and handling even the most complex data analysis tasks with ease. Keep reading to discover invaluable tips, techniques, and resources to help you conquer date grouping in pivot tables and beyond!
The Easiest Way to Group Data: Use RATH
RATH (opens in a new tab) is an advanced data analysis tool that provides an efficient and user-friendly way to group data by various time periods. Here's a step-by-step guide on how to group data using RATH:
Step 1. Login into the RATH portal. On the Data Connections Tab, Click on the File option and upload your Excel or CSV file.
Step 2. Assuming that you want to group the data by date. Click on the Transforms button to the right of date, RATH can automatically understand your intention and give you the option to Group data by units of time.
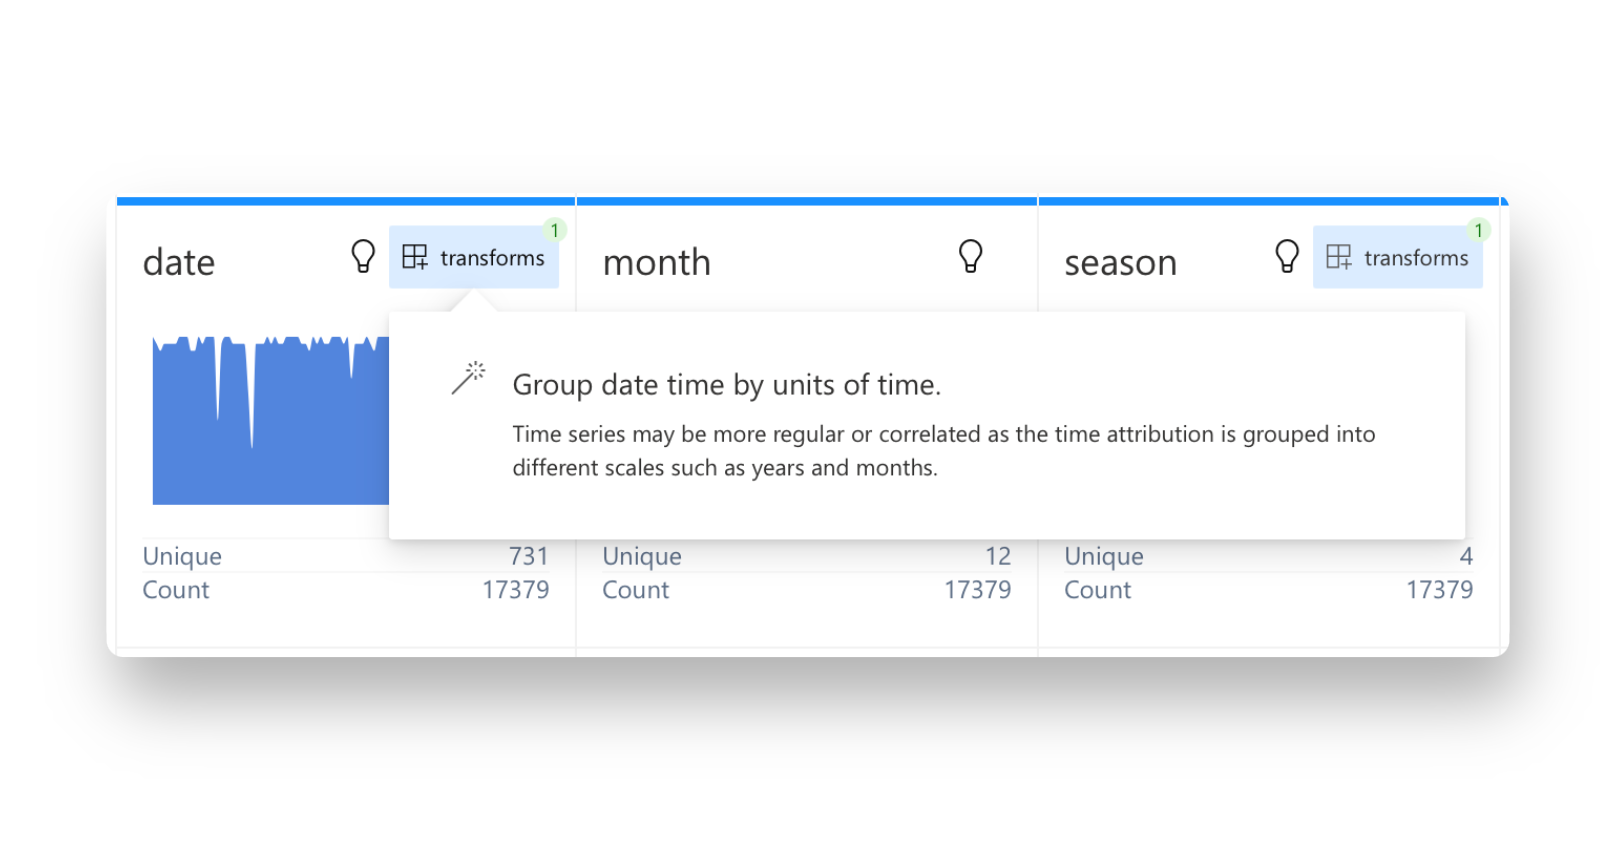
That is all the steps you need to take to group data by a certain DateTime variable. Easy, simple, straight-forward.
The best of all is: RATH is Open Source (opens in a new tab), there is no need to pay overpriced fees to generate a few charts. So give it a try with RATH Online Demo (opens in a new tab)!

Export Grouped Data to CSV
Step 1. On the Meta View, apply a Filter to the Month variable.
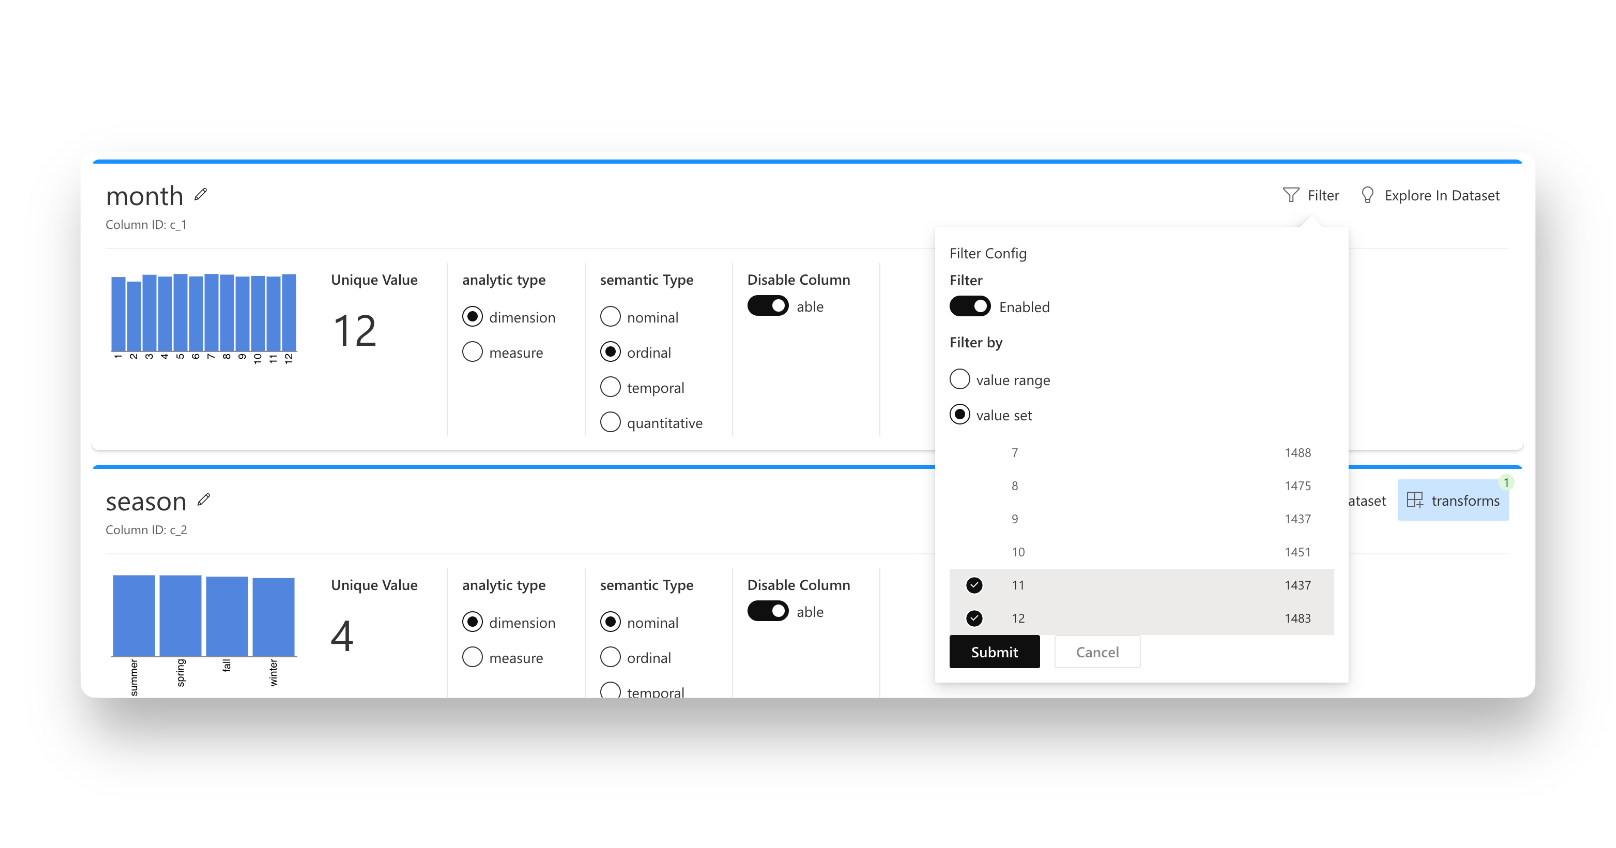
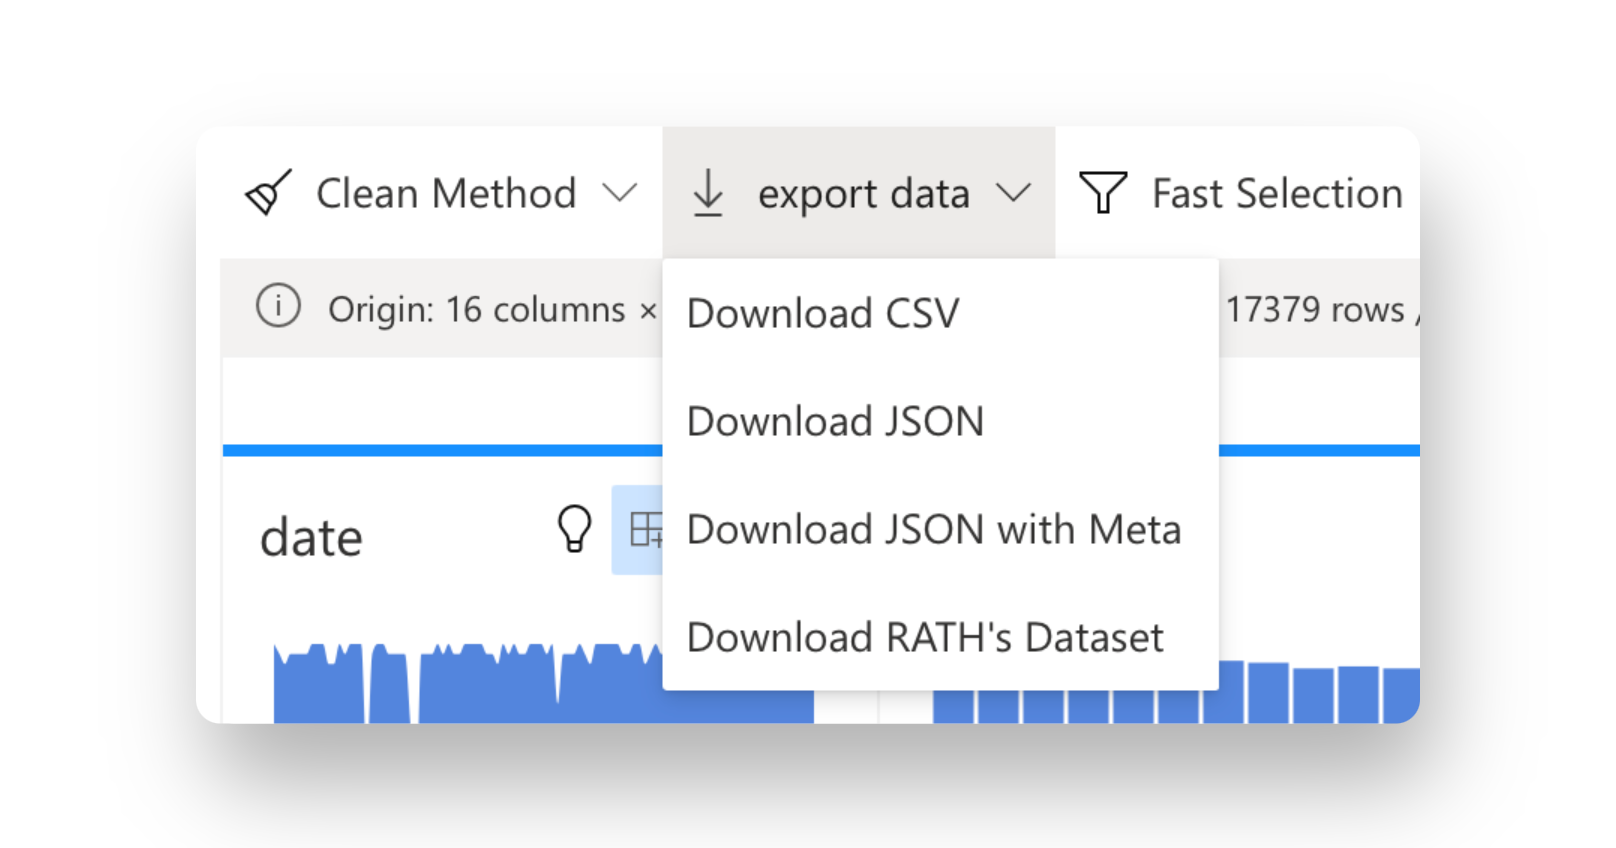
Click on the submit button to filter the data. Now, you can export this subset of data by clicking on the Export Data option on the tools bar.
Visualize Data in RATH
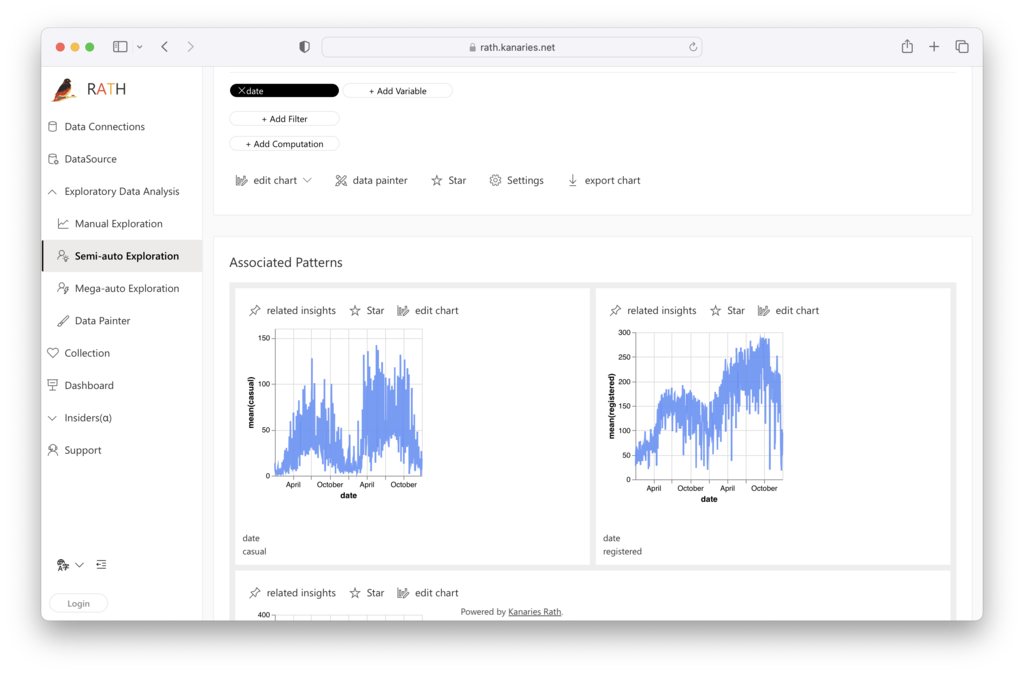
Why not create some charts for your grouped data? Within RATH, Data Charts are only one click away! Simply click on any variable that interests you to automatically generate charts. For example, you might want to create a chart about date, simply click on the lightbulb button to the right side of the date variable to Explore in Data Set:
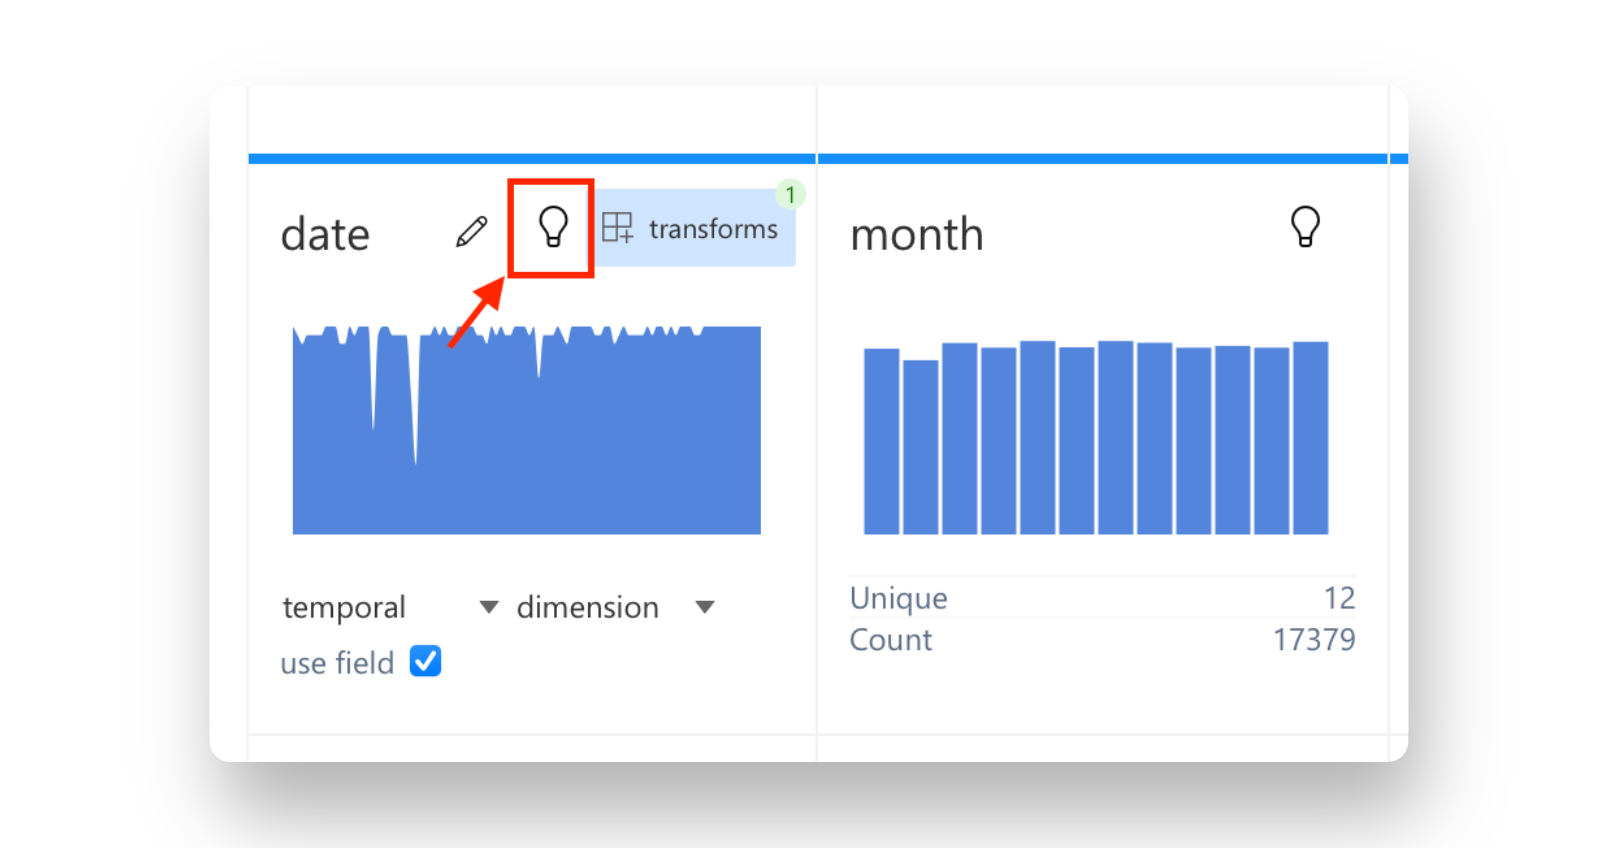
You are granted a set of Charts based on the date variable, with a simple click.
Other Ways to Group Data
Group Data in Excel
How to group data in Excel is a common question among analysts. Excel offers several ways to group data by time, including using a pivot table and without a pivot table. Here are the steps to group data by time in Excel:
- Create a PivotTable by selecting the data range and clicking on the 'PivotTable' option under the 'Insert' tab.
- In the PivotTable Fields pane, drag the date field to the 'Rows' area.
- Right-click on the date field in the PivotTable and select 'Group.'
- Choose the desired time period (year, month, week, date, or hour) and click 'OK.'
If you cannot group dates in a pivot table, it might be due to a formatting issue. Ensure that all dates in the column have the same format. Alternatively, you can group dates without a pivot table using formulas like FLOOR, EOMONTH, and WEEKNUM.
Group Data in SQL
Grouping data by time in SQL is accomplished using the GROUP BY clause along with time-based functions like YEAR, MONTH, DAY, etc. Here's a basic example of group by date SQL for grouping data by month:
SELECT MONTH(date_column) AS Month, COUNT(*) AS Total
FROM table_name
GROUP BY MONTH(date_column);
For more advanced SQL databases like MySQL, you can use the DATE_FORMAT function to group data by custom date formats.
Group Data in Pandas
Pandas is a popular Python library for data analysis. To group data by date in Pandas, you can use the groupby function with a time-based column. Here's an example of grouping data by month using Pandas:
import pandas as pd

df = pd.read_csv('data.csv')
df['date_column'] = pd.to_datetime(df['date_column'])
monthly_data = df.groupby(df['date_column'].dt.to_period('M')).count()
Group Data in Power BI
Power BI is a popular business intelligence tool that provides various options for grouping data by time. Here's a step-by-step guide on how to group data by date in Power BI:
- Import your data into Power BI and create a new table visualization.
- Drag the date field onto the 'Axis' section of the table.
- Click on the date field in the 'Axis' section and select 'New Group.'
- In the 'Grouping' window, choose the desired time period (year, month, week, date, or hour) and click 'OK.'
Group Data in R
R is a powerful programming language for data analysis and visualization. To group data by date in R, you can use the dplyr package, which provides a set of functions for data manipulation. Here's an example of grouping data by month using R:
library(dplyr)
library(lubridate)

data <- read.csv('data.csv')
data$date_column <- as.Date(data$date_column)

monthly_data <- data %>%
  mutate(month = floor_date(date_column, "month")) %>%
  group_by(month) %>%
  summarize(total = n())
Group Data in Tableau
Tableau is a leading data visualization tool that allows you to group data by time with ease. Here's how to group dates in Tableau:
- Import your data into Tableau and create a new sheet.
- Drag the date field onto the 'Rows' shelf.
- Right-click on the date field on the 'Rows' shelf and select 'Create Custom Date.'
- Choose the desired time period (year, month, week, date, or hour) and click 'OK.'
Dealing with Other Data Formats
In addition to the tools mentioned above, there are many other ways to group data by time. For example, you can use JavaScript to group data by date using the reduce function or MongoDB with its powerful aggregation pipeline.
Regardless of the tool or language you use, the key to successfully grouping data by time is understanding the underlying data format and using the appropriate functions or methods.
Conclusion
Grouping data by year, month, week, date, or hour is a fundamental skill for data analysts. This comprehensive guide has provided you with a solid foundation for grouping data using various tools, including RATH, Excel, SQL, Pandas, Power BI, R, and Tableau. By mastering these techniques, you'll be well-equipped to analyze trends, patterns, and changes over time, allowing you to make informed decisions based on data-driven insights.