How to make bar chart with PyGWalker
The document will introduce how to create a bar chart with PyGWalker. You need about 2-3 minutes to read it. It includes three steps:
- Input your data into PyGWalker
- Visualization through drag-and-drop operations
- Export your data visualization.
Updated on

Step 1 How to input your data into PyGWalker
To input your data, you have to ensure that PyGWalker is installed on your computer. If you're unsure how to install it, refer to the installation guide. Once installed, open PyGWalker to visualize your data. In a new Jupyter Notebook file, type the following command:
import pandas as pd
import pygwalker as pyg
Next, import your data into PyGWalker by typing:
df = pd.read_csv("D:/data/student_score_data.csv")This command loads your data onto the page. Ensure that the file path in the parentheses is accurate. You can find the correct path by right-clicking on your data file and viewing its properties.
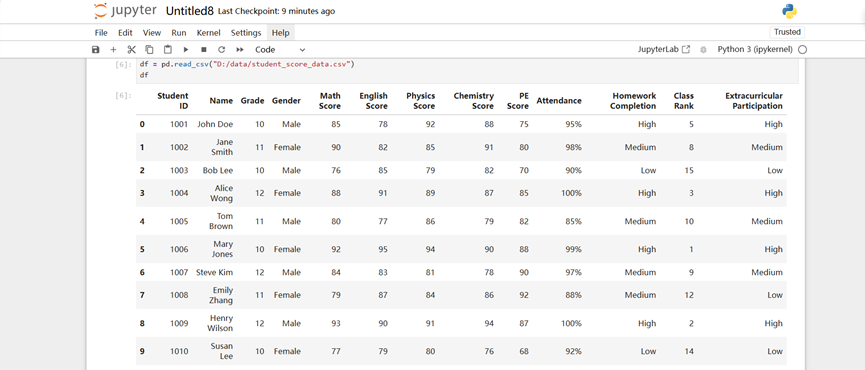
Then, type pyg.walk(df) to display the visualization page:
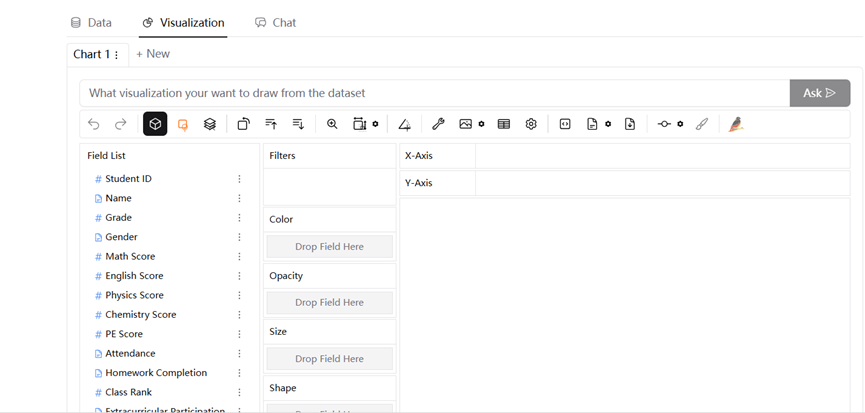
Congratulations! You've successfully accessed the PyGWalker user interface. Here, you can visualize your data by drag-and-drop operations.
Step 2 How to visualize your data through drag-and-drop operations
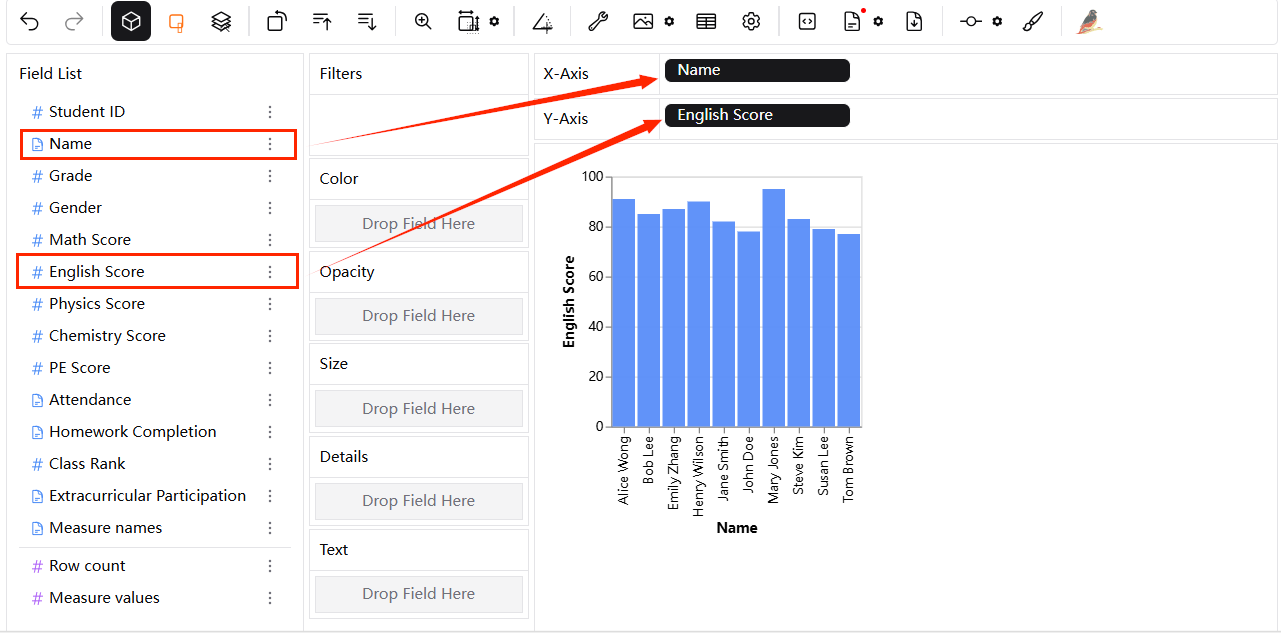
The data shown is a student score documentation. Let's try to presume that you are a school teacher. Now, let's take a look at the overall performance of your students. Drag "Name" into the X-axis to identify each student and their score of one subject to Y-axis, like English. You'll then be able to see each student's exact performance.
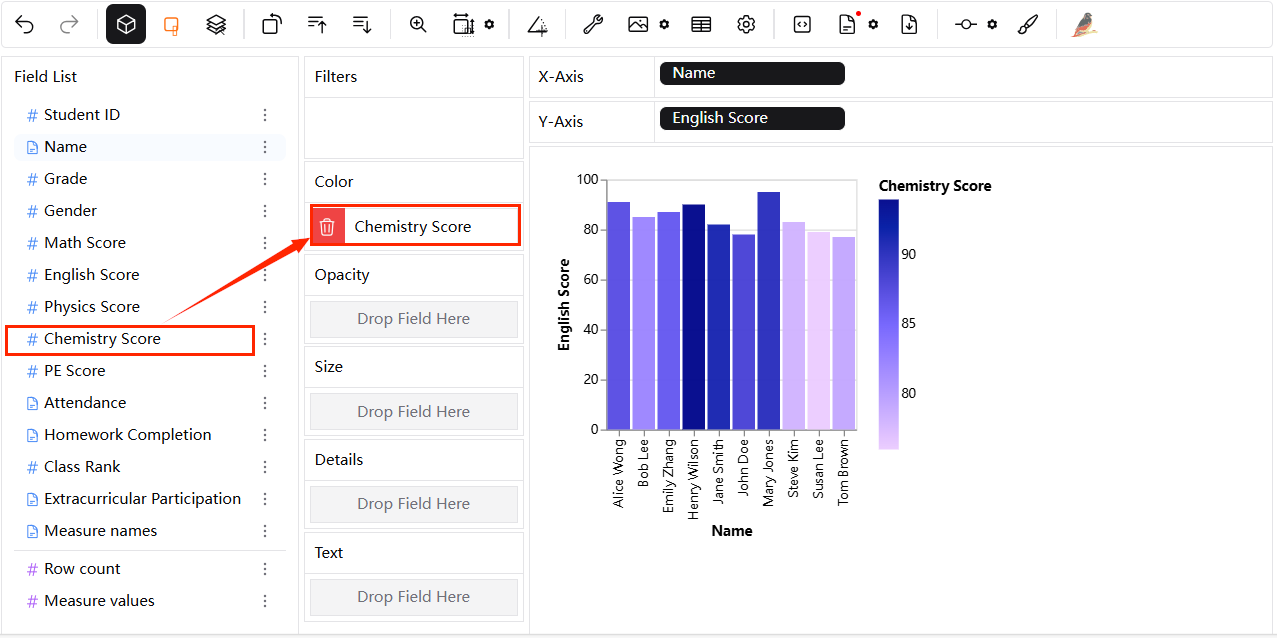
If you want to see their scores in different subjects, like physics scores, drag the relevant subject into the opacity, size, or shape field to generate your preferred graph. For instance, if you want to view their chemistry scores and English scores at the same time, you can drag "English Score" into Y-axis, and "Chemistry Score" into "Color" channel.
If you'd like to add more details to your chart, you can drag additional information into it. For example, to see their math scores, drag "Math Score" into the "Opacity" channel and "Attendance" into the "Size" channel. The table will update accordingly:
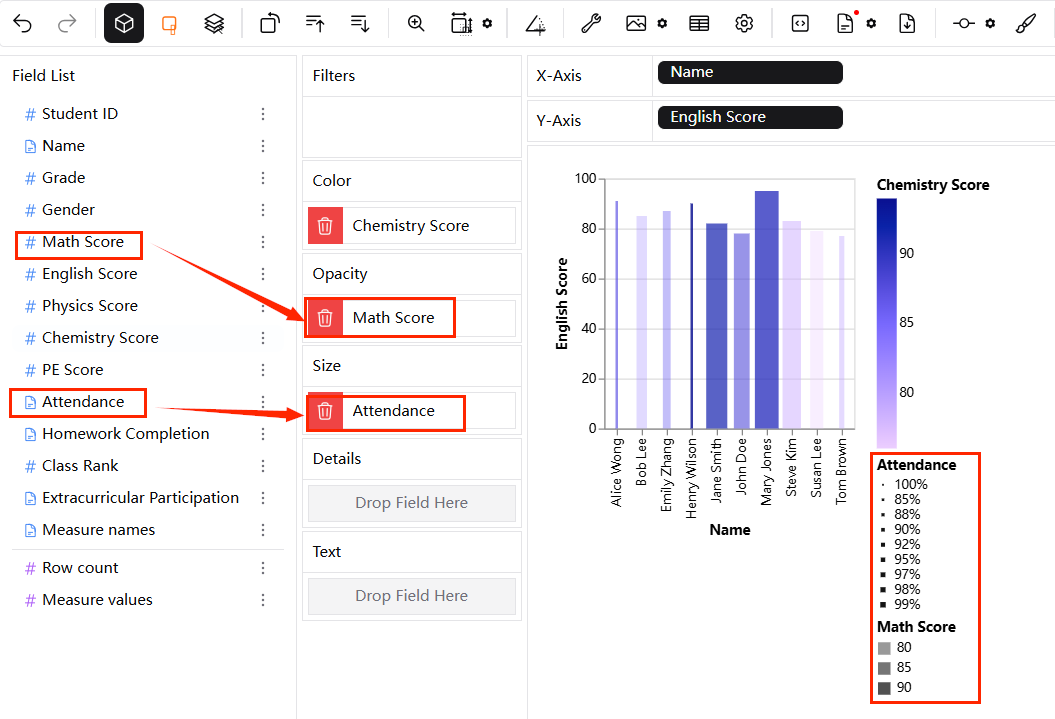
This allows you to see their math scores based on the shade of color. You can view detailed information by hovering your cursor over each student's data. Congratulations! You've now created a clear, detailed, and visually appealing bar chart to display your data.
Step 3 How to export your data visualization
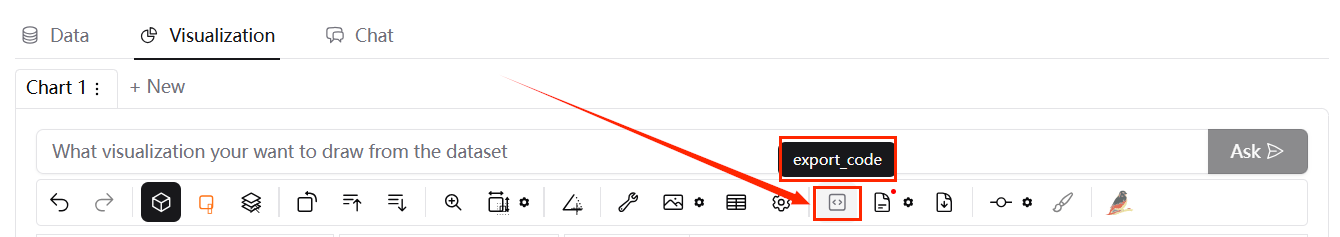
There are multiple ways. The first is to export the data visualization as code. You can "export_code" button in the tool bar and paste the code you just got.
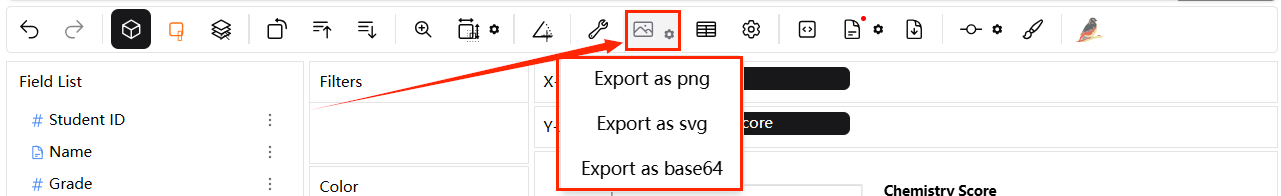
The second is to use a local file to store the result. You can click the export in the tool bar to select the file type you want: png, svg or base64.
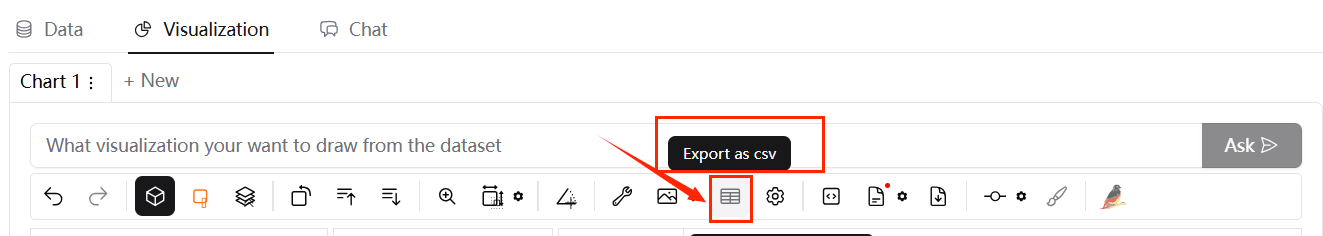
If you want to save the result as a CSV file, you can click "Export as csv". Then PyGWalker will automatically load the file.