Causal Analysis
RATH provides a visual, no-code workflow for finding and exploring causal relationships in your data. Instead of stopping at simple correlations, you can discover potential causes, test hypotheses, and build better machine-learning models — all from an interactive causal graph.
In this guide, you will:
- Understand what causal analysis is and when to use it.
- Learn the step-by-step workflow for running causal analysis in RATH.
- Walk through a concrete example using the Kaggle “Diabetes” dataset.
- Explore advanced tools such as comparative analysis, mutual inspection, prediction tests, and manual model editing.
What is causal analysis?
Causal analysis is the process of examining relationships between variables to determine whether changes in one variable cause changes in another — not just whether they move together.
In practice, this means:
- Identifying variables that may influence an outcome of interest.
- Building a causal model (often a directed graph) that encodes assumptions or learned relationships.
- Using statistical and algorithmic techniques to estimate the strength and direction of these effects.
- Testing and refining hypotheses, instead of relying solely on correlation or feature importance.
Because most real-world data is observational (not collected from controlled experiments), causal analysis does not guarantee “true causality,” but it helps you generate and validate much stronger, more interpretable hypotheses than correlation alone.
How to perform causal analysis with RATH
RATH wraps complex causal discovery techniques in an interactive workflow. At a high level, you:
-
Connect and prepare your data
- Import your dataset into RATH.
- Clean invalid records and ensure key fields are correctly typed (numeric, categorical, etc.).
-
Configure fields and optional dependencies
- Choose the fields that should be included in the causal model.
- Optionally declare known functional dependencies (e.g., derived fields, formulas) so RATH can respect them during discovery.
-
Run causal discovery
- Start the Causal Analysis workflow and let RATH infer a causal graph from your data.
-
Explore and validate relationships
- Use tools such as Field Insights, Manual Exploration, and Mutual Inspection to check and refine the discovered model against domain knowledge.
-
Build and test predictive models
- Use Prediction Test to create machine-learning models based on the causal graph and compare them with alternative feature sets.
-
Edit and finalize the causal model
- Manually adjust the model when you have additional knowledge, noisy data, or missing factors.
The following sections walk through this workflow using a real example.
Case study: Causal analysis of the "Diabetes Database" from Kaggle
As a concrete example, let’s explore the “Diabetes Database” from Kaggle (opens in a new tab) using RATH. Our goal is to understand which factors most strongly affect the Outcome (diabetes diagnosis) and how they interact.
Prepare and clean the dataset
- Import the dataset into RATH.
- Remove invalid records where
BMI,BloodPressures, orSkinThicknessare equal to0.
On the DataSource tab:- Click Clean Method.
- Choose drop null records to filter out rows with invalid values.
Once the data is clean, open the drop-down menu to the right of the Start Analysis button and choose Causal Analysis to launch the workflow.
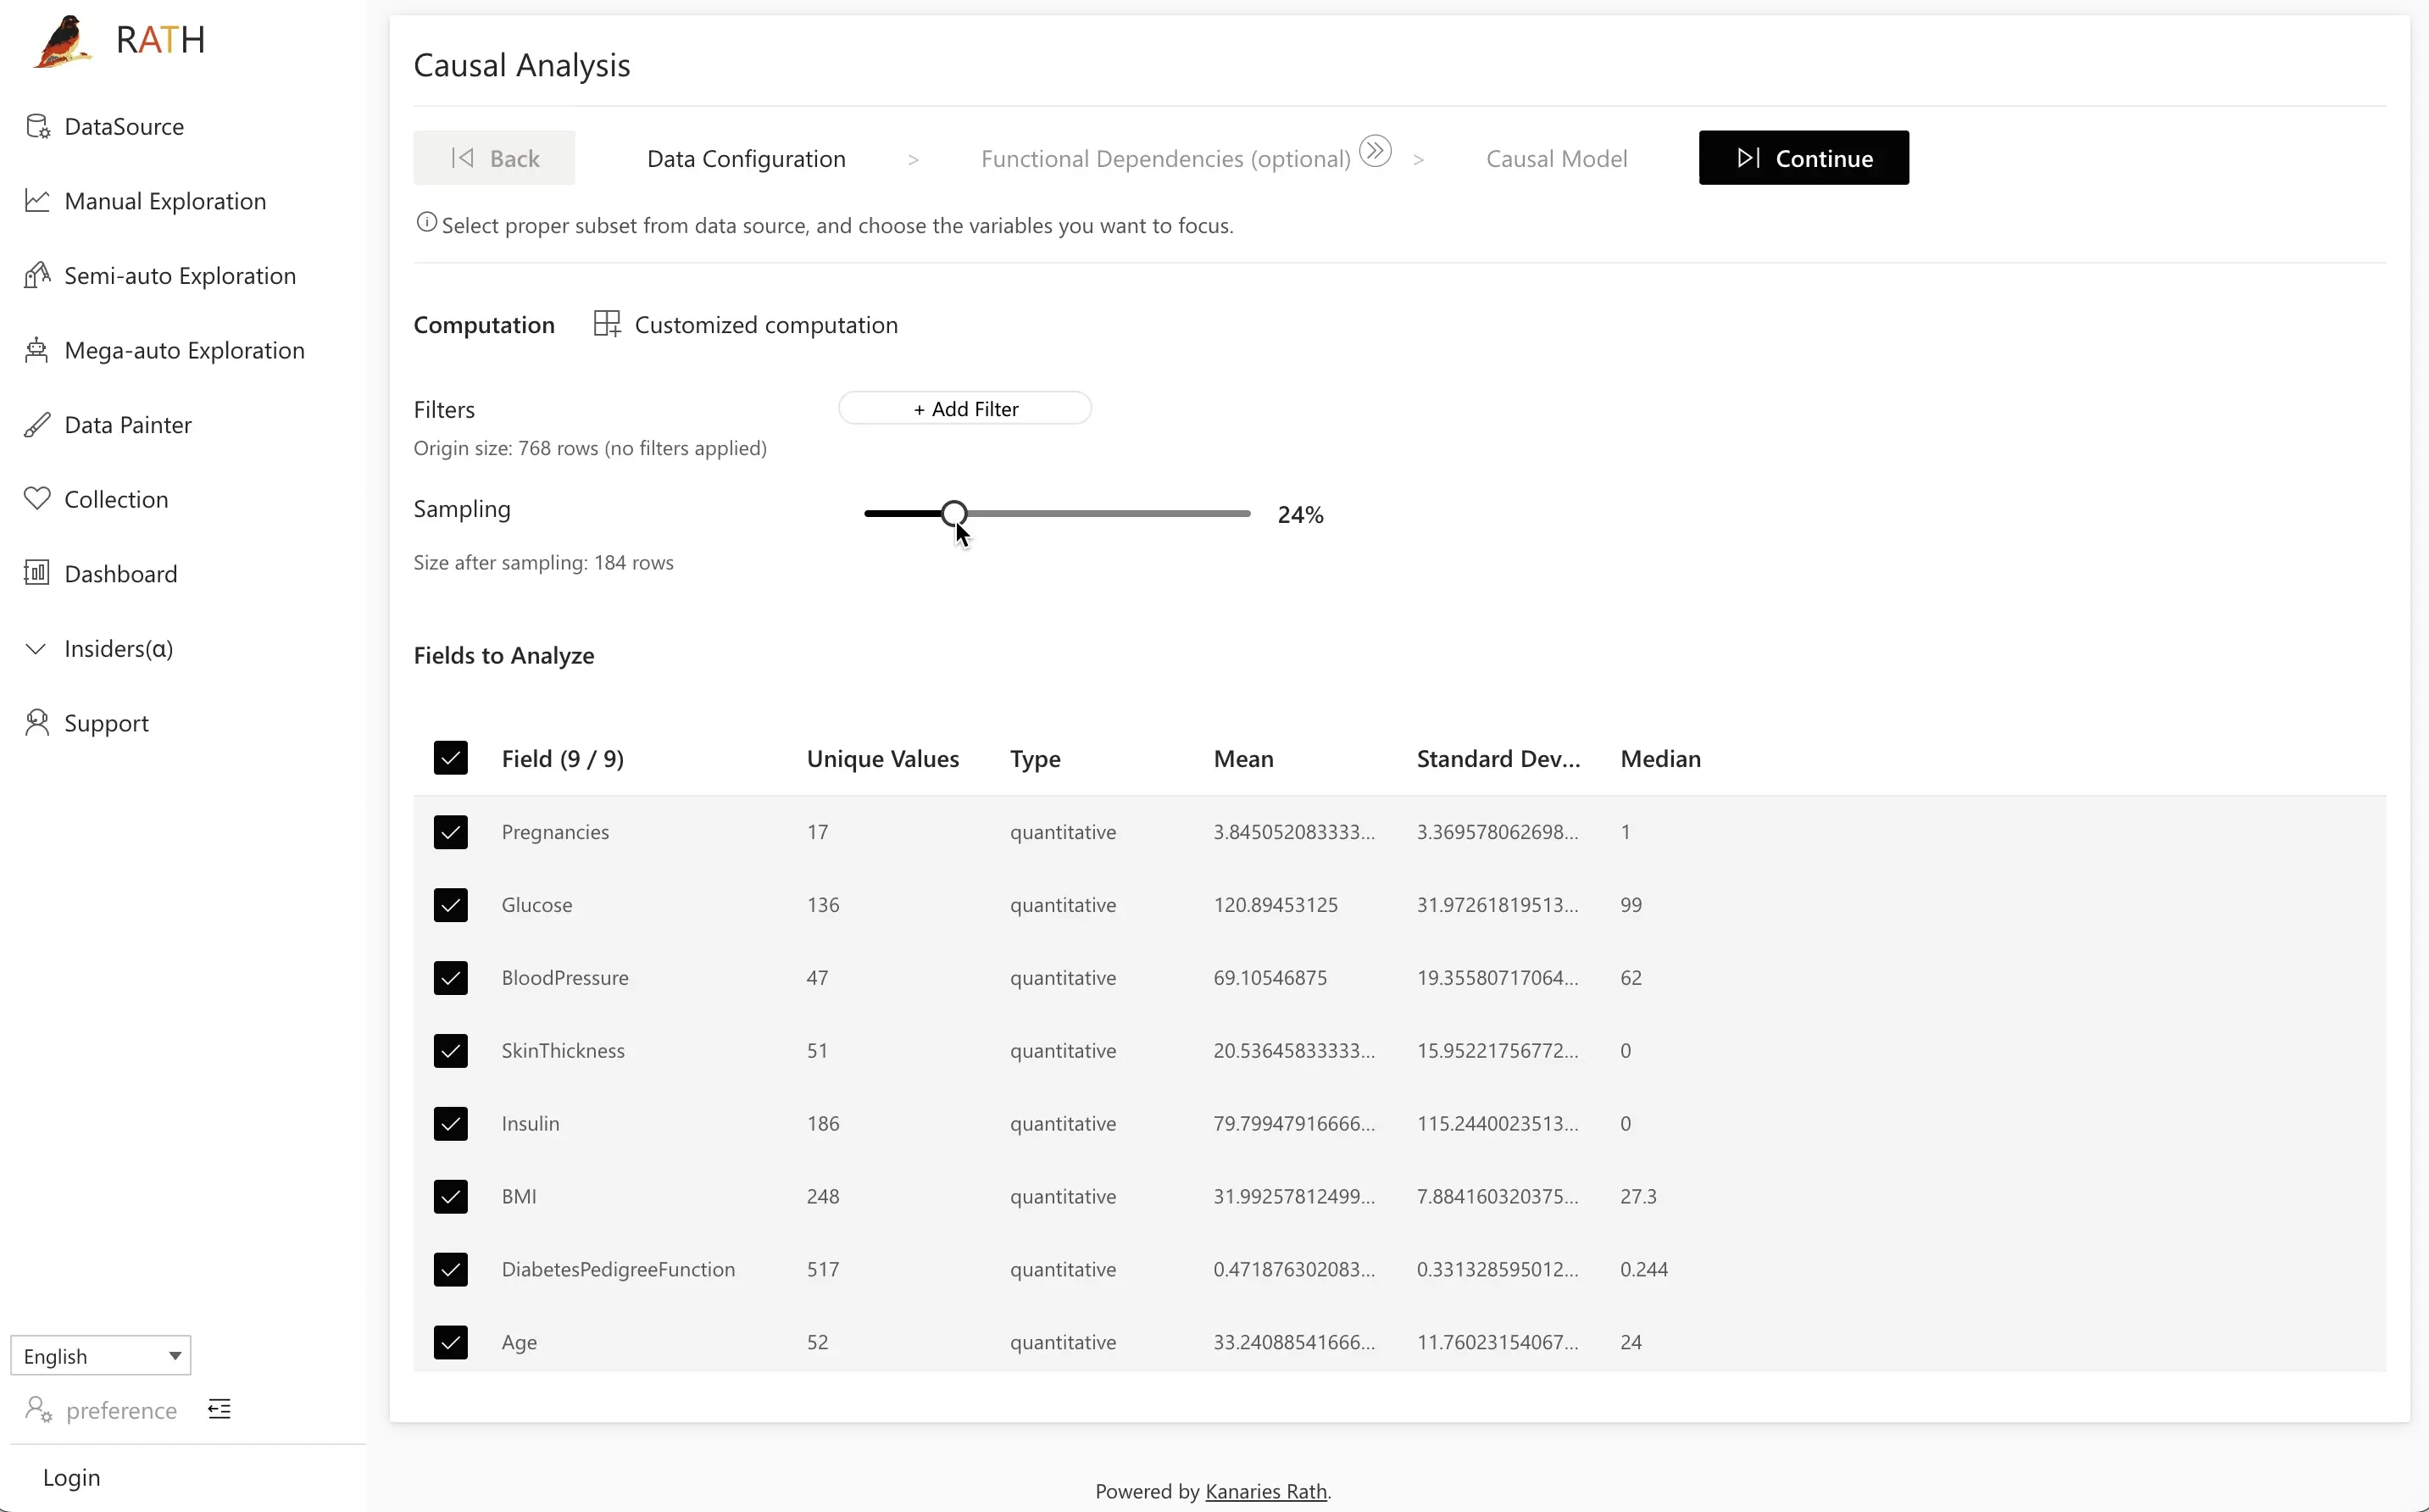
Step 1: Data Configuration
In Data Configuration, choose which fields to include in the causal analysis.
- Select all relevant variables (for example,
Pregnancies,Glucose,BloodPressure,SkinThickness,Insulin,BMI,DiabetesPedigreeFunction,Age, andOutcome). - Optionally exclude fields you know are irrelevant or too noisy.
When you’re done, click Next to proceed.
Tip: Start with all potentially relevant variables, then refine later based on your causal model and prediction results.
Step 2: (Optional) Functional Dependencies
In many datasets, some fields are derived from others (for example, calculated ratios, formatted IDs, or fields generated by SQL formulas). Declaring these relationships up front helps RATH avoid learning misleading causal links.
In the Functional Dependencies step, you can:
- Let RATH automatically analyze your data and suggest dependencies.
- Manually specify relationships when you already know them (e.g.,
TotalAmount = Quantity × UnitPrice).
RATH analyzes the values of different variables and computes possible functional relationships. You can accept, edit, or add your own dependencies.
Best practice:
If some of your data is generated using regular expressions or SQL formulas, declare their dependencies here. If these derived fields are generated inside RATH, you often don’t need to do anything — RATH handles them automatically.
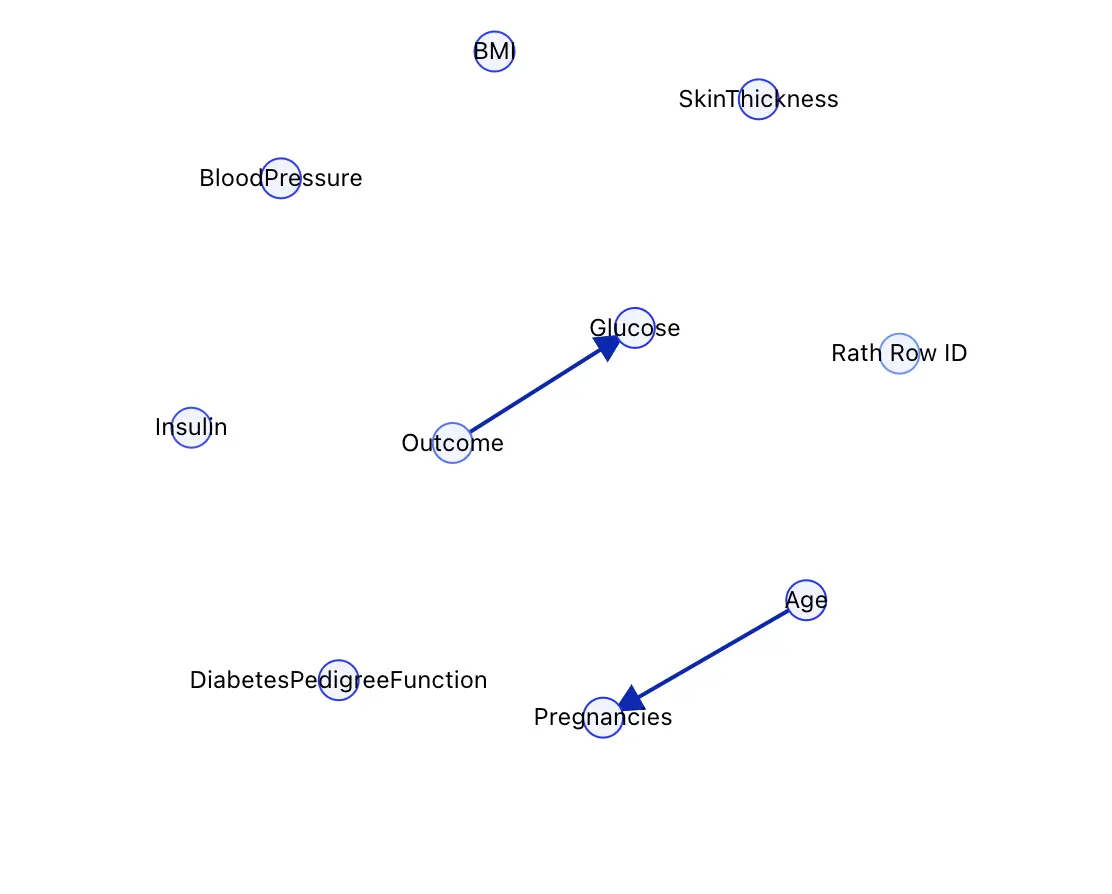
Step 3: Causal Model
Click Causal Discovery to let RATH infer a causal model from the configured fields.
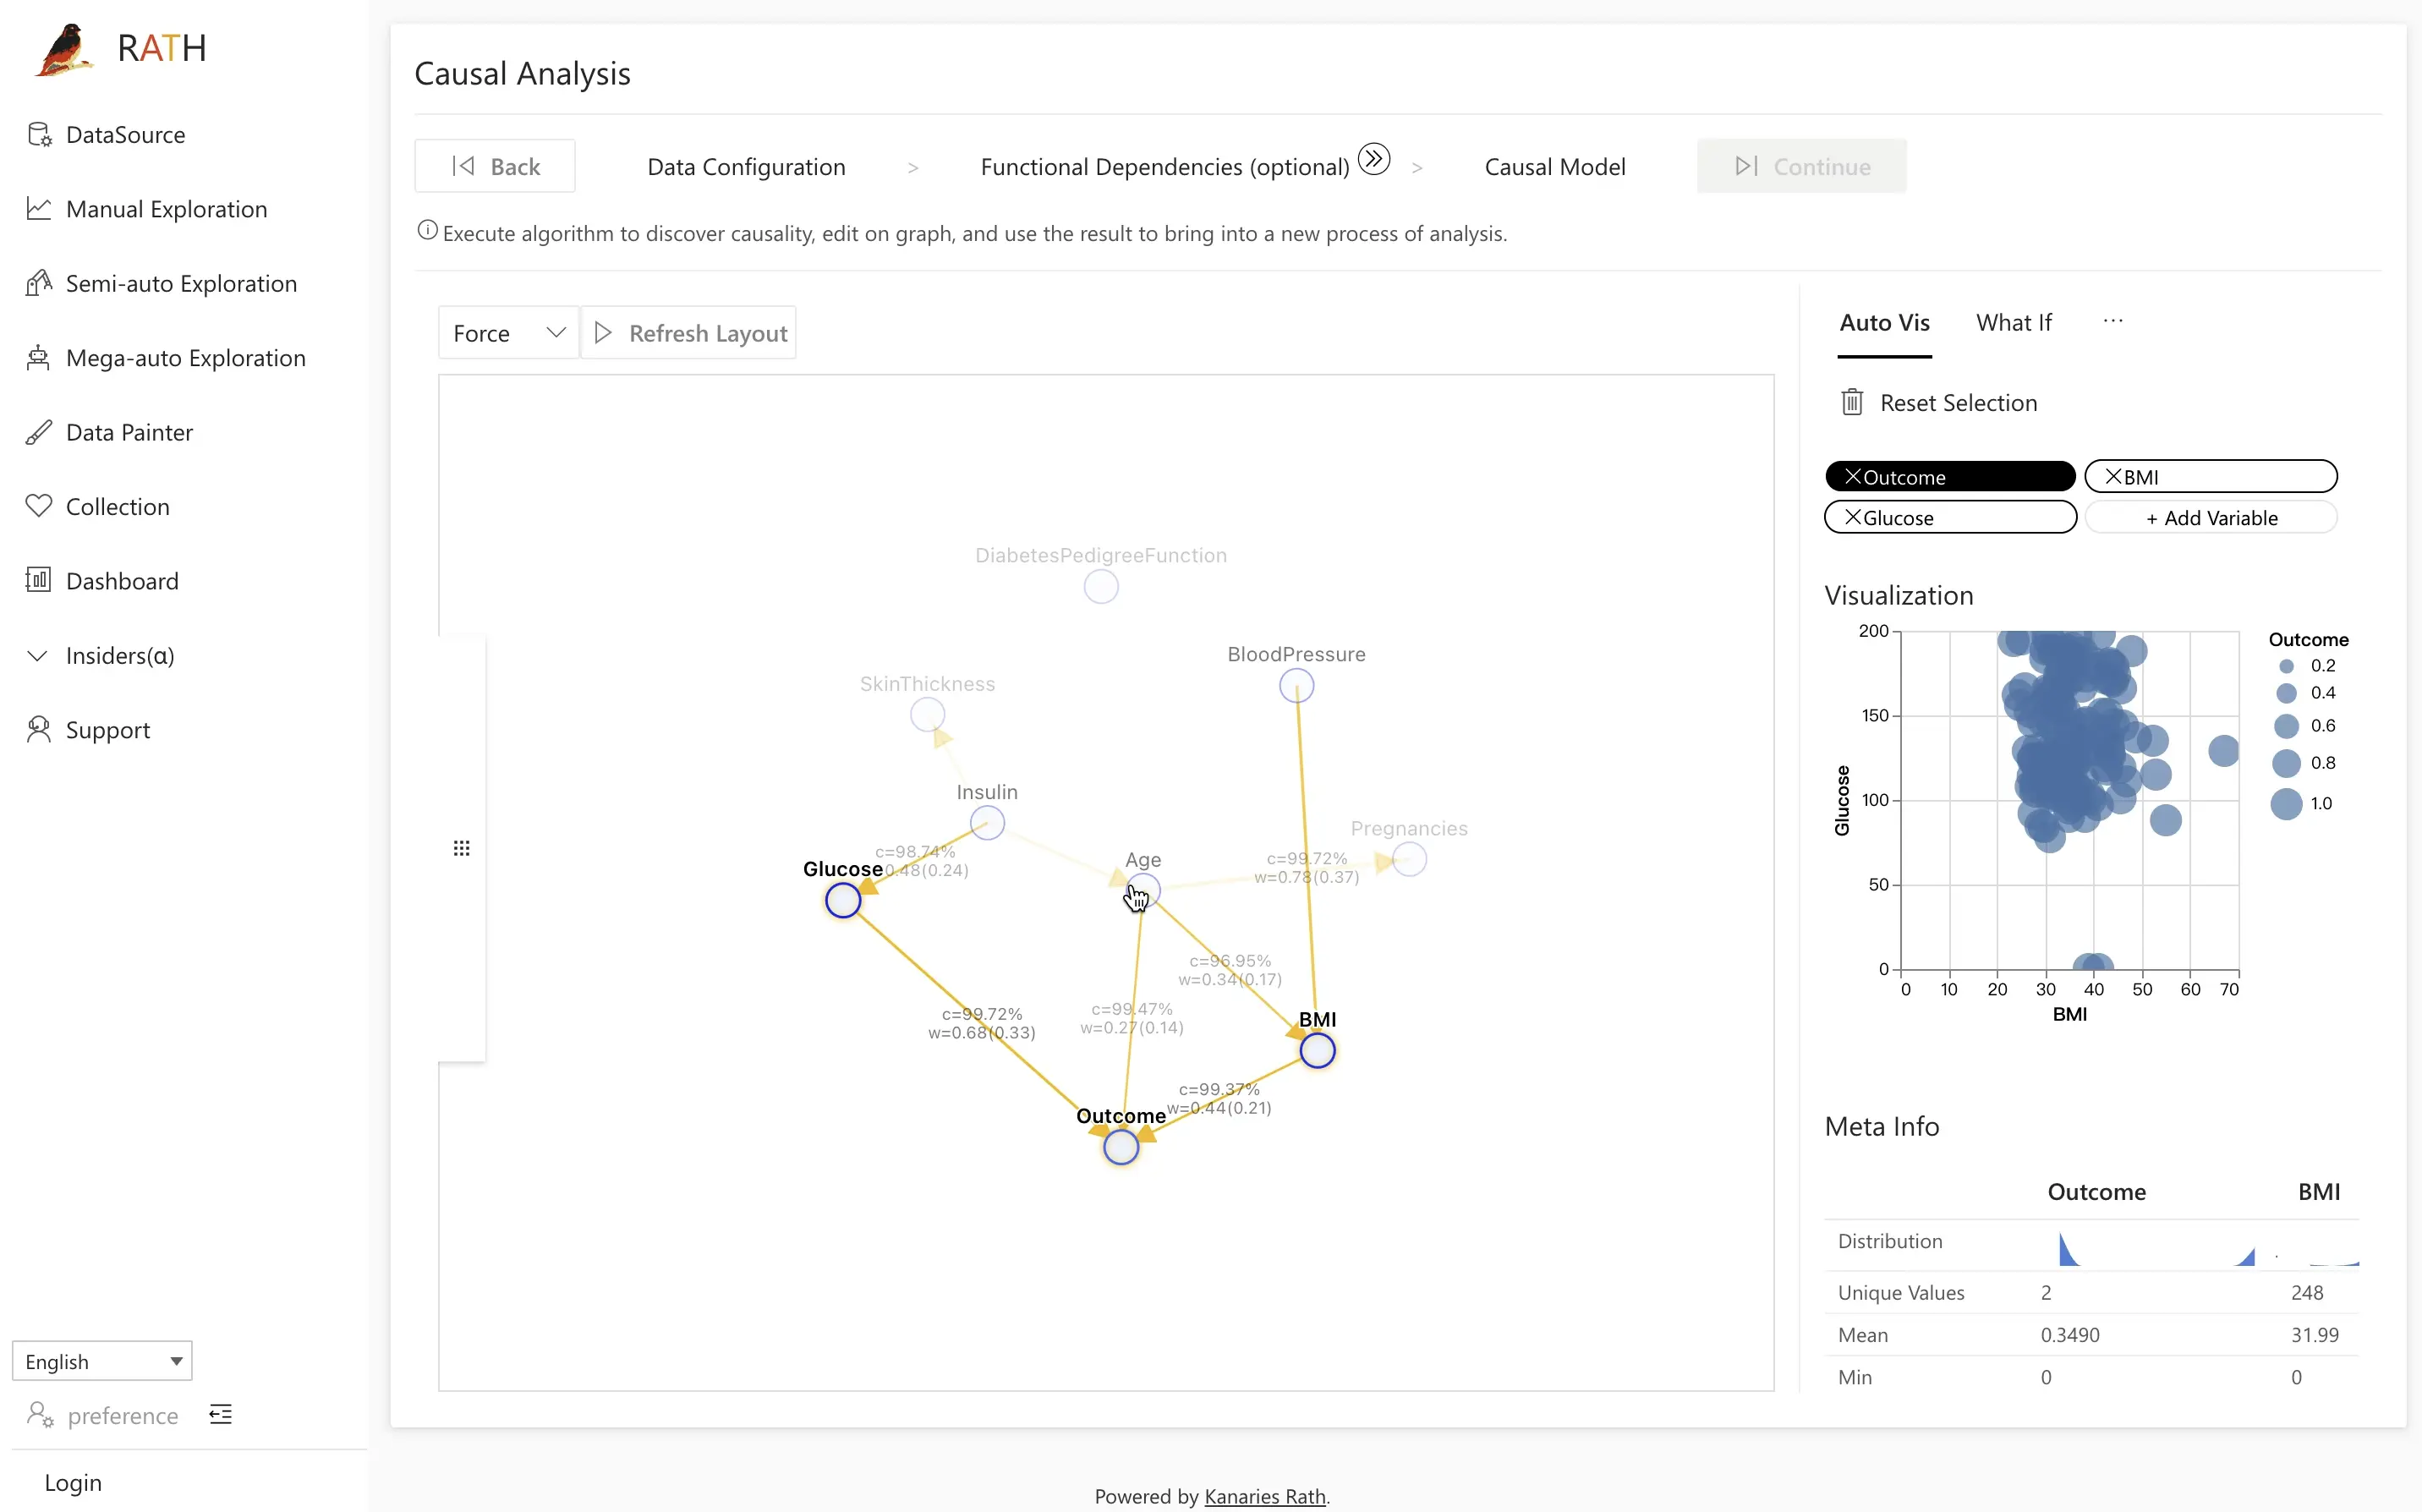
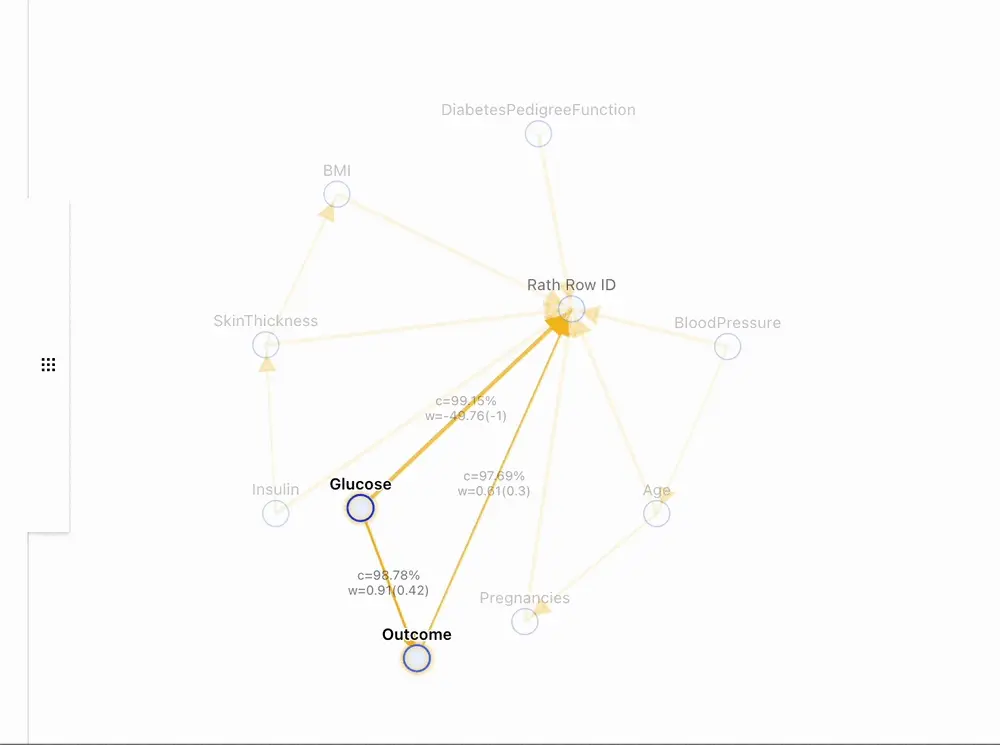
The screenshot below shows a typical causal discovery result for the diabetes dataset:
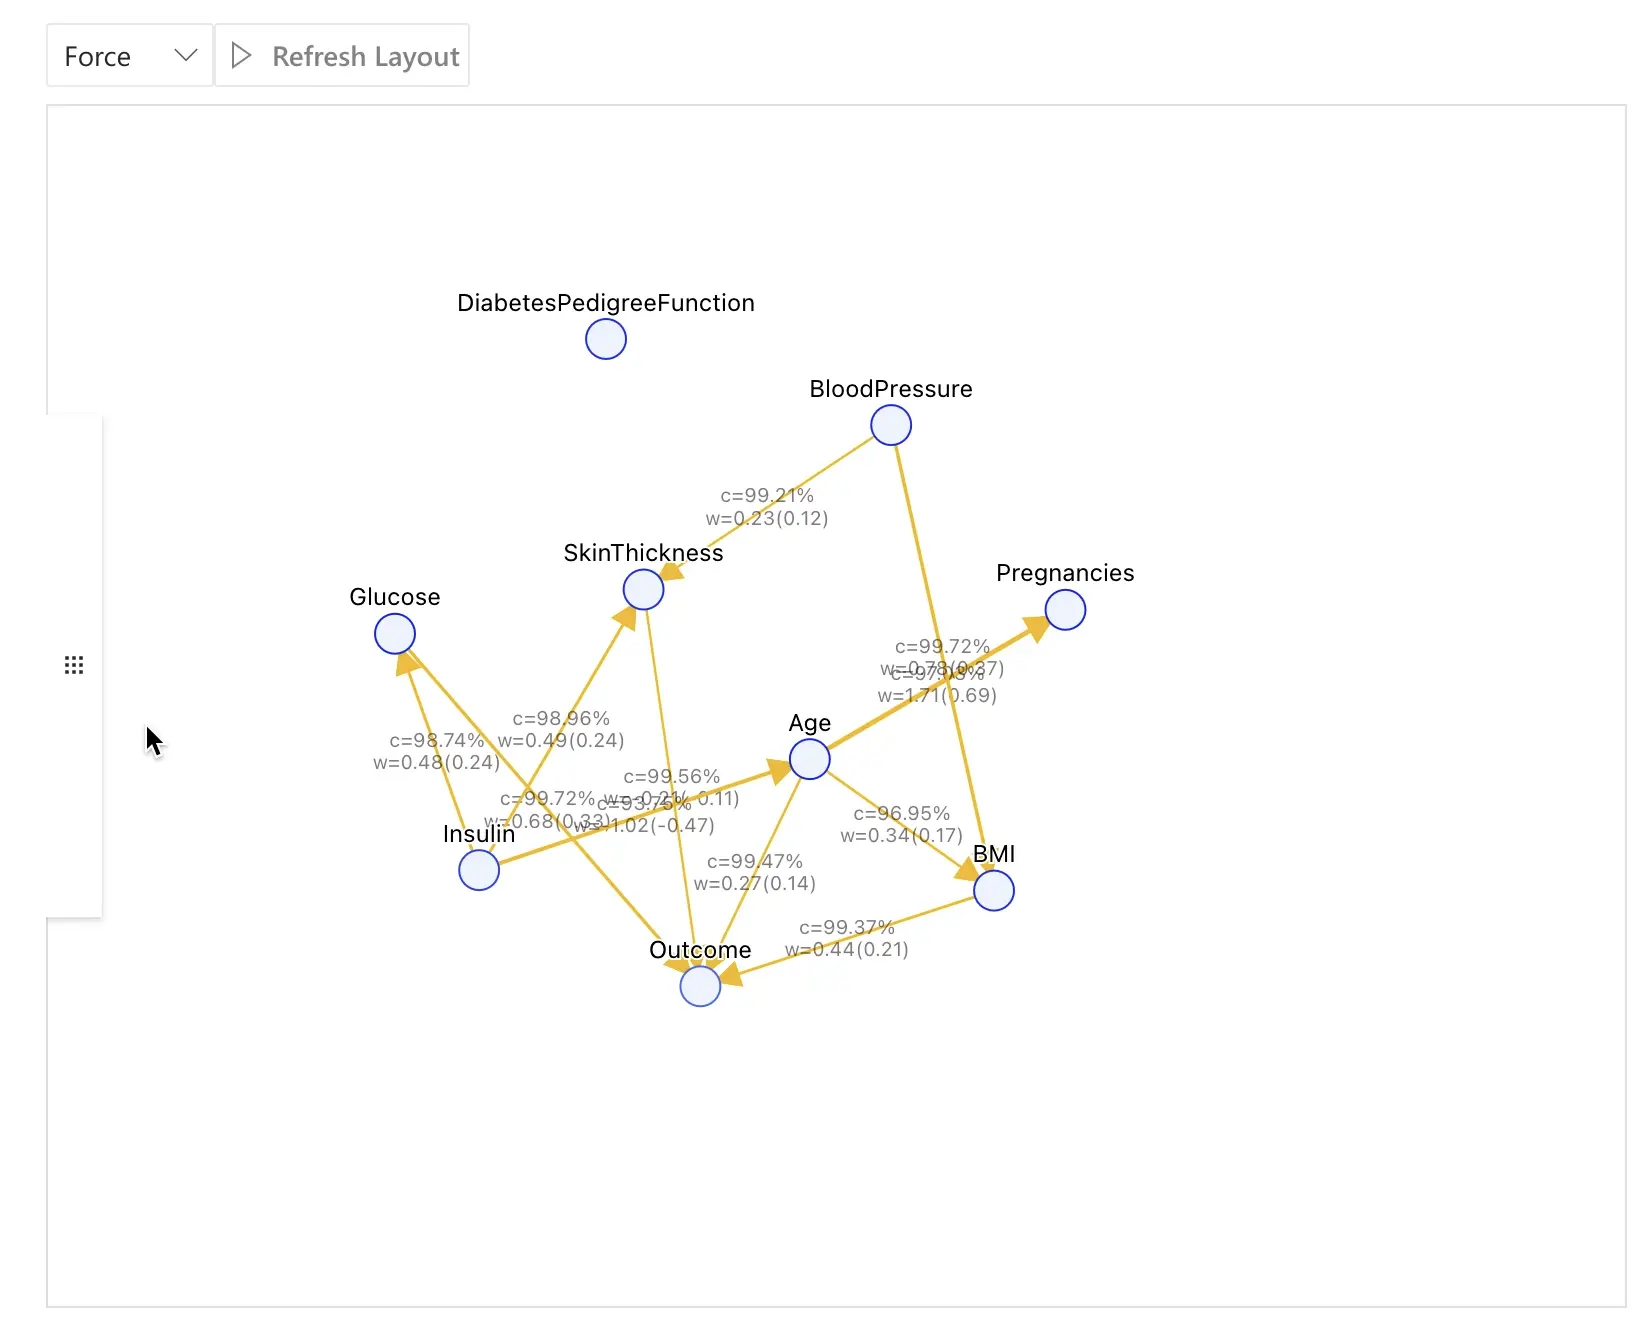
In this example, some of the key relationships are:
Glucose→Outcome
Higher glucose levels increase the likelihood of a positive diabetes diagnosis.Insulin→Glucose→Outcome
Insulin affects glucose, which in turn affects the diabetes outcome.Age→Outcome(and sometimes influenced by related health factors)
Age contributes to the probability of having diabetes.
The interactive graph is your central workspace:
- Click a node to highlight its direct causes and effects.
- Examine the edge thickness or strength indicator to understand how strong a relationship is.
- Use the right-hand panel to access different tools (Field Insights, Manual Exploration, Mutual Inspection, Prediction Test) focused on the selected variable.
Step 3.1: Comparative Analysis with Field Insights
Comparative analysis lets you compare two groups — for example, patients with and without diabetes — and explain the differences using your causal model.
RATH supports several comparison modes:
- Subset vs. Whole
(e.g., January vs. the full year) - Subset vs. Complement
(January vs. “everything except January”) - Subset vs. Another Subset
(January vs. June)
You can use these comparisons to:
- Investigate potential causal factors behind anomalies or outliers.
- Verify and refine causal hypotheses using real distributions.
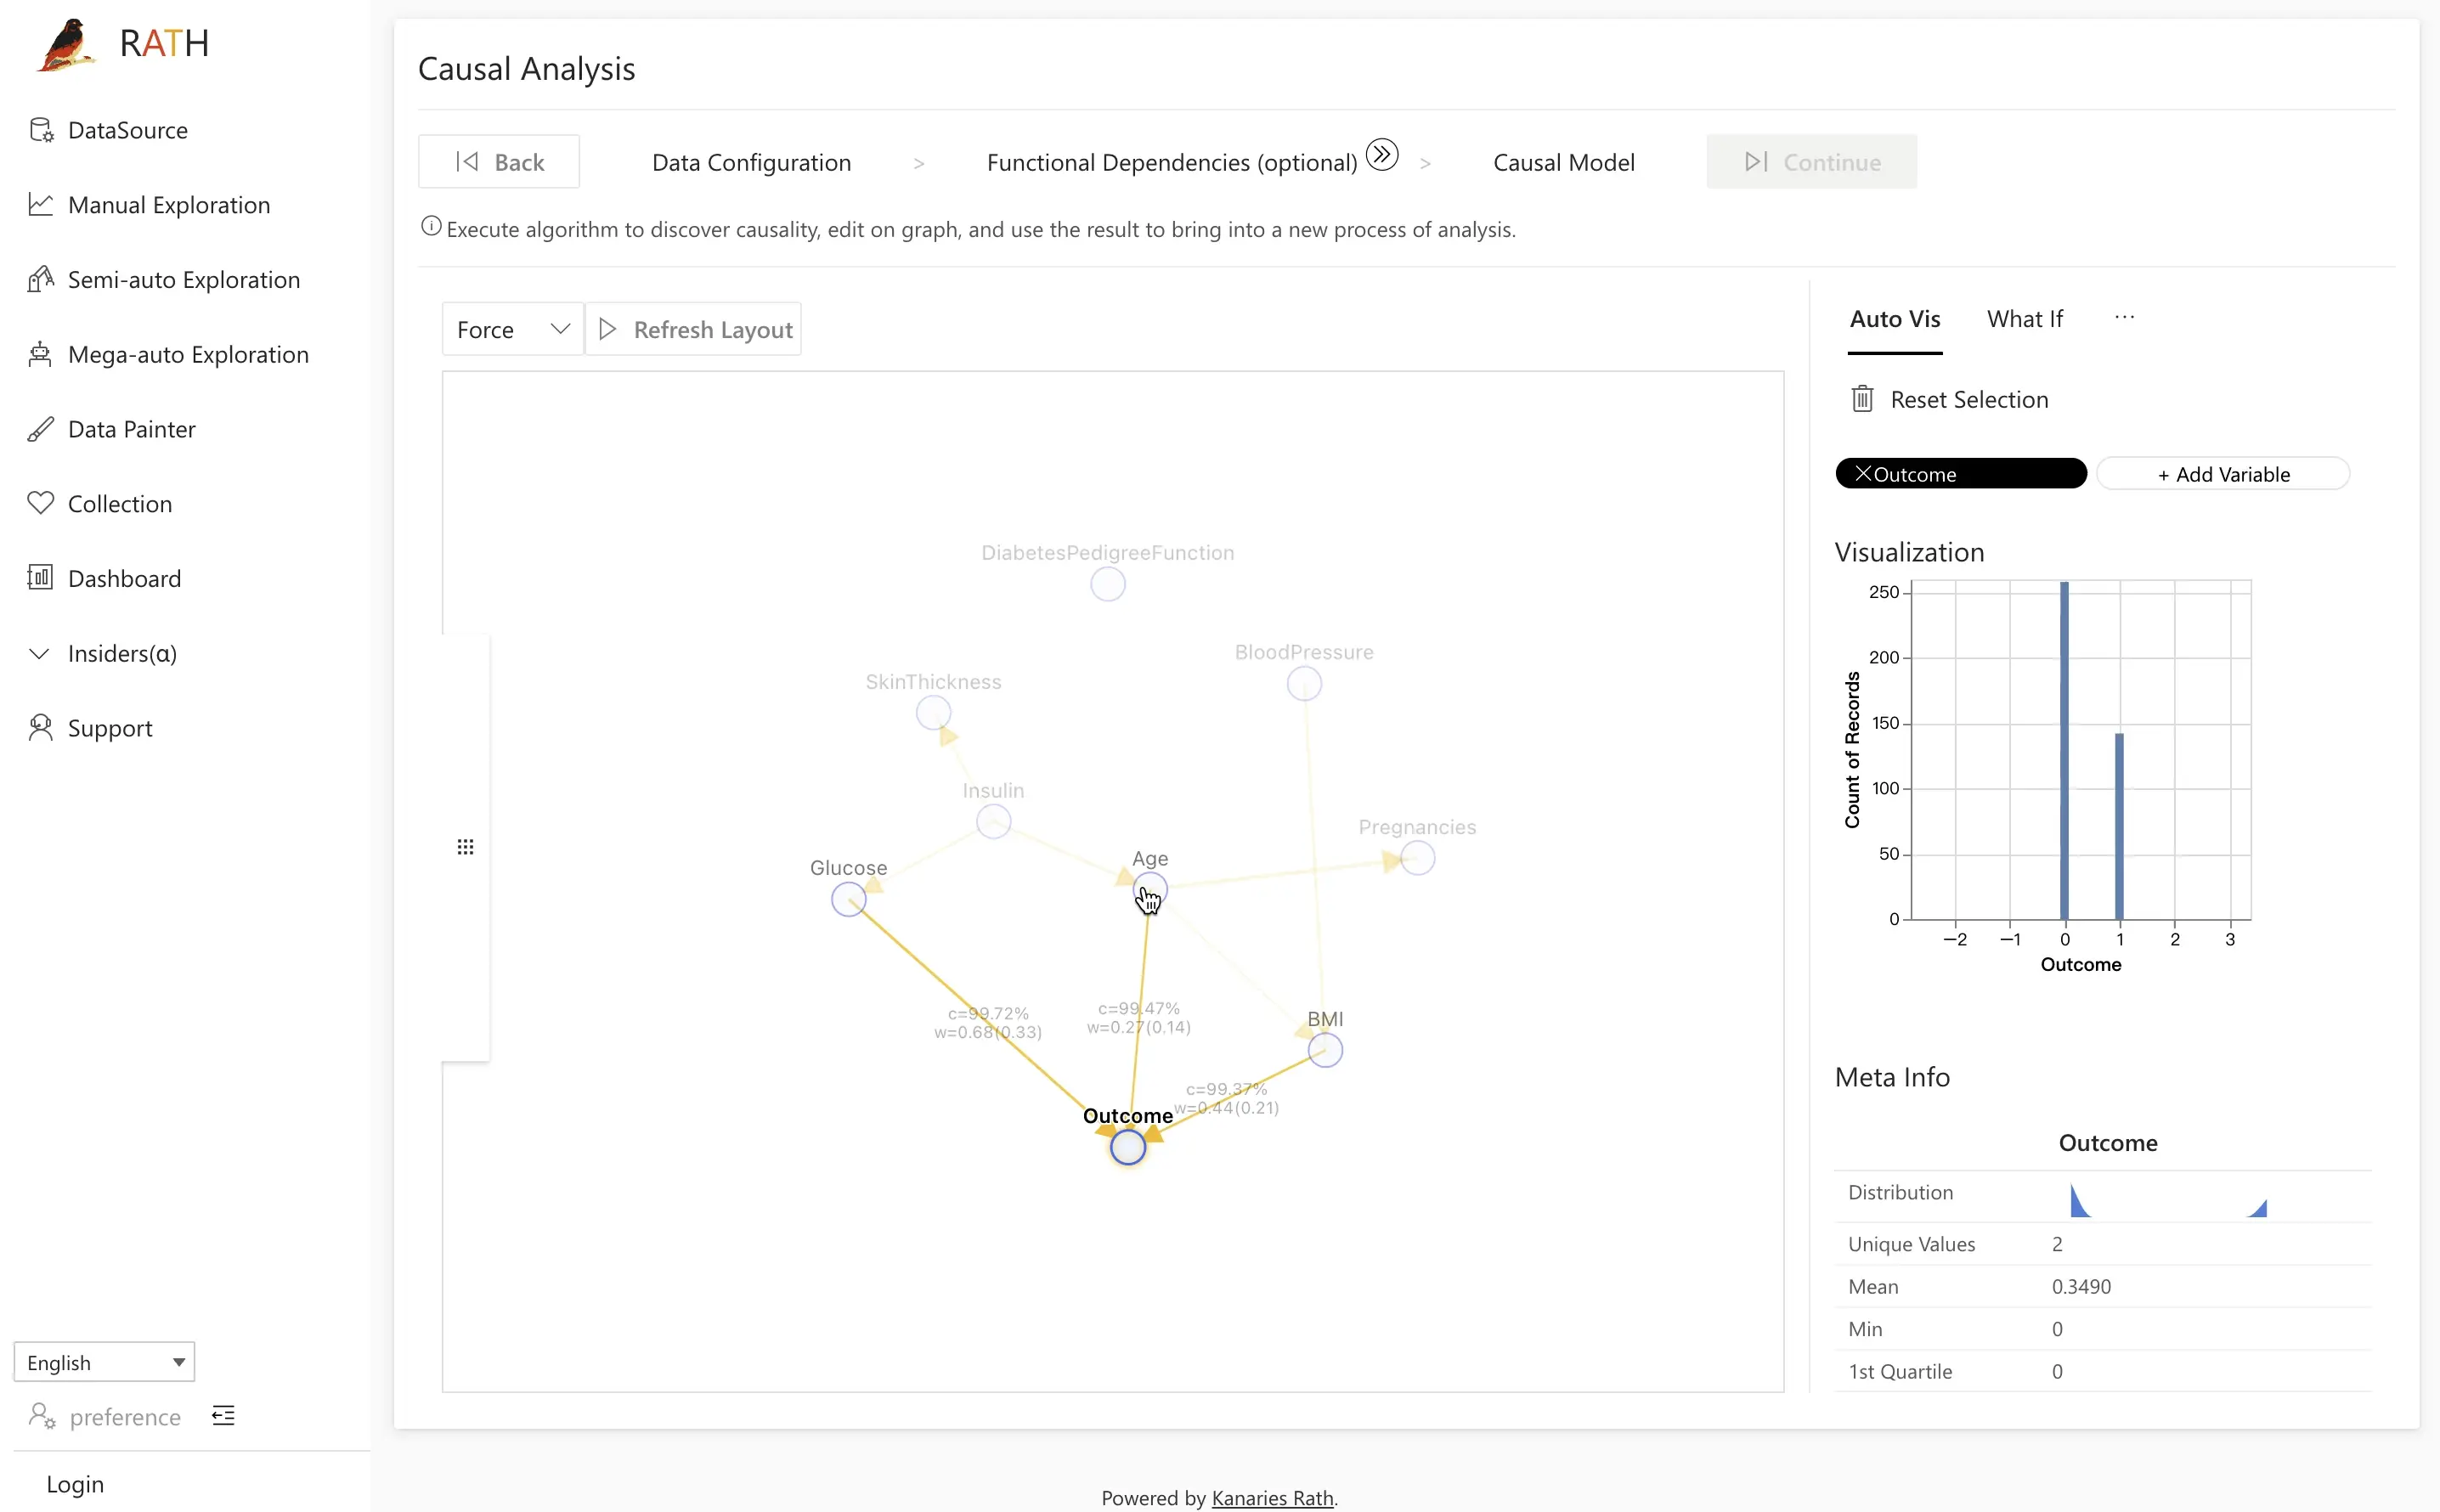
Example: Analyzing Outcome
- Open the Field Insight tab.
- Click the
Outcomenode on the left. - On the right, view the distributions of individuals with and without diabetes.
- Click one of the distributions (e.g., positive outcomes) to run a comparative analysis.
Next, choose the control group and key variable of interest, such as Glucose, and click Causal Discovery to let RATH analyze potential underlying causes. RATH uses cause-and-effect diagrams to suggest explanations for the observed differences.
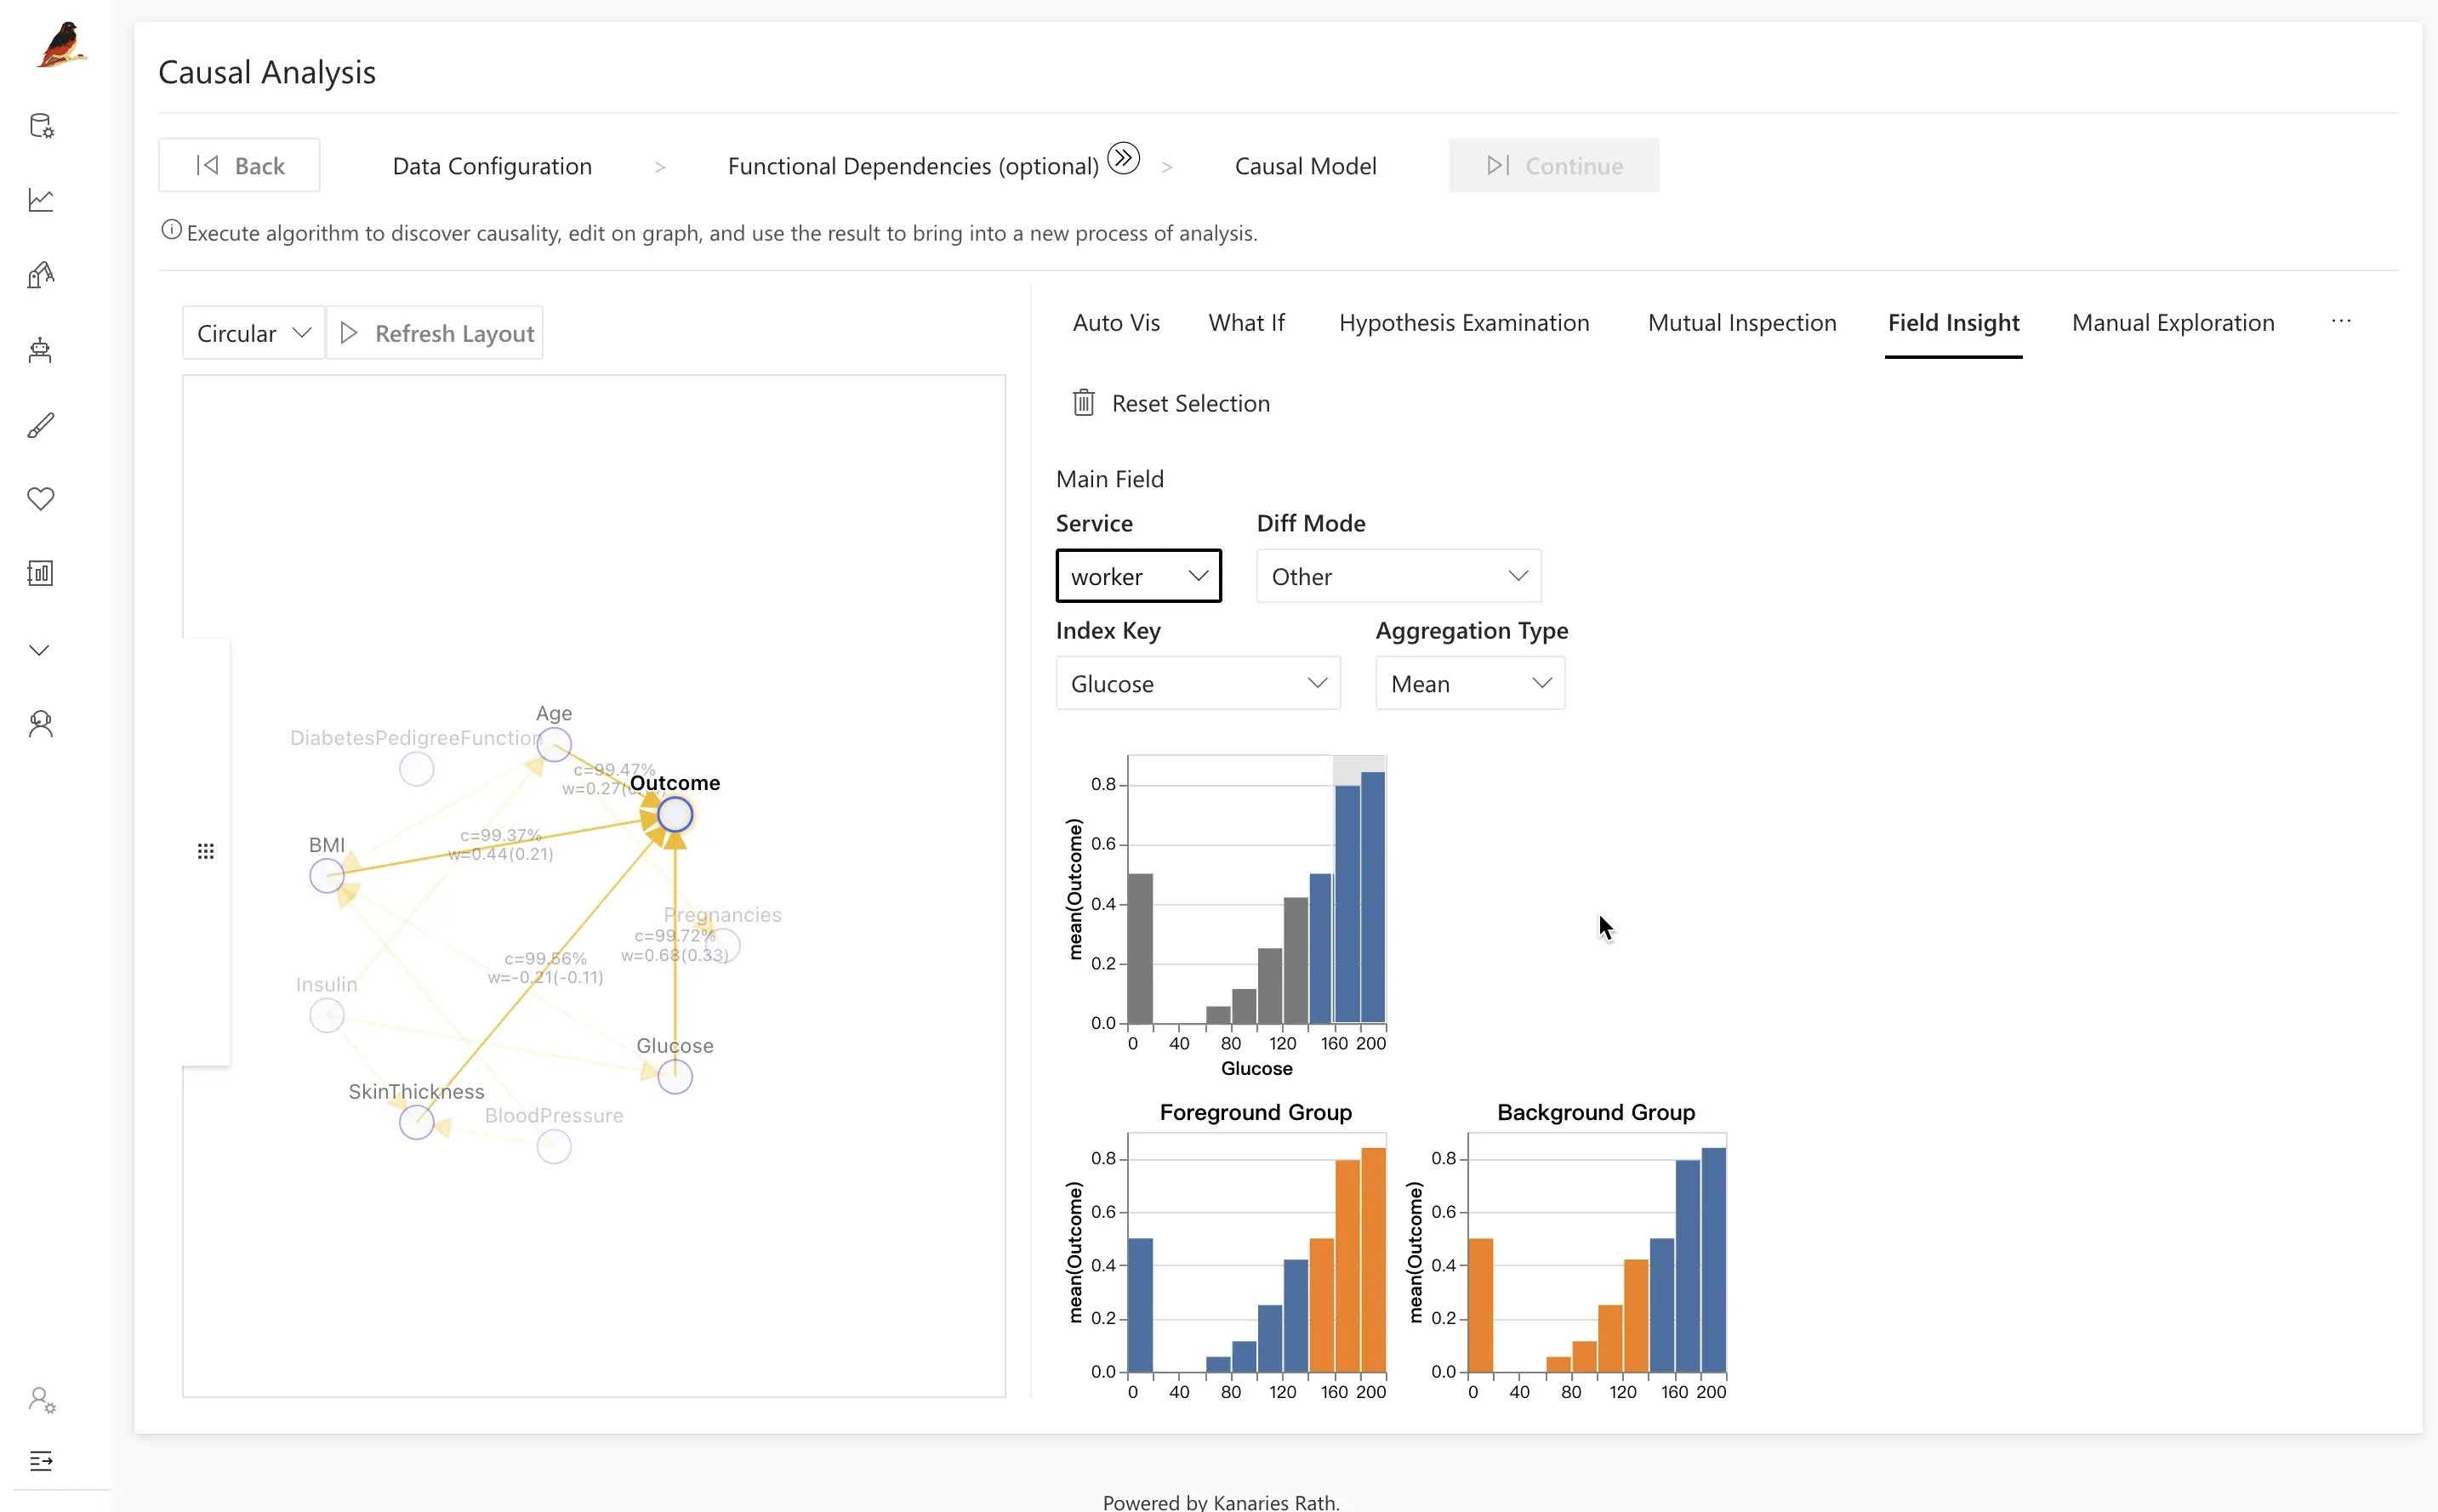
In the diabetes example, comparing diabetic and non-diabetic patients often reveals that differences are driven by:
BMIAgeGlucose
By clicking the latent factor Glucose, you can see that glucose distributions are significantly higher for the diabetic group (highlighted in orange).
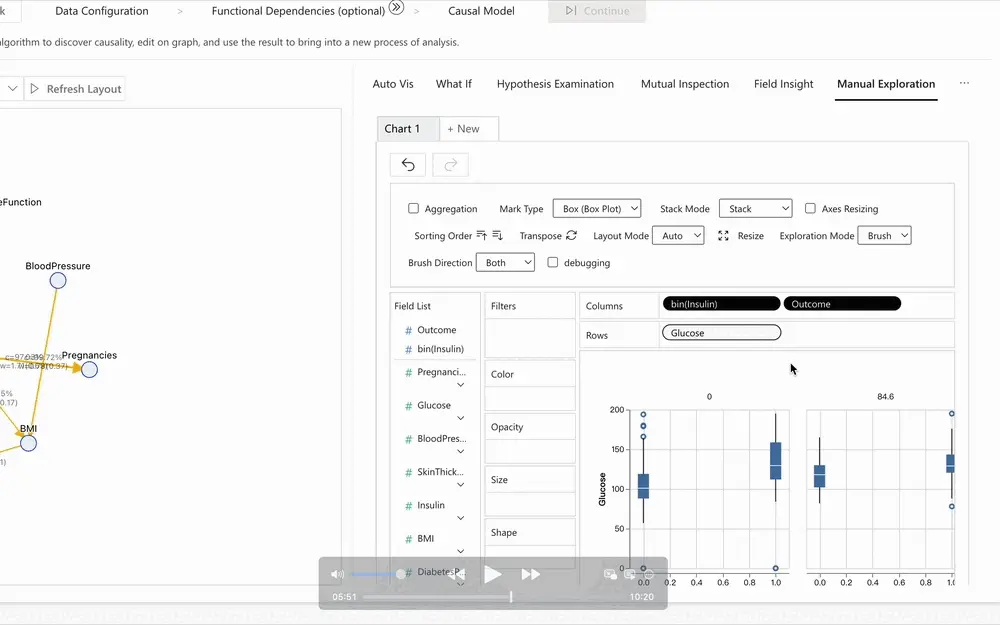
Step 3.2: Manual Exploration
Manual exploration lets you visually test specific causal assumptions.
For the diabetes dataset, you might want to check:
- Whether
Insulinis a direct cause ofOutcome. - How the relationship between
GlucoseandOutcomechanges when you control forInsulin.
Using manual exploration, you can:
- Plot
Outcomevs.Glucoseand compare distributions between diseased and healthy groups. - Add
Insulinas a conditioning variable (e.g., slice data into intervals of insulin levels).
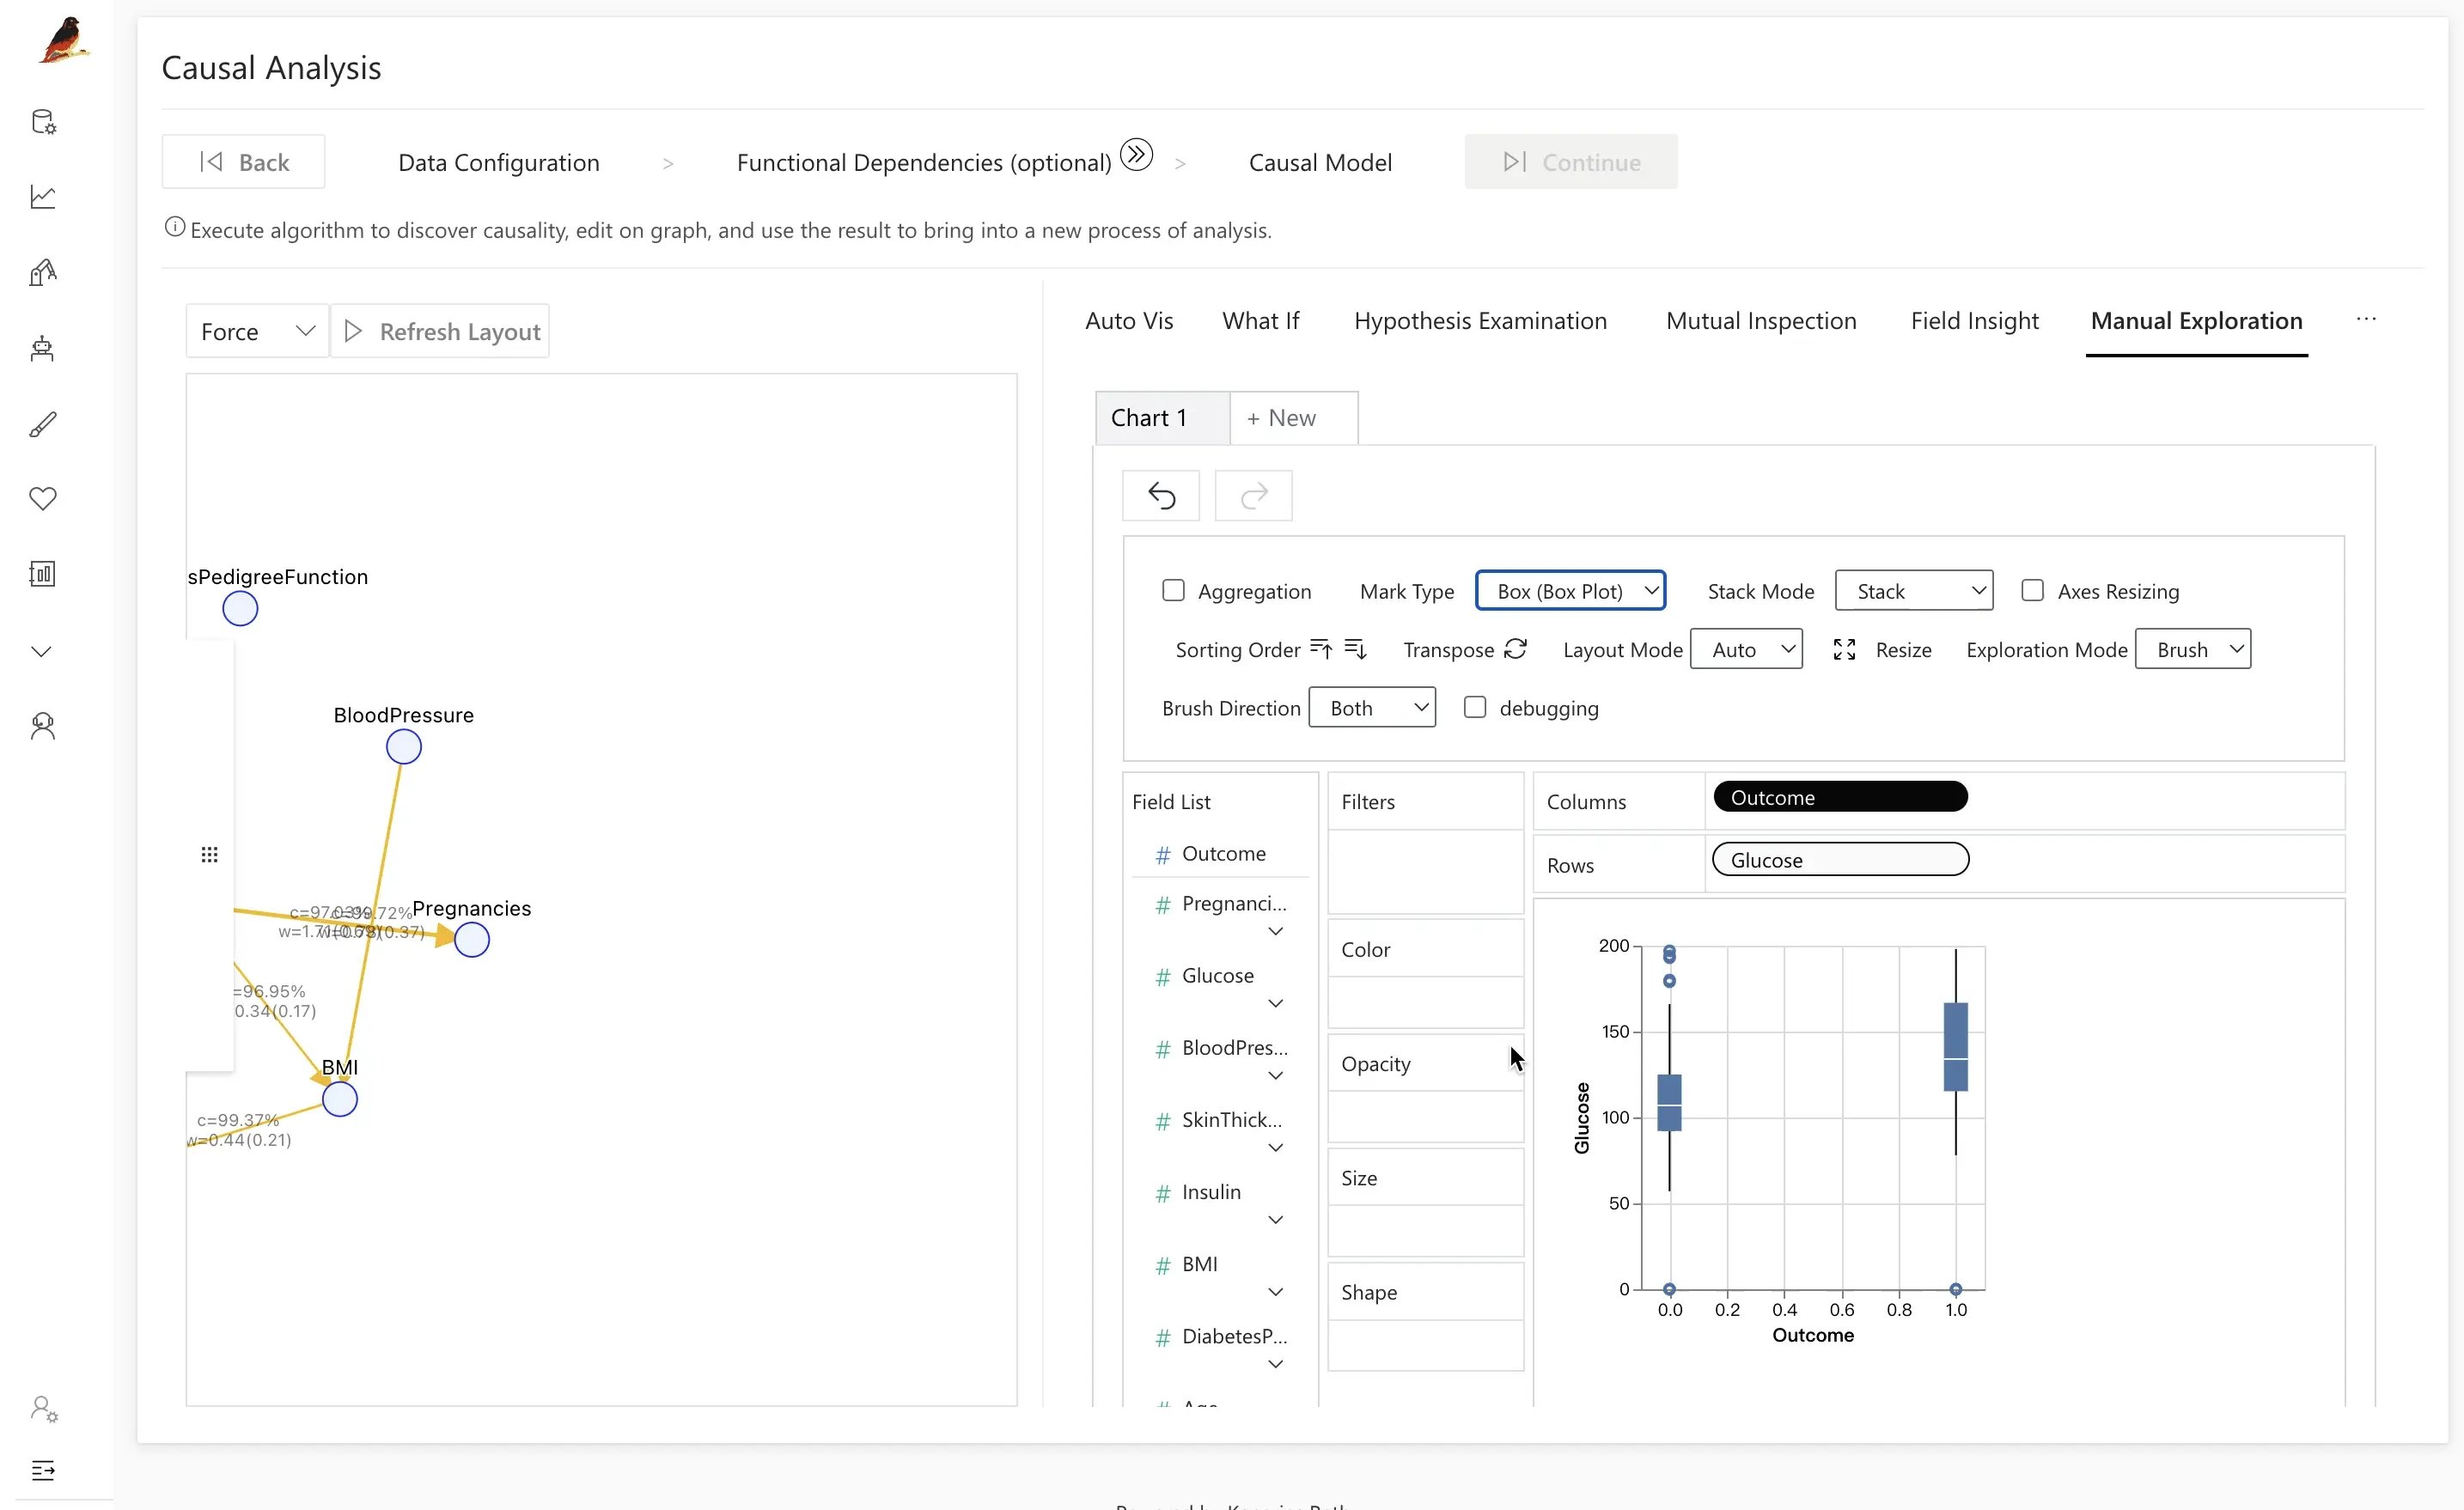
Traditional analysis often stops at correlation or feature importance, which can miss how a variable exerts its influence. By incorporating Causal Analysis, RATH helps uncover these mechanisms and reveal when an apparent effect is partly explained by another variable.
For example, after introducing Insulin between Outcome and Glucose:
- When controlling for different
Insulinintervals, the difference in insulin between diseased and healthy groups may disappear. - This suggests that the direct relationship between
OutcomeandGlucoseis weaker than it first appears, once the influence ofInsulinis taken into account.
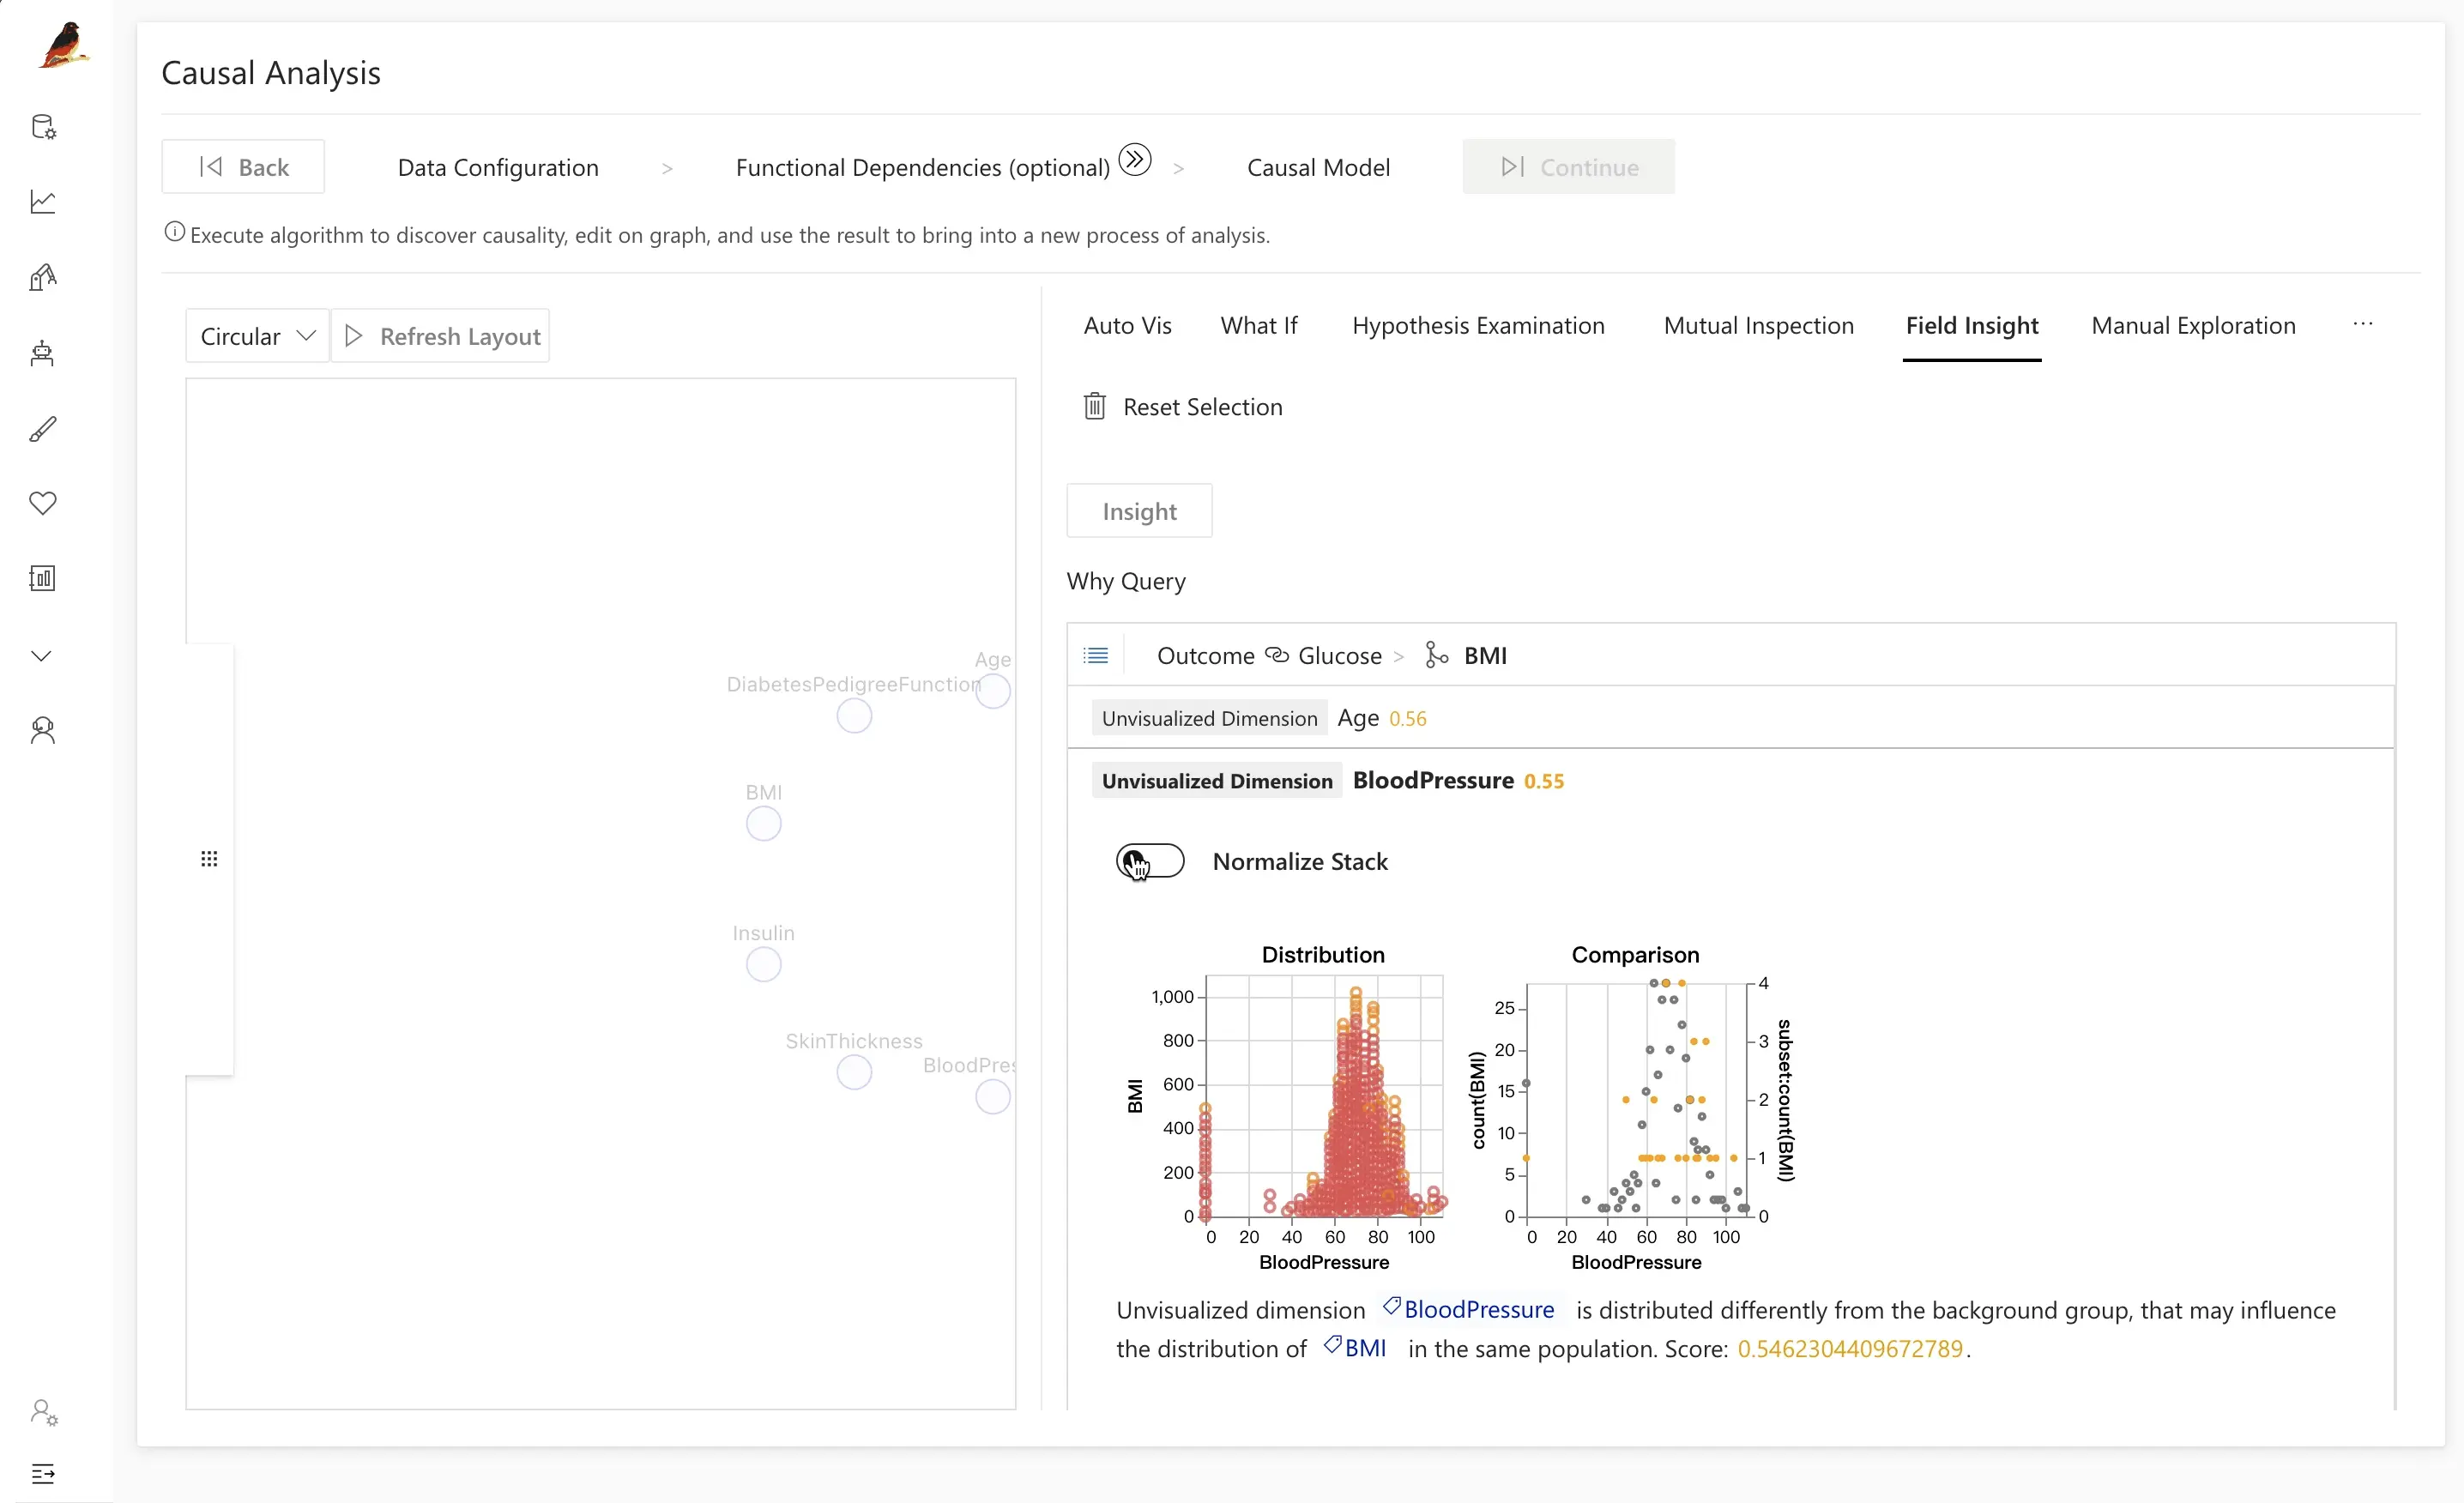
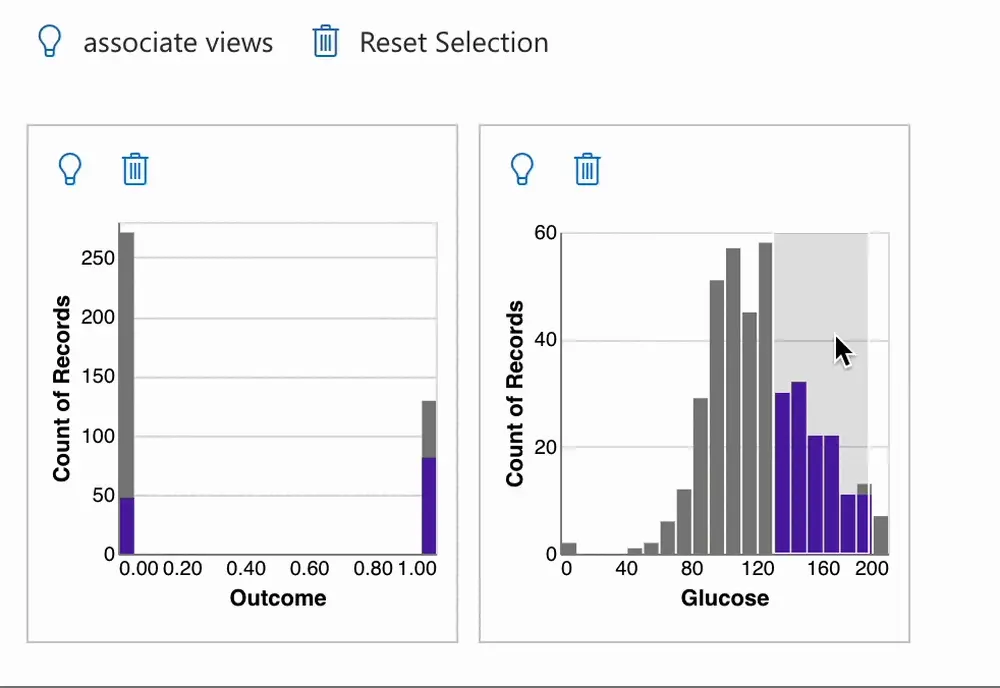
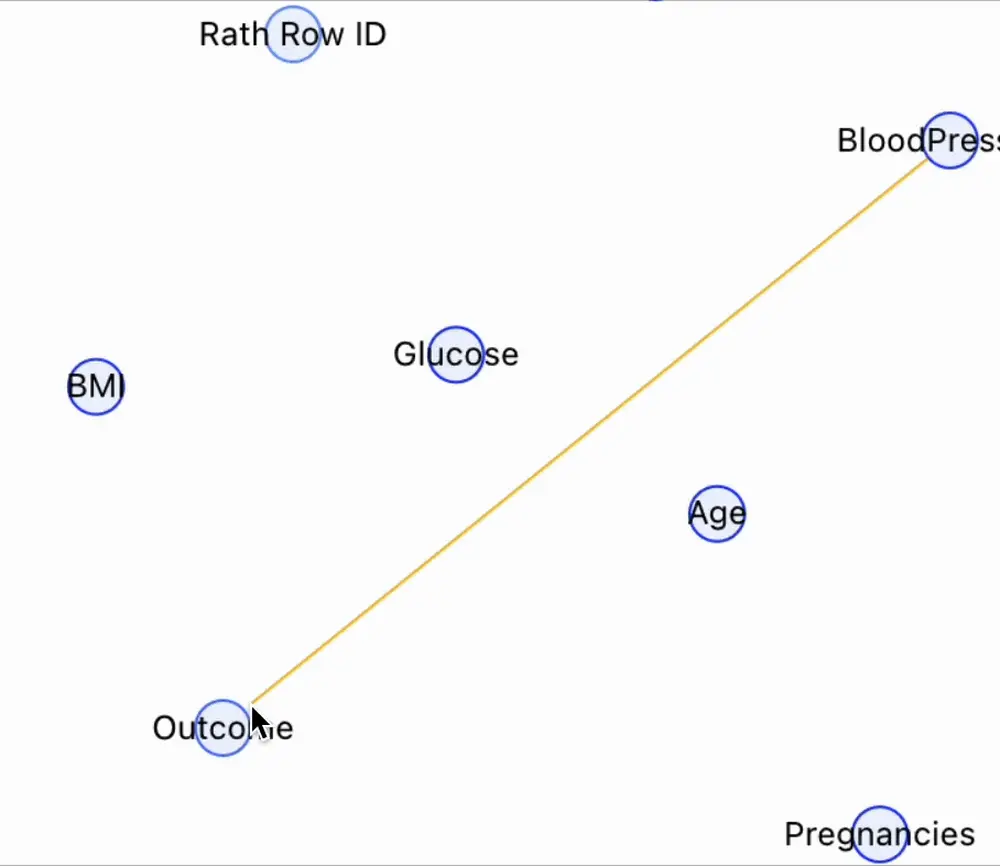
Step 3.3: Mutual Inspection
The Mutual Inspection tool provides another way to inspect causal relationships and verify assumptions.
How it works:
- Click a node in the causal graph to add its distribution to the verification module on the right.
- For example, to explore the relationship between
GlucoseandOutcome, add both variables. - Select a range of
Glucose, drag the range, and observe how the distribution ofOutcomechanges.
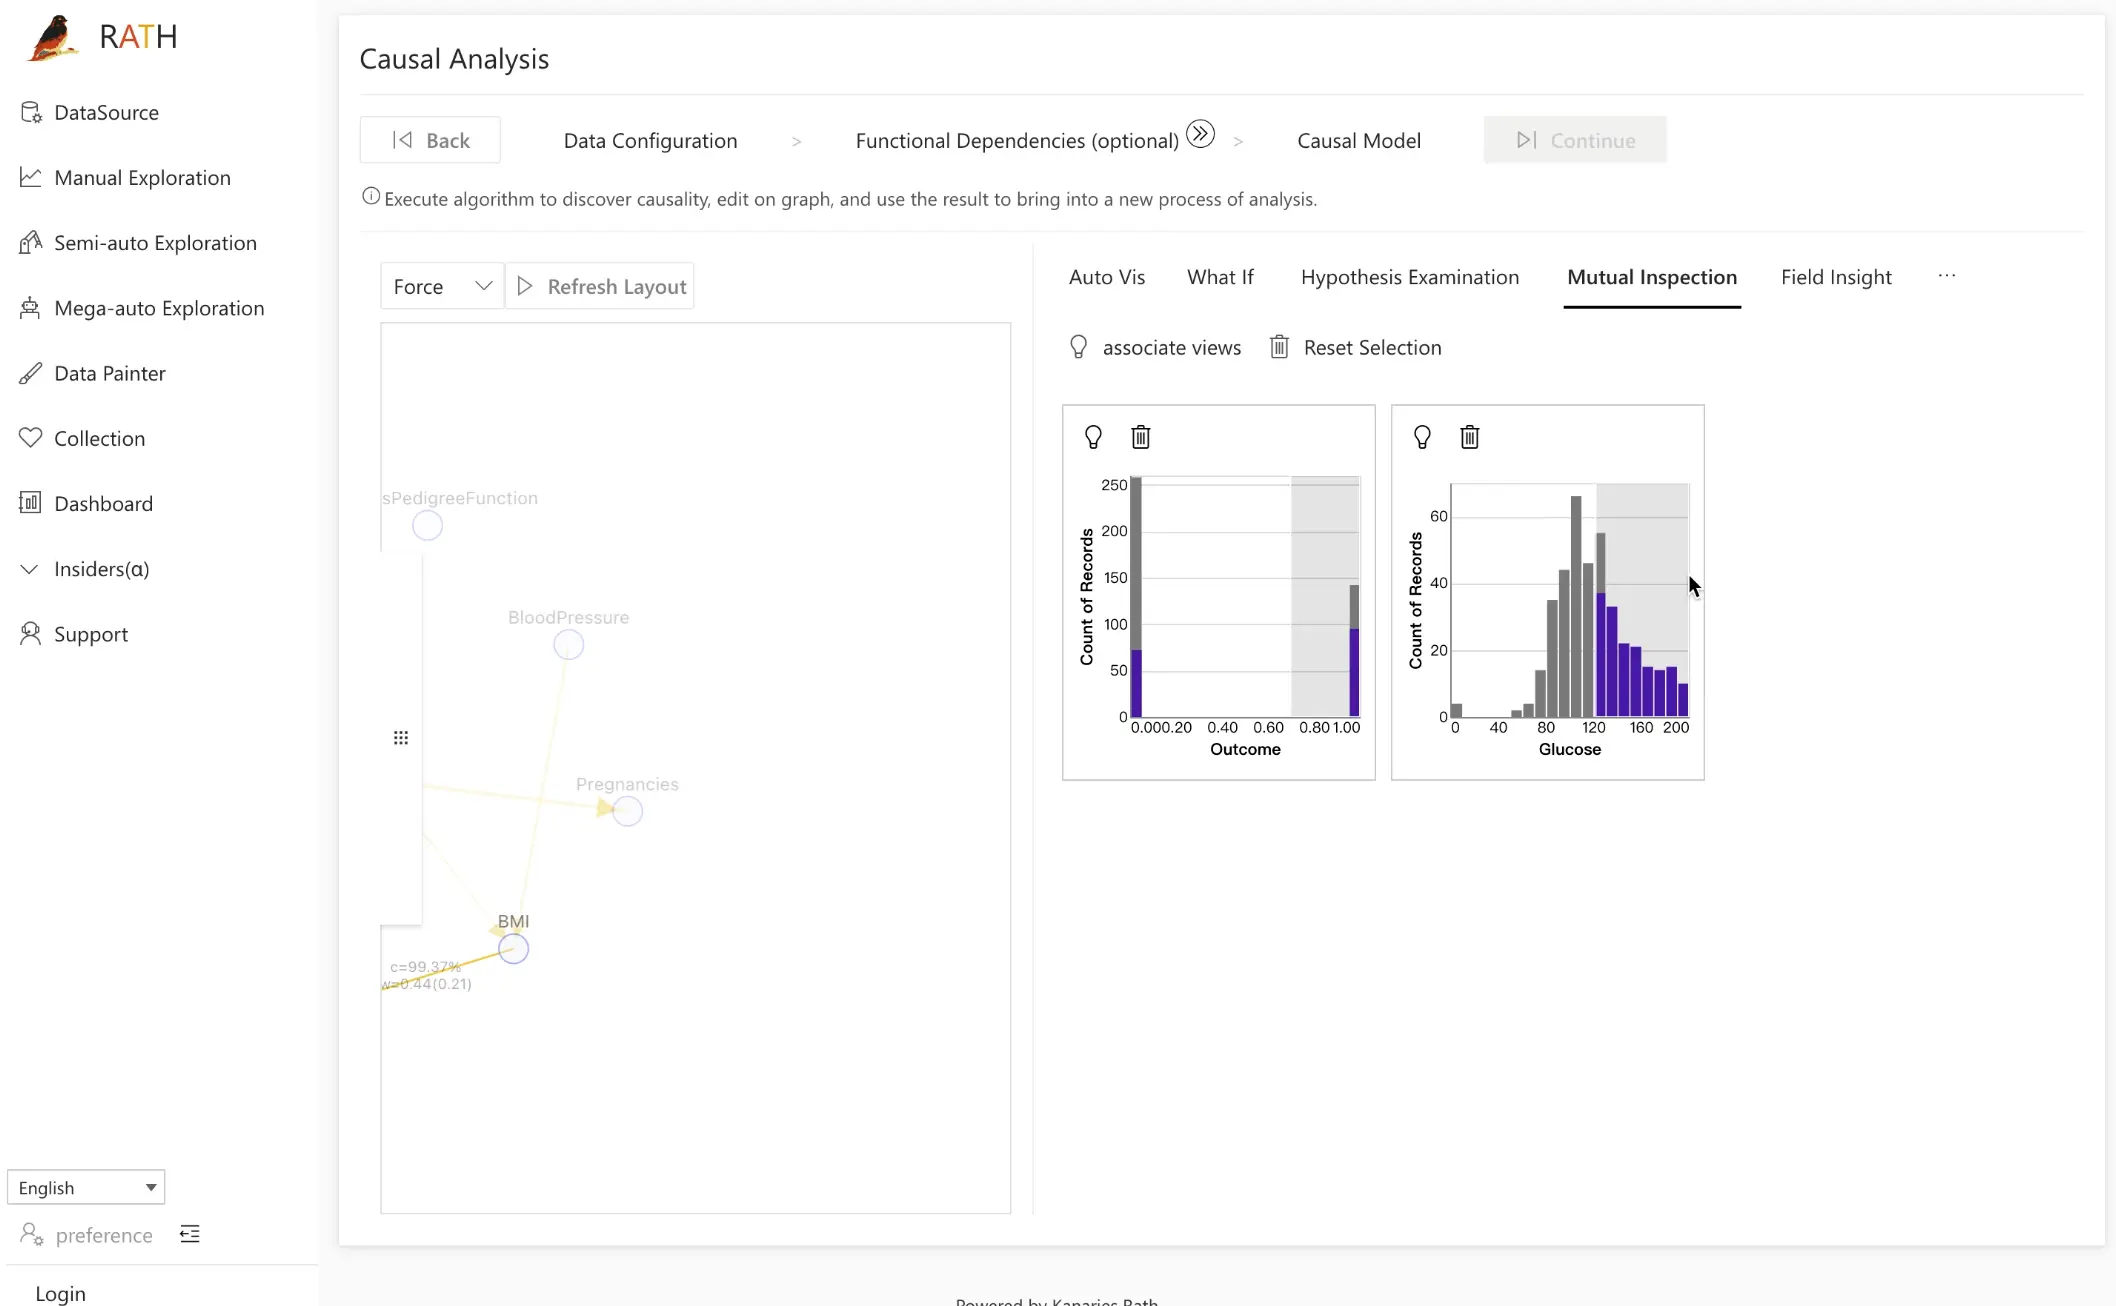
By sweeping through different glucose levels and watching the outcome distribution respond, you can visually confirm a positive correlation and how strongly it holds across the data.
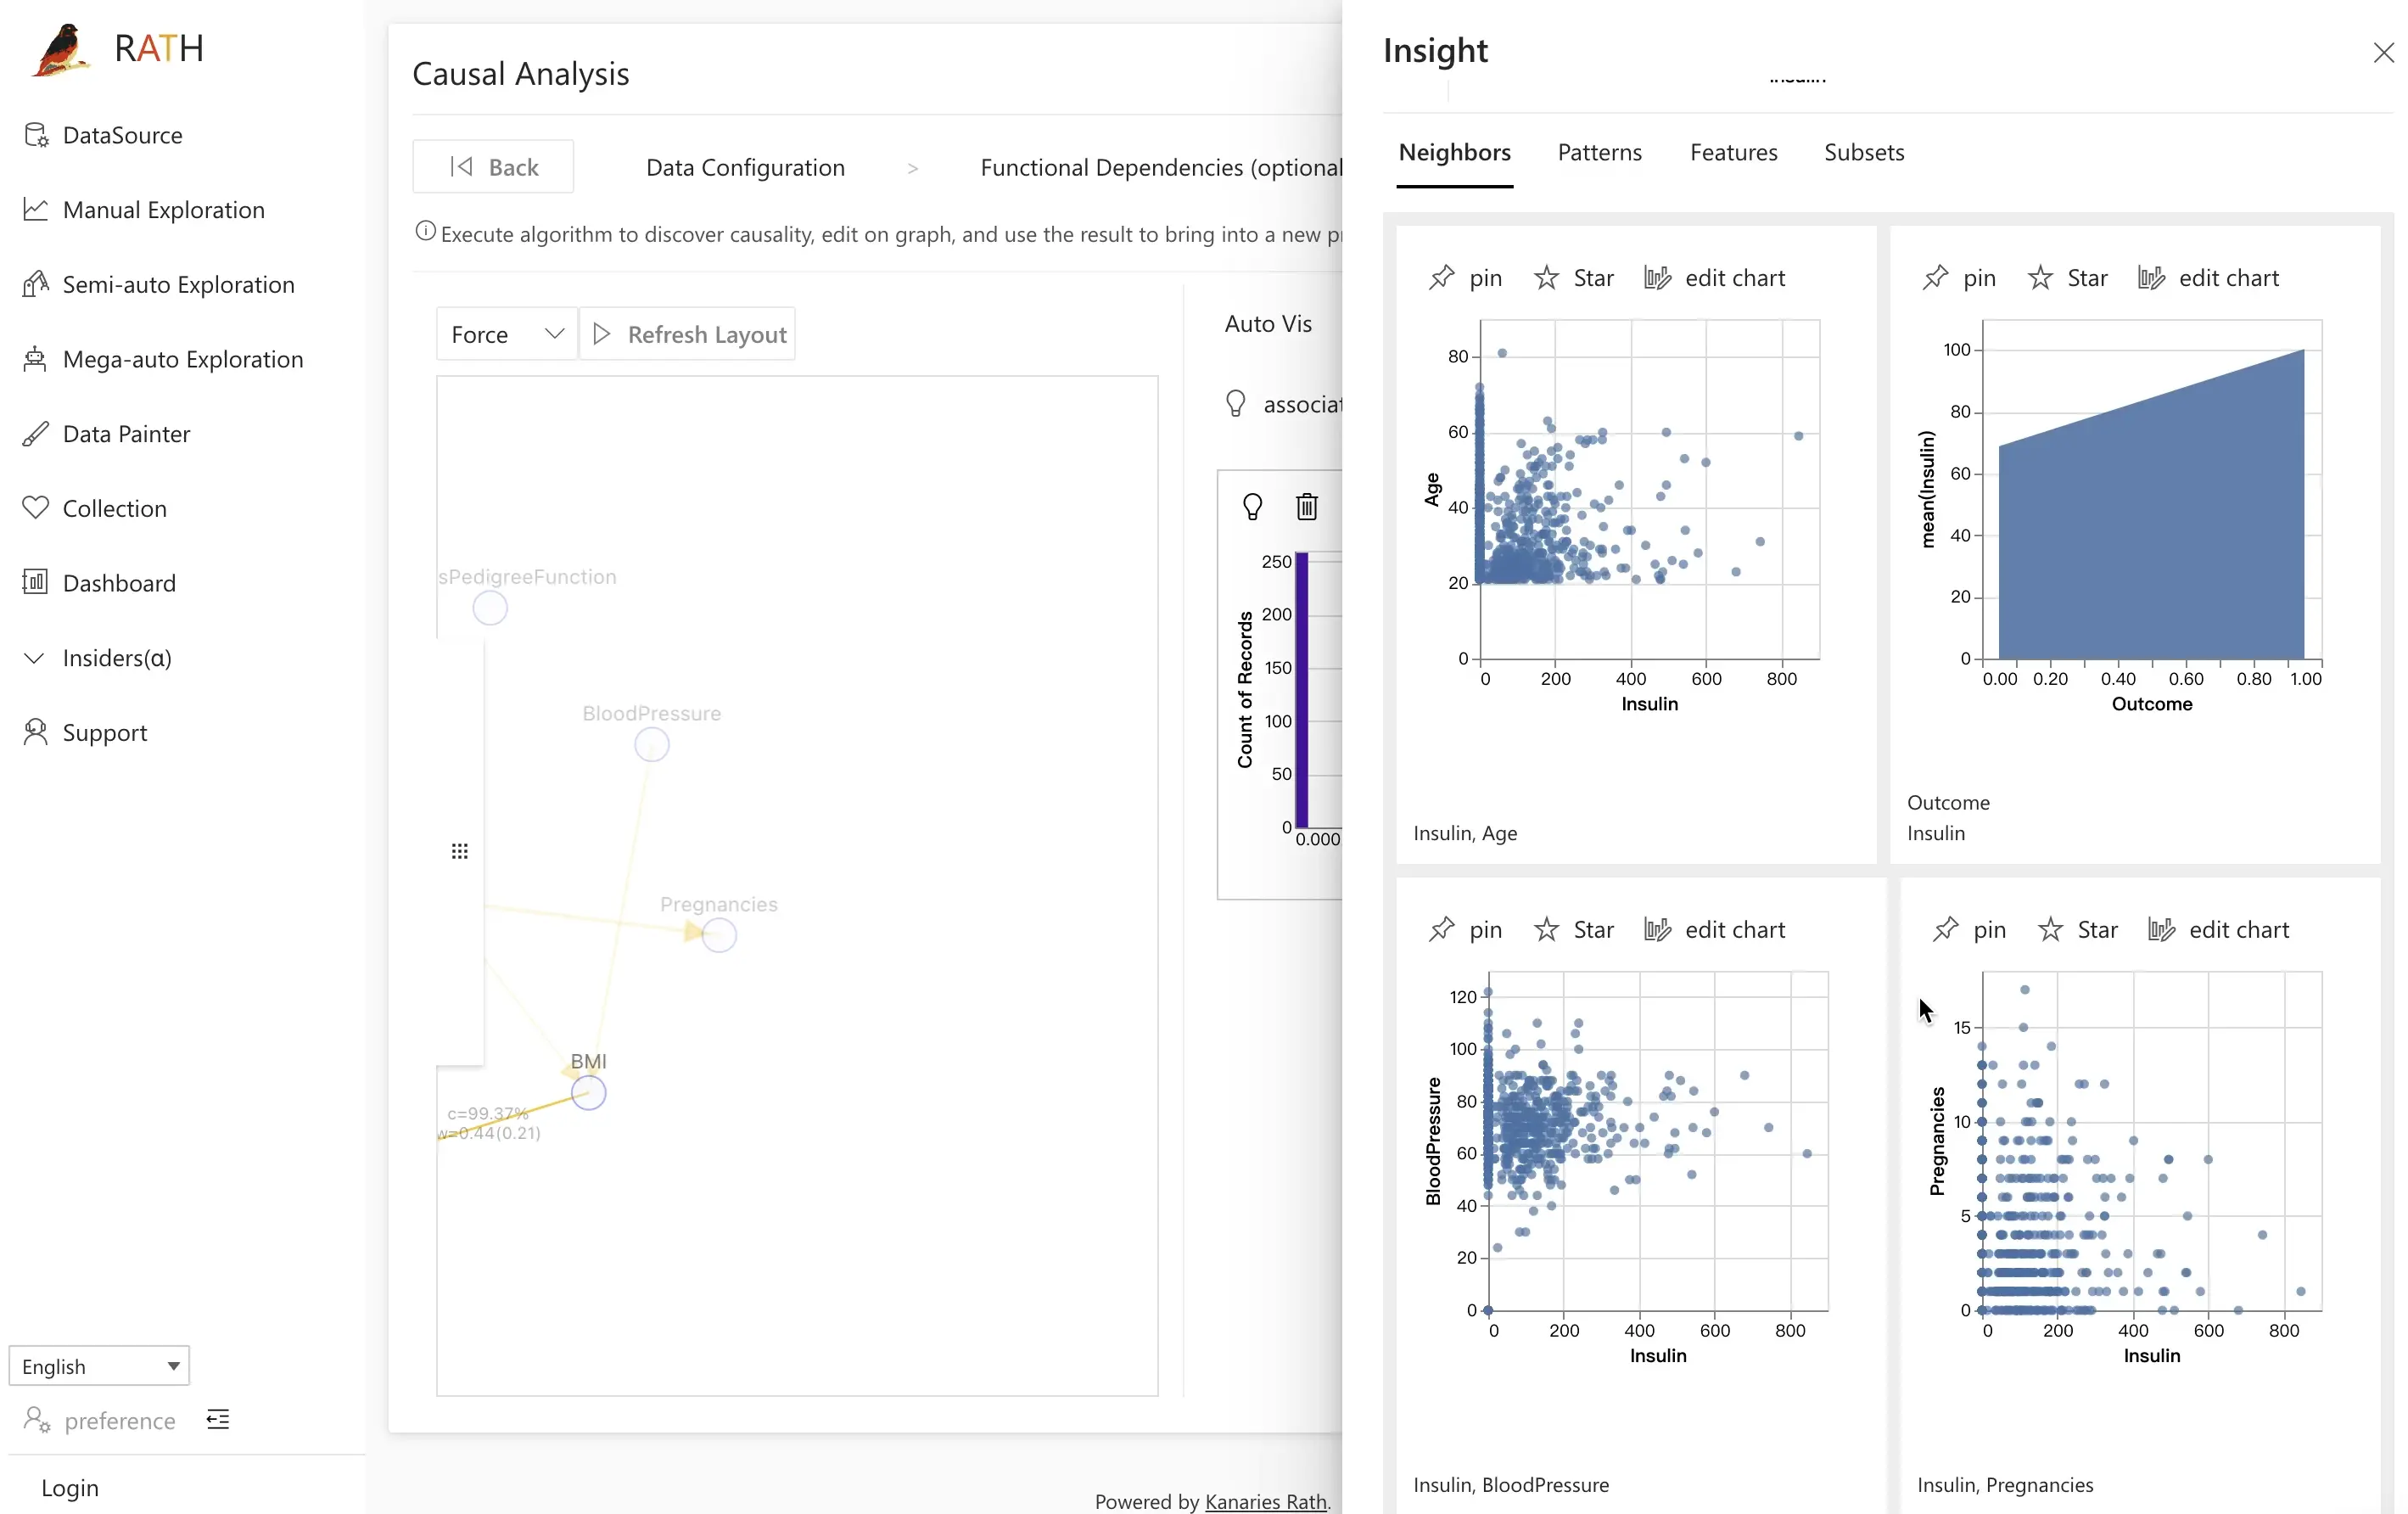
To go further, click associate views to enable Semi-auto Exploration. RATH will recommend scatter plots and other views that highlight possible relationships between the selected variables, helping you discover additional patterns faster.
Step 3.4: Prediction Test
Once you have a causal model, you can turn it into a predictive machine-learning model and evaluate its performance with Prediction Test.
- Click the
Outcomevariable in the causal graph.
RATH automatically constructs a simple classification or regression model using causal parents and related variables.
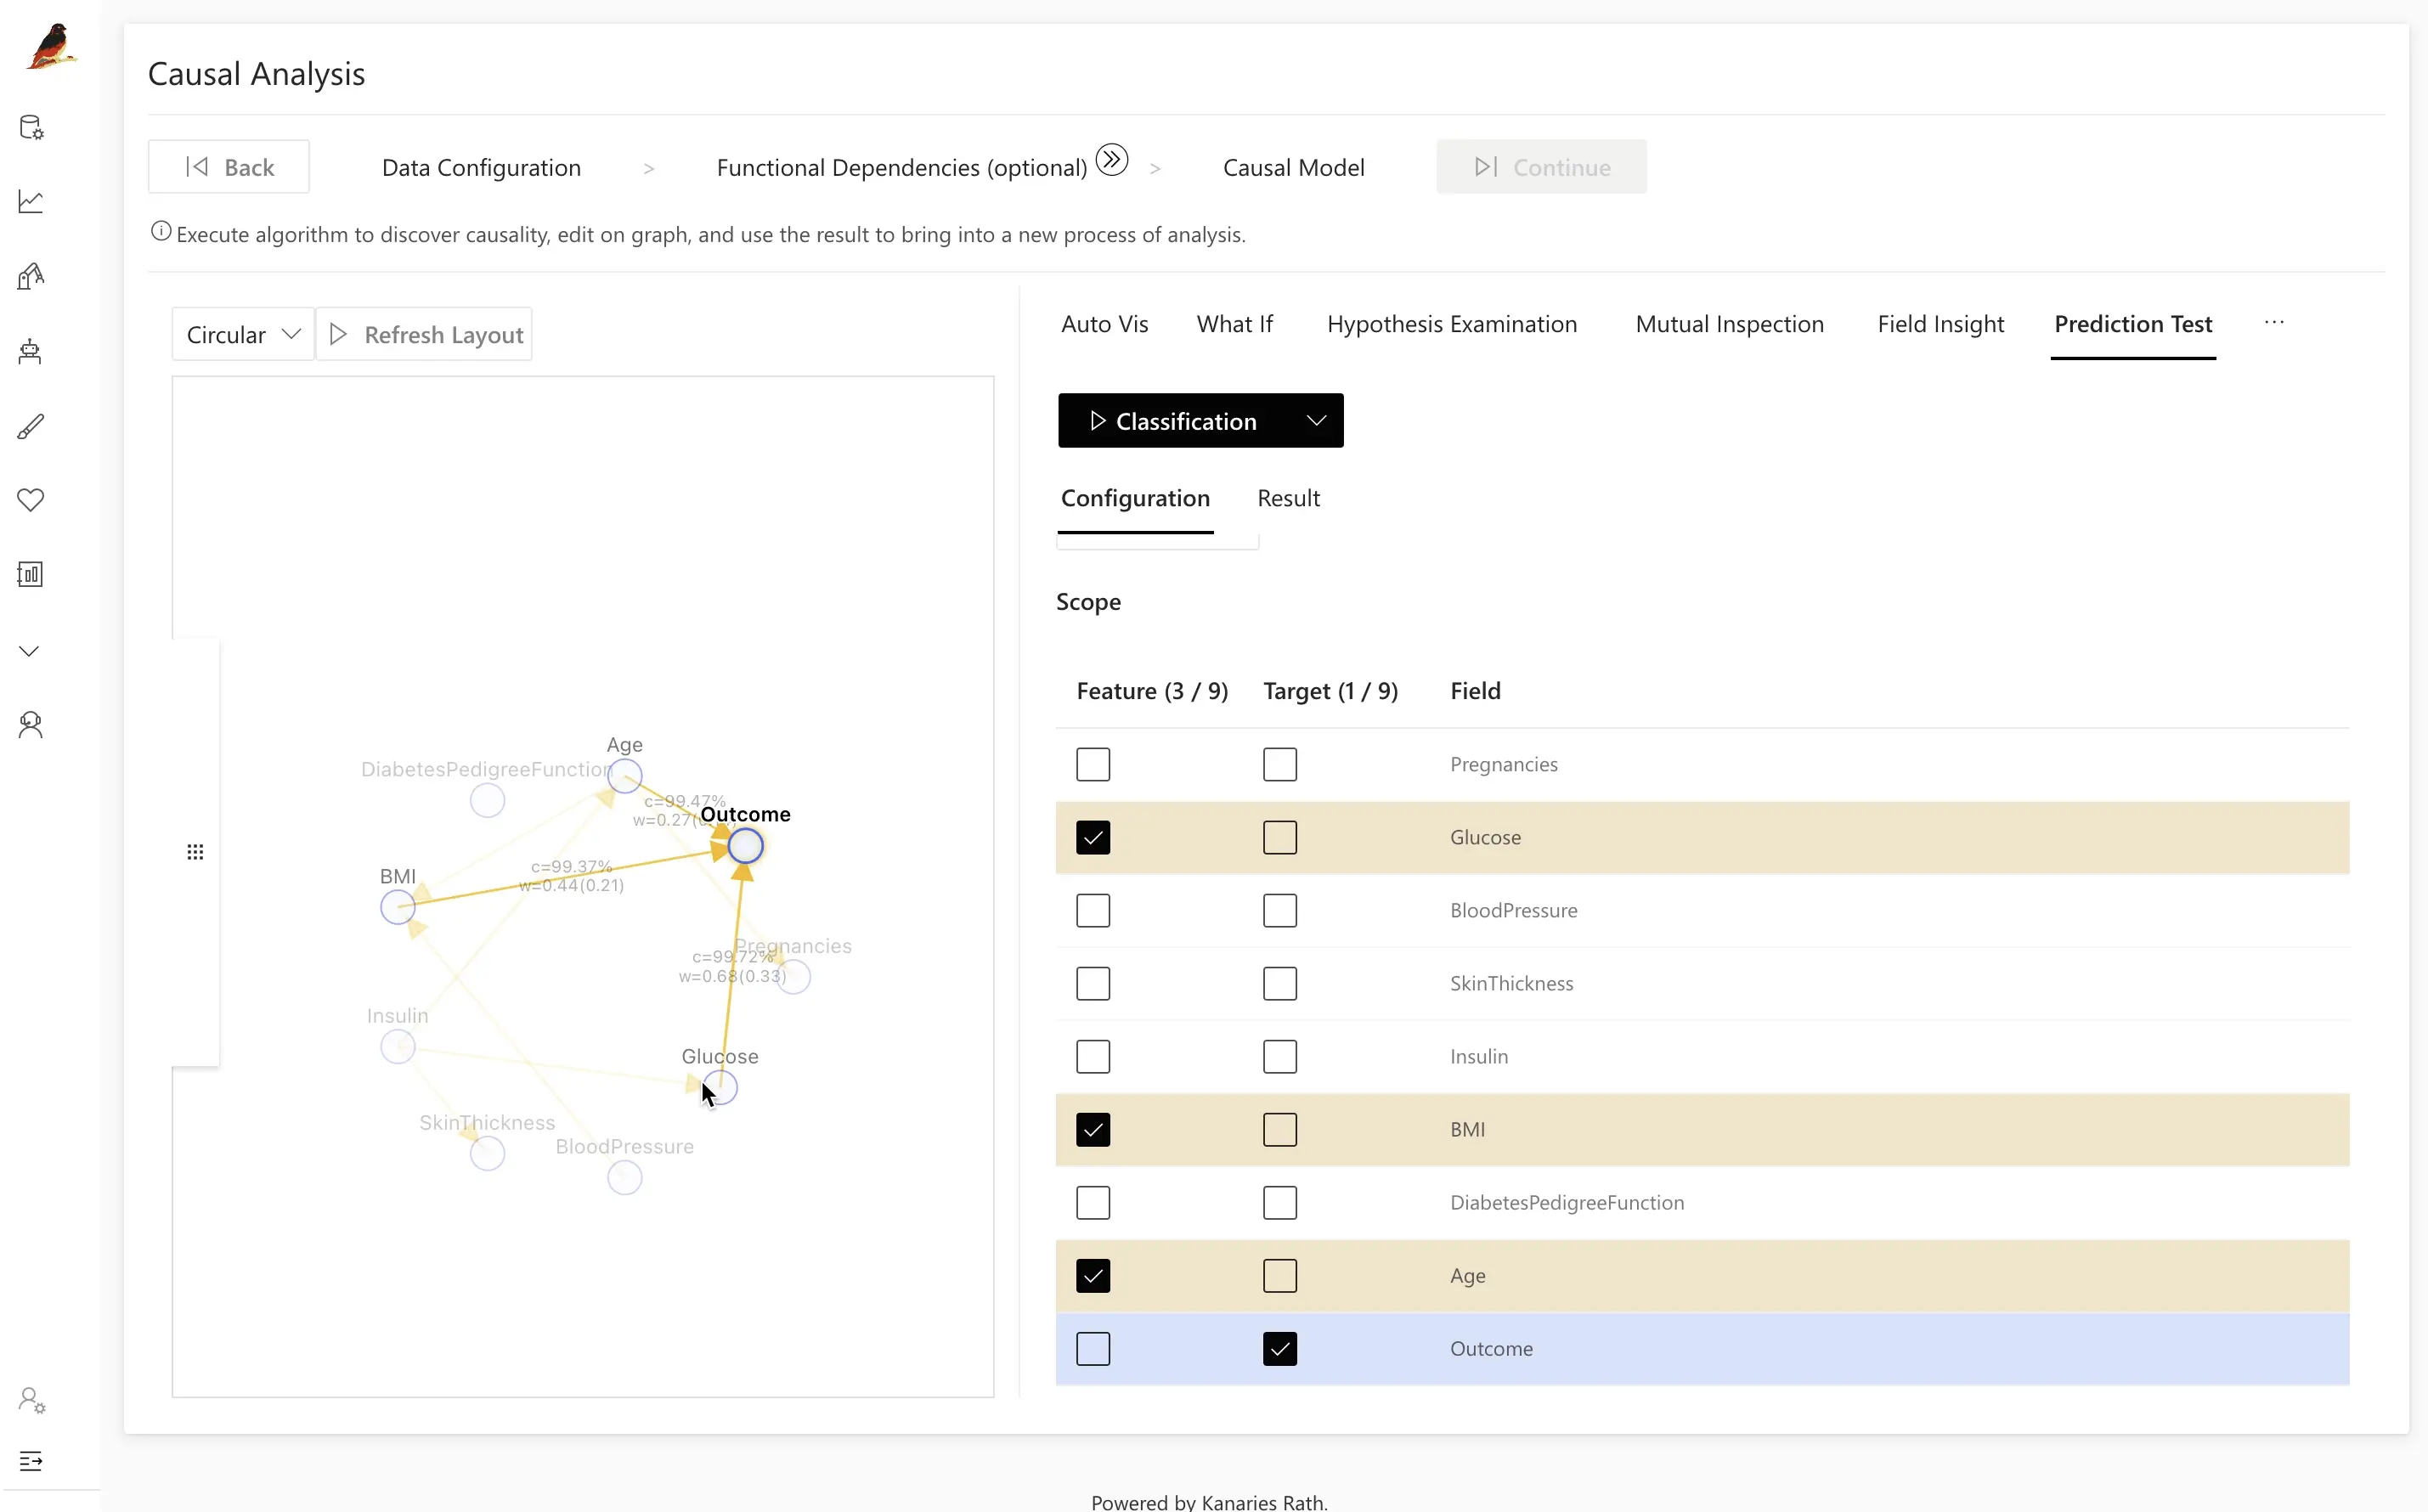
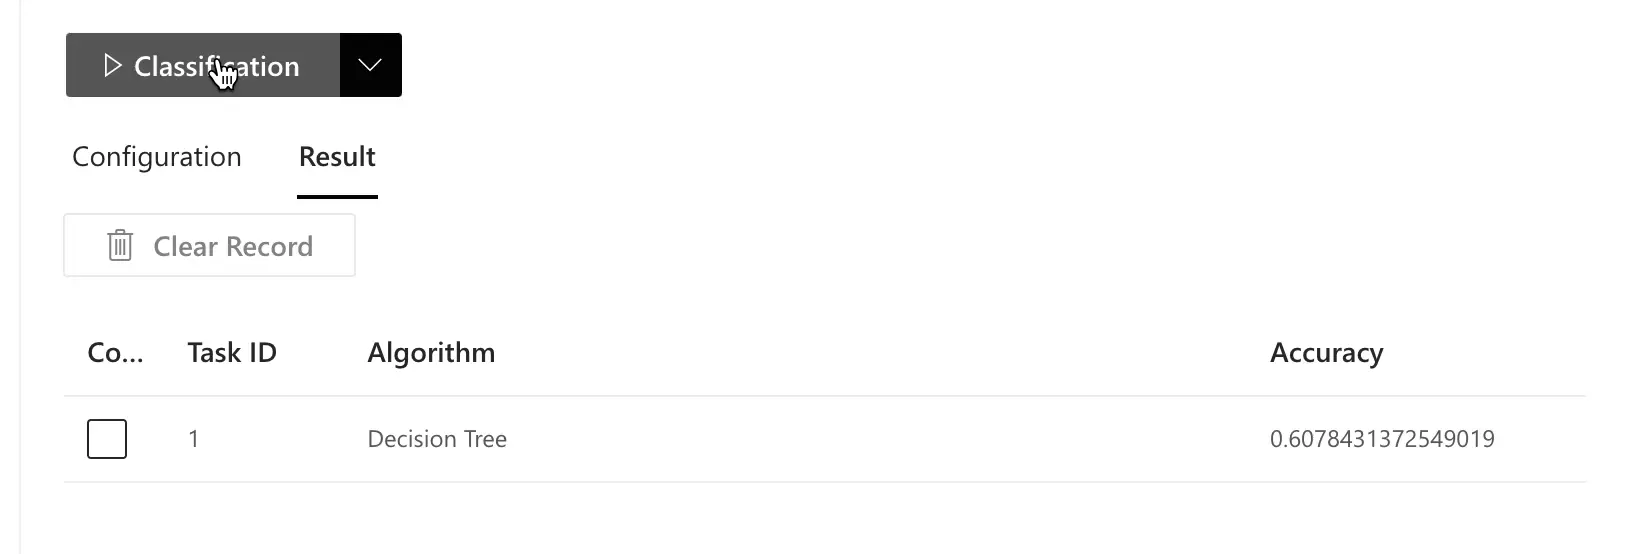
- Click Classification to train the model and compute its Accuracy (and other metrics, depending on configuration).
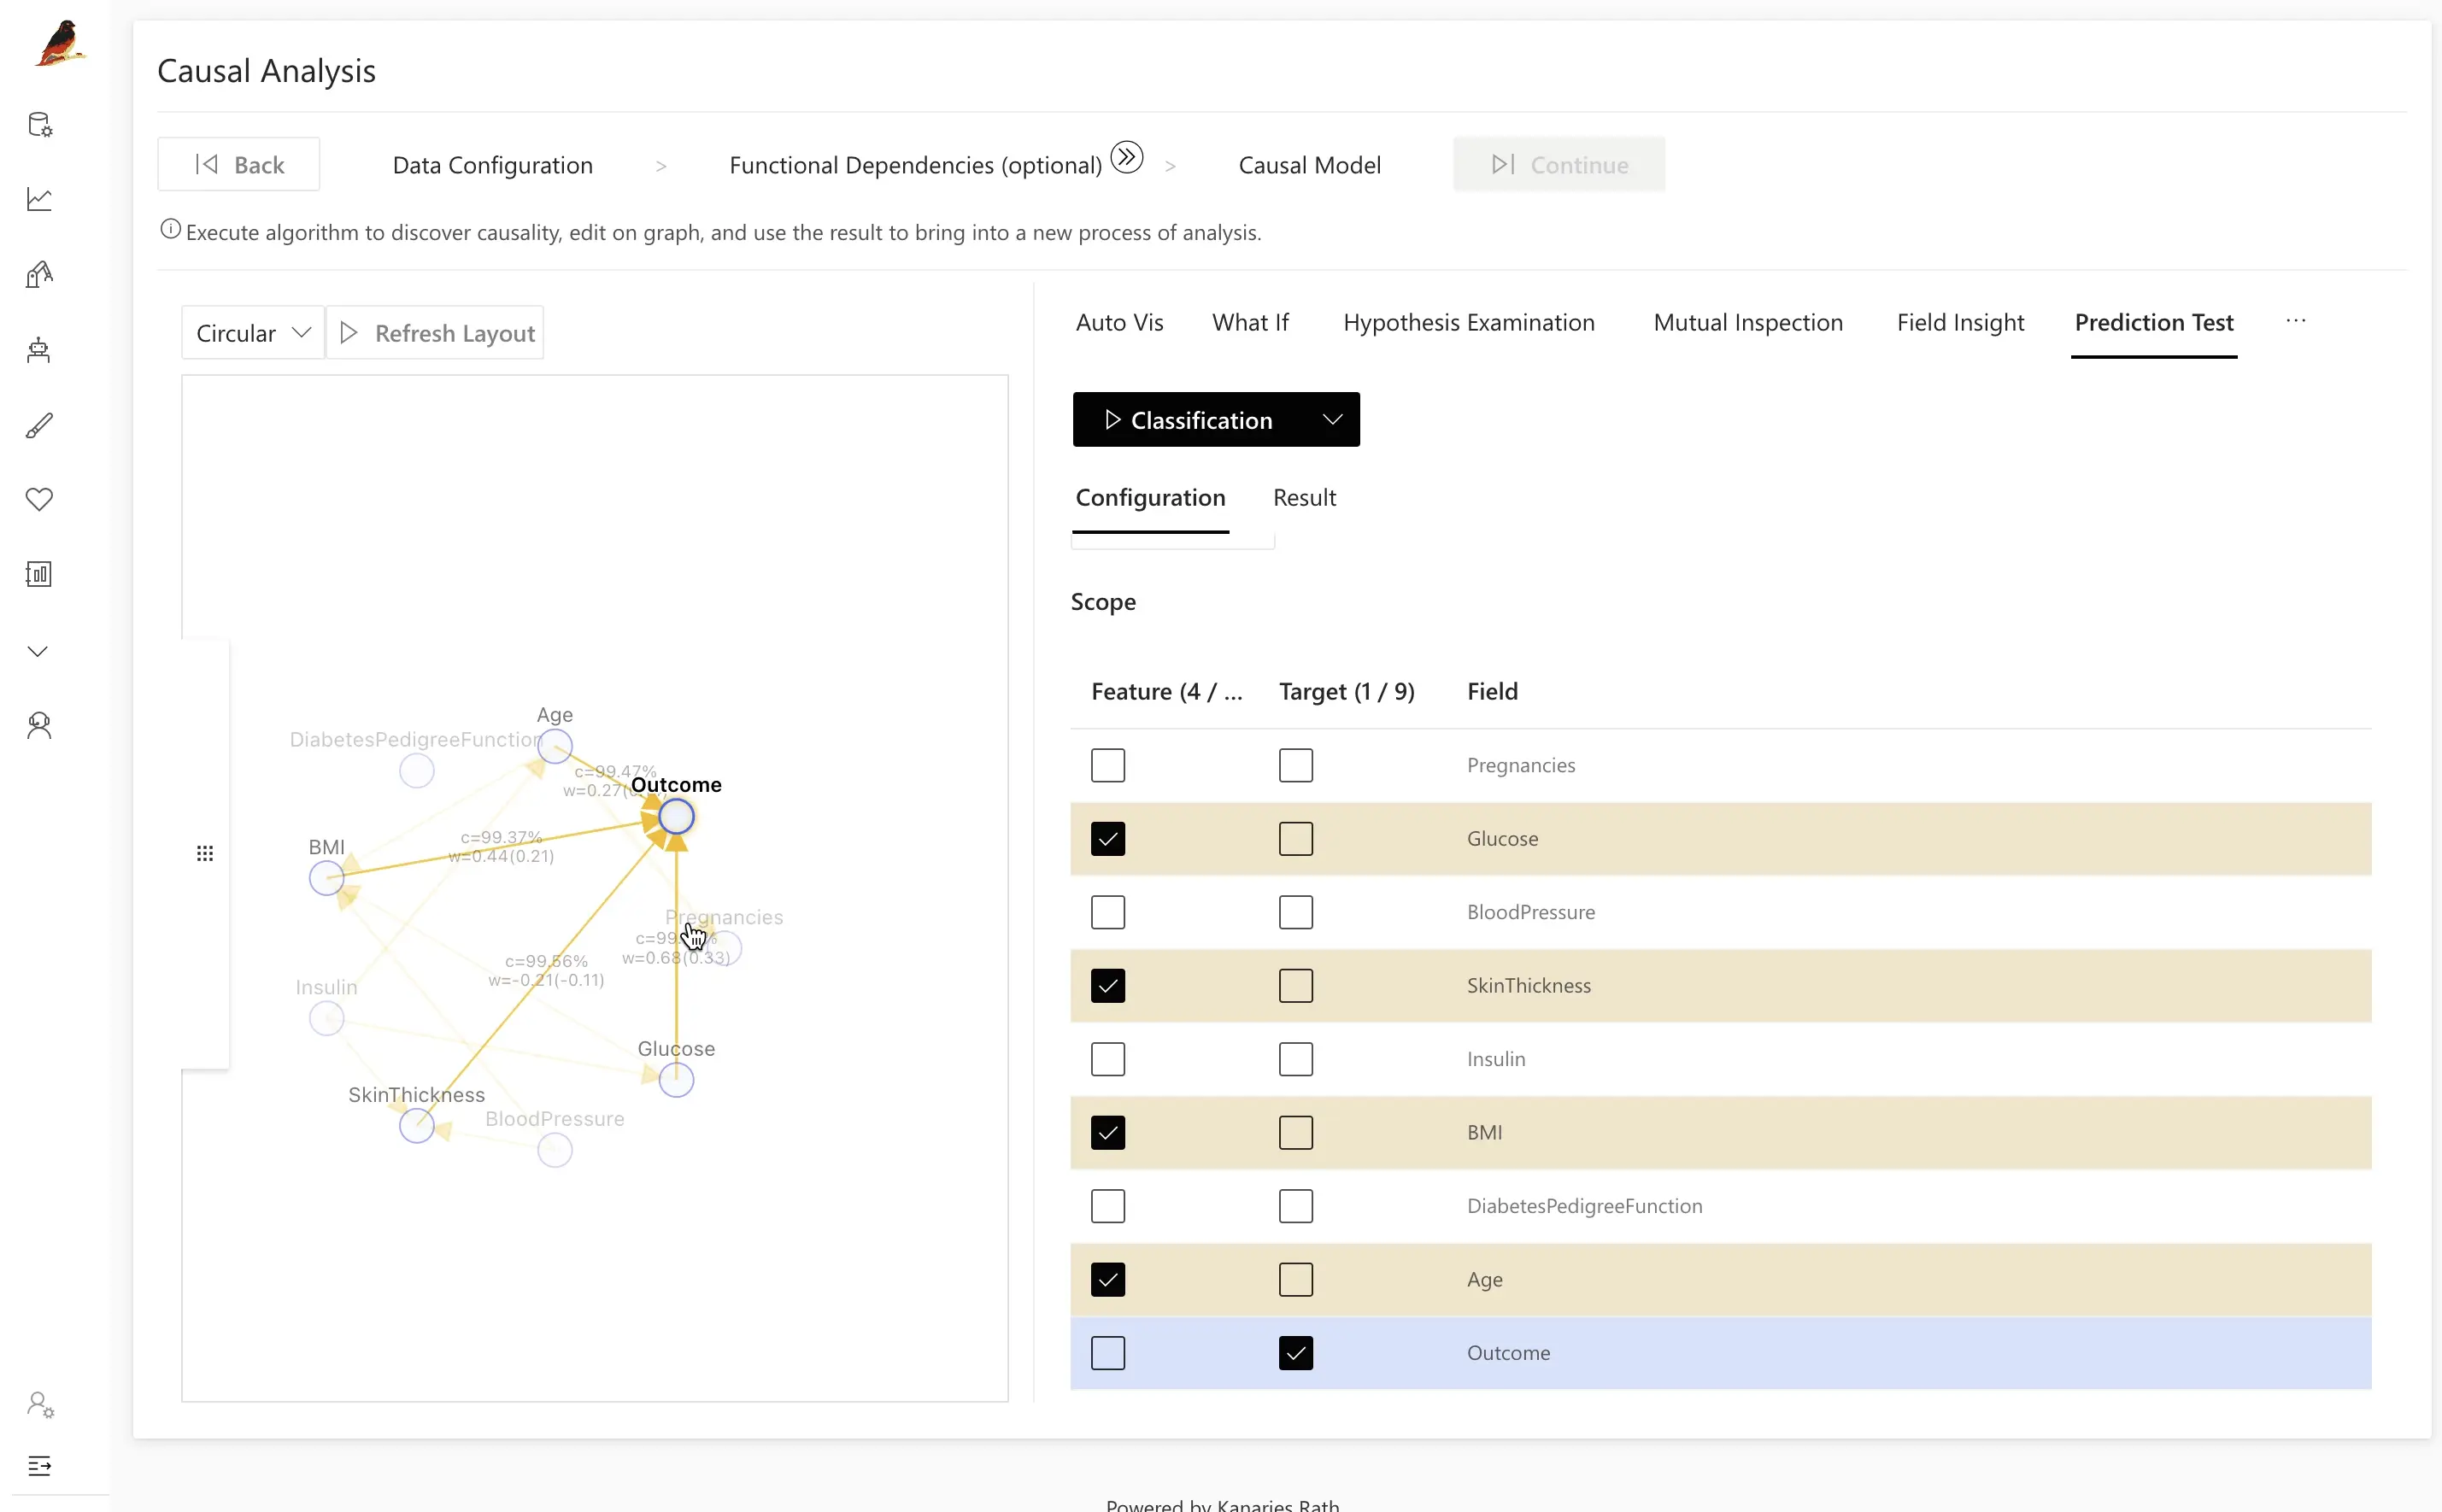
- Adjust your testing strategy:
- Use the causal graph to select more efficient or interpretable feature sets.
- Compare models built from causal features vs. arbitrary feature subsets.
For example, you can deliberately build a competing model that avoids the features suggested by RATH’s causal analysis and then compare the results:
Typically, the model guided by the causal graph achieves higher accuracy and better generalization than naive feature selection:
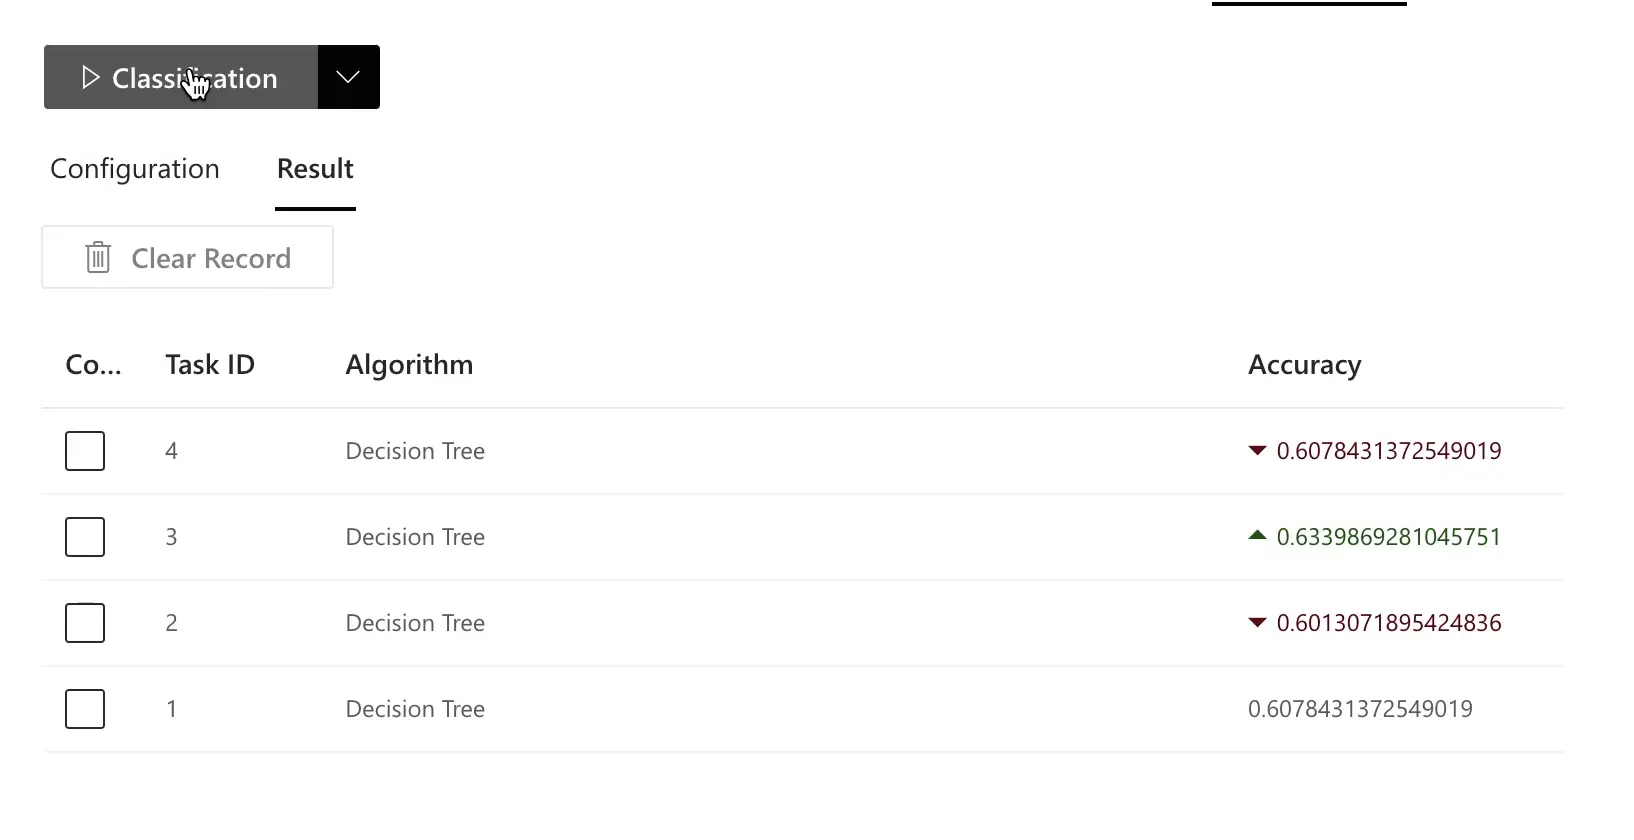
RATH is particularly well-suited for large, high-dimensional datasets with many variables. Causal analysis helps you identify better features automatically, leading to more accurate and more interpretable machine-learning models.
Edit causal model
Real-world data is messy. Sometimes RATH’s automatically generated causal graph may not fully match your domain knowledge due to:
- Data noise
- Insufficient sample size
- Missing variables
- Known constraints that the algorithm cannot infer
In these cases, you can directly edit the causal model.
- Open the panel on the left.
- Turn on Modify Constraints.
Then:
- Drag and drop nodes to add, remove, or re-orient edges.
- Encode domain knowledge (for example, “variable A cannot be caused by variable B”).
- Let RATH regenerate new causal models that respect your constraints.
This tight loop between automatic discovery and manual refinement helps you converge on a causal model that is both statistically plausible and aligned with expert understanding.
Next steps
Once you have a causal model, you can go further with RATH:
- Learn what-if style causal analysis by exploring the What-if Analysis chapter. You’ll simulate interventions (e.g., “What happens to
Outcomeif we lowerGlucoseby X?”) directly on the causal model. - Discover patterns in text fields with Text Pattern Extraction, then feed those extracted features back into causal analysis.
RATH is also evolving toward more narrative, text-based explanations of causal models — automatically generating insights and decision-making suggestions directly from the structure and estimates in your causal graph.
By combining visual causal discovery, interactive exploration, and predictive modeling, RATH turns your datasets into actionable, explainable insights — not just static dashboards.