How to Make Charts in Notion: Unleashing the Power of Data Visualization
If you want a quick first draft in RunCell, start with a prompt like this:
Create a segmented bar chart from the data
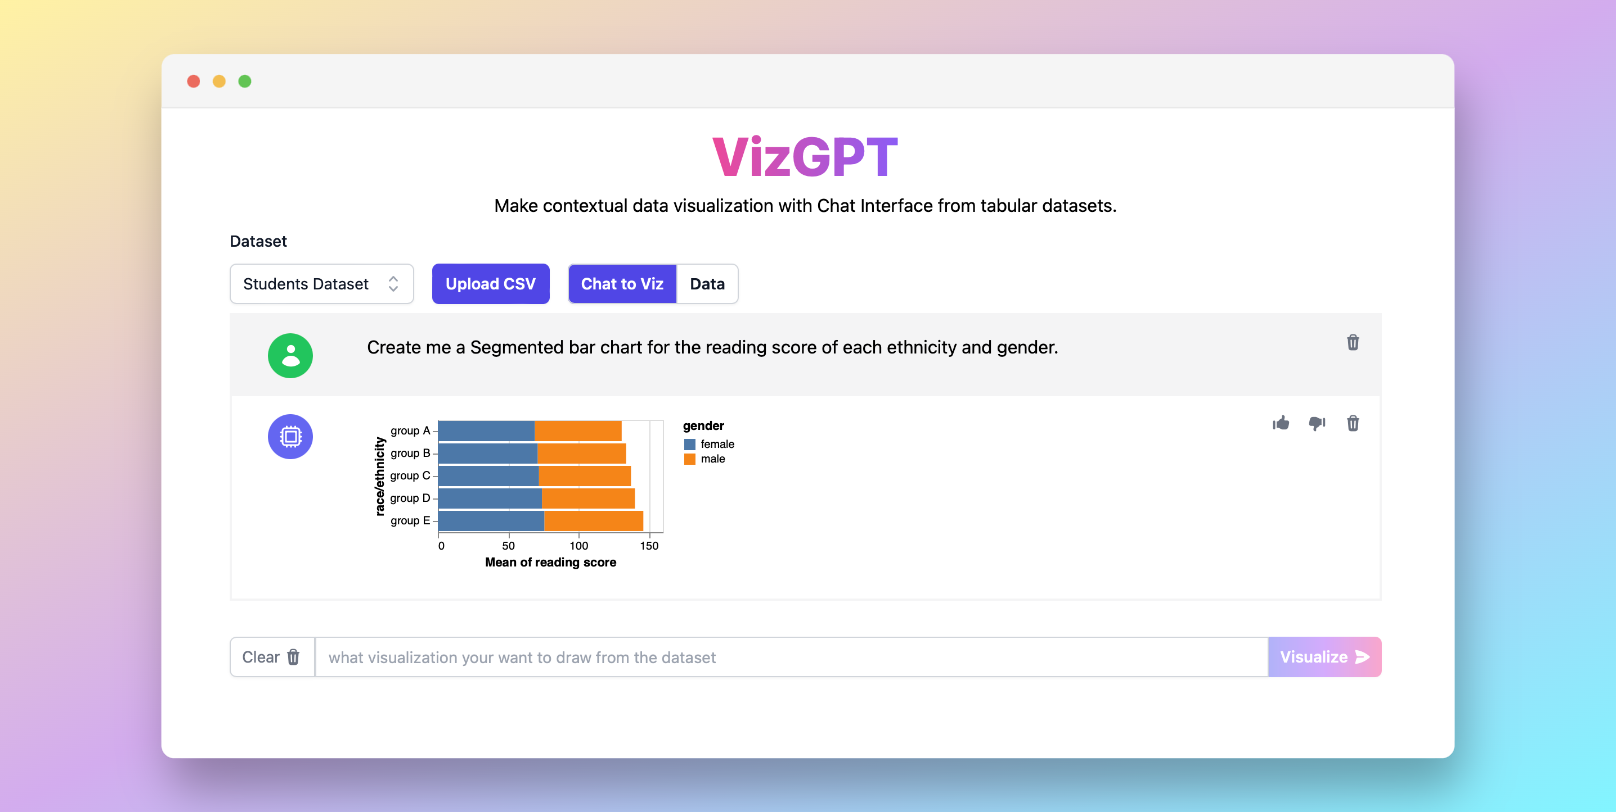
You can draft the chart in RunCell first, then download it and paste it into Notion.
If you want to start from your own CSV instead of the sample data, use RunCell first and export the chart once it looks right.
Introduction
Data visualization has emerged as a crucial component in understanding complex data patterns, trends, and insights. One platform that is increasingly becoming popular for data organization and visualization is Notion. In this article, we’ll explore how to make charts in Notion and utilize a powerful tool known as RunCell to simplify the process.
How to Make Charts in Notion by Using RunCell
RunCell is an AI-assisted notebook tool that helps you turn datasets into charts quickly, then keep refining the result in Jupyter if needed.
Here are the simple steps to use RunCell:
- Upload your CSV file to RunCell.
- Use a prompt to specify the kind of chart you want to create.
- Press the Visualize button and let RunCell handle the rest.
- Download the chart and import it to Notion.
If you want to keep refining the chart before exporting it, continue working in RunCell (opens in a new tab).
How to Make Charts in Notion
As a powerful, multi-faceted tool, Notion offers numerous ways to create and embed charts, making data visualization more accessible and straightforward. Whether using Notion's built-in database views or leveraging external integrations like Google Charts, ChartBlocks, Plotly, or RunCell, you can create detailed, interactive, and engaging charts in Notion with ease. This guide will walk you through each method, providing steps and examples to enrich your understanding.
Leveraging Notion's Built-in Database Views for Simple Charts
Notion's built-in database views provide an intuitive way to create simple charts like Kanban boards, list views, and table views. These options are beneficial for tasks, project management, or visualizing simple datasets.
Creating a Kanban Board
Kanban boards are great for visualizing workflows. Here's how to create one:
- Create a new page in Notion and select 'Board' from the database options.
- Customize your board by adding columns, which represent different stages in your workflow.
- Add items to each column, which represent individual tasks or data points.
Creating a List View
List views are perfect for managing lists or tasks. Here's how to create one:
- Create a new page and select 'List' from the database options.
- Customize your list by adding properties to each item.
Creating a Table View
Table views are ideal for managing and visualizing data in tabular format. Here's how to create one:
- Create a new page and select 'Table' from the database options.
- Customize your table by adding columns (properties), which represent different data fields.
Harnessing Third-Party Integrations for Advanced Charting
For more intricate visualizations, you can utilize third-party tools like Google Charts, ChartBlocks, or Plotly, then embed the resulting charts in Notion.
Google Charts
Google Charts offers a wide range of charts and data tools. To embed a Google Chart in Notion:
- Create your chart using Google's Chart Editor.
- Click 'Publish' and copy the embed code.
- In Notion, create an 'Embed' block (
/embed), paste the code and press 'Embed'.
ChartBlocks
ChartBlocks is a powerful chart builder. To embed a ChartBlocks chart in Notion:
- Create your chart in ChartBlocks.
- Go to the 'Share' tab and copy the embed code.
- In Notion, create an 'Embed' block and paste the code.
Plotly
Plotly offers intricate and interactive data visualizations. To embed a Plotly chart:
- Create your visualization in Plotly.
- Go to the 'Share' tab and copy the iframe code.
- In Notion, create an 'Embed' block and paste the iframe code.
Frequently Asked Questions
Q1: How do I create a chart in Notion using RunCell?
A1: Upload your CSV data to RunCell, use a prompt to define the kind of chart you want to create, and hit the 'Visualize' button. Embed the resulting chart into your Notion page.
Q2: Can I use my own data to create charts in Notion?
A2: Yes, you can upload your own data in CSV format to RunCell to create a custom chart, or use Notion's database functionality to visualize data directly.
Q3: Does RunCell require coding knowledge?
A3: No, RunCell is designed to create charts using simple text prompts. No coding knowledge is necessary.
Conclusion
Understanding how to make charts in Notion opens up a world of possibilities in data visualization. Using tools like RunCell simplifies the process and makes it accessible to everyone. So go ahead and make your data come to life in Notion!