Matplotlib 범례를 플롯 밖으로: bbox_to_anchor 치트시트


기본 범례(legend)는 axes 안에 자리 잡아 데이터를 가리는 경우가 많습니다. 바깥에 두려면 loc(범례 상자 중 어느 모서리를 앵커로 쓸지)과 bbox_to_anchor(그 앵커를 axes 좌표 어디에 둘지)를 함께 씁니다.
빠른 해결
import matplotlib.pyplot as plt
import numpy as np

x = np.linspace(0, 10, 200)
fig, ax = plt.subplots()
ax.plot(x, np.sin(x), label="sin(x)")
ax.plot(x, np.cos(x), label="cos(x)")

# Outside, upper-right of the axes
ax.legend(bbox_to_anchor=(1.02, 1), loc="upper left", borderaxespad=0)

plt.tight_layout()
plt.show()| 배치 | 대표 호출 |
|---|---|
| axes 오른쪽 | legend(bbox_to_anchor=(1.02, 1), loc="upper left") |
| 오른쪽, 세로 중앙 | legend(loc="center left", bbox_to_anchor=(1.02, 0.5)) |
| 아래, 가로 배치 | legend(loc="upper center", bbox_to_anchor=(0.5, -0.12), ncol=n) |
| 위 | legend(loc="lower center", bbox_to_anchor=(0.5, 1.02), ncol=n) |
| 잘림 없이 내보내기 | savefig(..., bbox_inches="tight") 또는 tight_layout() / constrained_layout=True |
Axes 좌표: (0, 0)은 axes 왼쪽 아래, (1, 1)은 오른쪽 위입니다. 1보다 조금 크거나 0보다 조금 작은 값은 플롯 프레임 바로 밖에 놓입니다.
- Claude Code AGENTS.md 지원: 설정 방법, 4가지 로딩 모드, Codex·OpenCode·Cursor와 한 파일 공유하기
- GPT Image 2.5 사용법: Flare·Sunburst 비교와 API 가격
- DeepSeek Harness 사용법: 설치, 설정, 첫 에이전트 실행까지
- Runcell Science: Claude Science를 대체할 오픈소스 AI 연구 워크스페이스
- 맥 잠자기 방지: 맥북 닫아도 Codex와 Claude Code 계속 실행하기
- OpenClaw vs ZeroClaw vs Pi Agent vs Nanobot: 2026년에 어떤 AI 에이전트 스택을 선택해야 할까?
- Claude Code로 Jupyter 노트북을 분석하는 방법 | Data Science 실무 가이드와 한계
- Claude Code 루틴 사용법: AI 에이전트 cron 작업과 자동 트리거
- Claude Code Desktop에서 Bypass permissions 켜는 법
- Google의 A2A 프로토콜을 사용한 두 개의 Python 에이전트 빌드하기 - 단계별 튜토리얼
- 2025년 파이썬에서 가장 성장하는 상위 10개 데이터 시각화 라이브러리
문제: 데이터가 범례에 가림
fig, ax = plt.subplots(figsize=(7, 4))
ax.plot(x, np.sin(x), label="sin(x)", lw=2)
ax.plot(x, np.cos(x), label="cos(x)", lw=2)
ax.legend(loc="best")  # still inside the axes
ax.set_title("Default legend (often overlaps data)")
plt.show()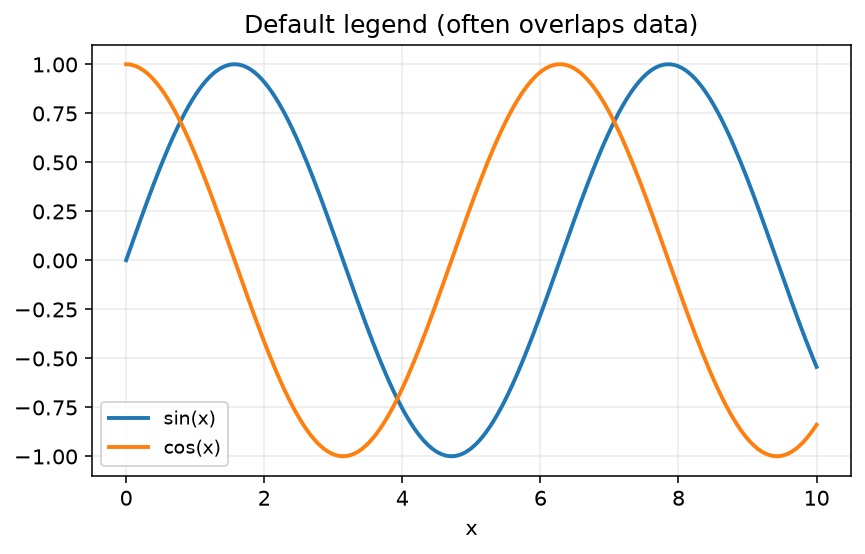
loc="best"는 안쪽에서 덜 나쁜 모서리만 고릅니다. 범례를 figure 여백으로 보내지는 않습니다.
bbox_to_anchor + loc이 함께 동작하는 방식
bbox_to_anchor=(x, y)— 기본으로 axes fraction 좌표의 점.loc="upper left"(등) — 범례 상자에서 그 앵커에 고정할 지점.borderaxespad— axes와 범례 사이 패딩. 바깥에 딱 붙이려면0.
머릿속 모델: 플롯 위의 앵커 점 + 그 점에 앉는 범례 모서리.
범례를 오른쪽으로
fig, ax = plt.subplots(figsize=(7, 4))
ax.plot(x, np.sin(x), label="sin(x)", lw=2)
ax.plot(x, np.cos(x), label="cos(x)", lw=2)
ax.legend(bbox_to_anchor=(1.02, 1), loc="upper left", borderaxespad=0)
ax.set_title("Legend outside: upper right of axes")
fig.tight_layout()
plt.show()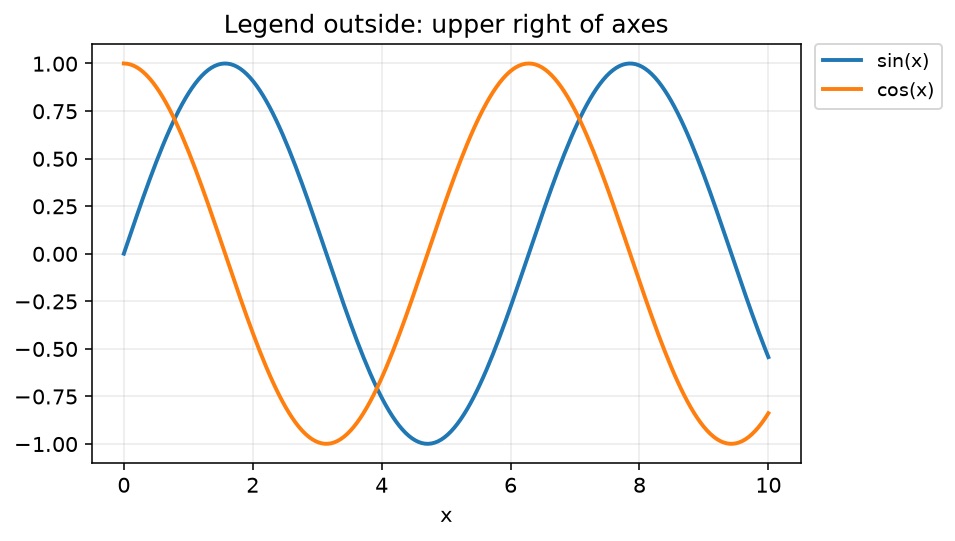
창에서 여전히 잘리면 tight_layout() / subplots에 constrained_layout=True, 또는 다음 절처럼 axes를 줄여 공간을 확보하세요.
axes를 줄인 뒤 범례를 도킹
시리즈가 많을 때는 플롯에 전용 범례 열을 남겨 두세요.
x = np.arange(10)
fig = plt.figure(figsize=(7.2, 4.2))
ax = fig.add_subplot(111)

for i in range(5):
    ax.plot(x, i * x, label=f"y = {i}x", lw=2)

# Leave ~22% of the figure width for the legend
box = ax.get_position()
ax.set_position([box.x0, box.y0, box.width * 0.78, box.height])
ax.legend(loc="center left", bbox_to_anchor=(1.02, 0.5), borderaxespad=0)
ax.set_title("Shrink axes, legend to the right")
plt.show()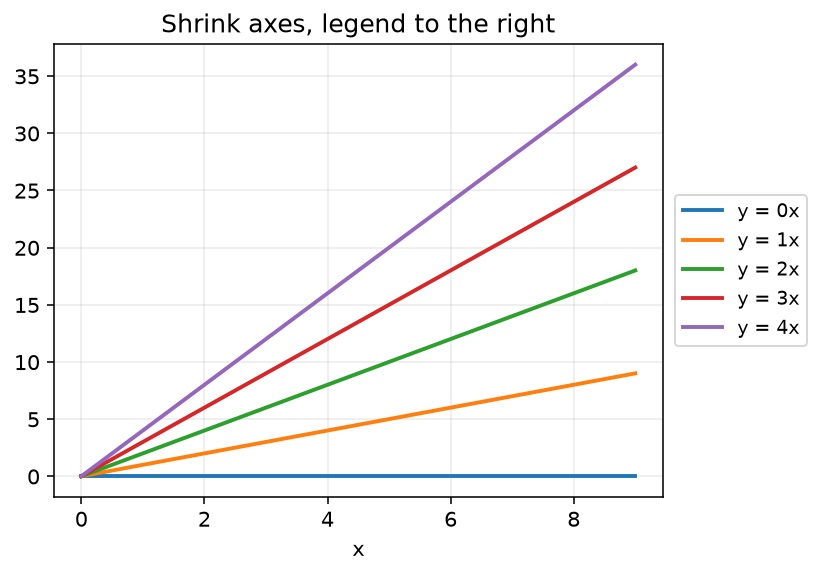
현대적인 대안: 바깥 artist와 더 잘 맞는 레이아웃 엔진으로 figure를 만듭니다.
fig, ax = plt.subplots(layout="constrained")
# ... plot ...
ax.legend(bbox_to_anchor=(1.02, 1), loc="upper left")
플롯 아래 가로 범례
ncol로 항목을 차트 아래 한 줄에 배치합니다. 슬라이드·넓은 대시보드에 적합합니다.
x = np.arange(10)
fig = plt.figure(figsize=(7.2, 4.4))
ax = fig.add_subplot(111)

for i in range(5):
    ax.plot(x, i * x, label=f"y = {i}x", lw=2)

box = ax.get_position()
ax.set_position([box.x0, box.y0 + box.height * 0.12, box.width, box.height * 0.88])
ax.legend(loc="upper center", bbox_to_anchor=(0.5, -0.12), ncol=5)
ax.set_title("Horizontal legend below the plot")
plt.show()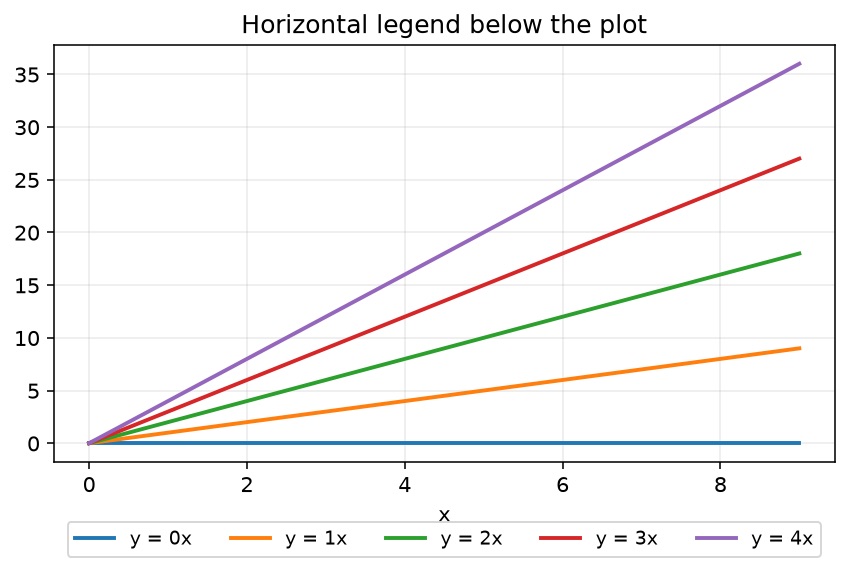
결정 가이드
| 상황 | 선호 |
|---|---|
| 시리즈 2–4개, 단순 선 차트 | bbox_to_anchor=(1.02, 1), loc="upper left" + tight_layout() |
| 시리즈 많음, 안정 레이아웃 필요 | axes 축소 / layout="constrained" + 오른쪽 범례 |
| 넓은 figure / 발표 | ncol 있는 하단 범례 |
| 어떤 상자도 방해되는 맵·이미지 | 반투명 안쪽 범례: framealpha=0.3 (타협) |
| 논문용 PNG/PDF 저장 | 항상 bbox_inches="tight" 테스트 (아래) |
내보내기 함정: 파일에서 바깥 범례가 사라짐
대화형 창에는 보이는데 savefig가 잘라내는 경우가 있습니다. 흔한 해결:
fig, ax = plt.subplots(figsize=(7, 4))
ax.plot(x, np.sin(x), label="sin(x)", lw=2)
ax.plot(x, np.cos(x), label="cos(x)", lw=2)
ax.legend(bbox_to_anchor=(1.02, 1), loc="upper left", borderaxespad=0)
ax.set_title("Outside legend kept with bbox_inches='tight'")

fig.savefig("legend-outside.png", dpi=150, bbox_inches="tight", facecolor="white")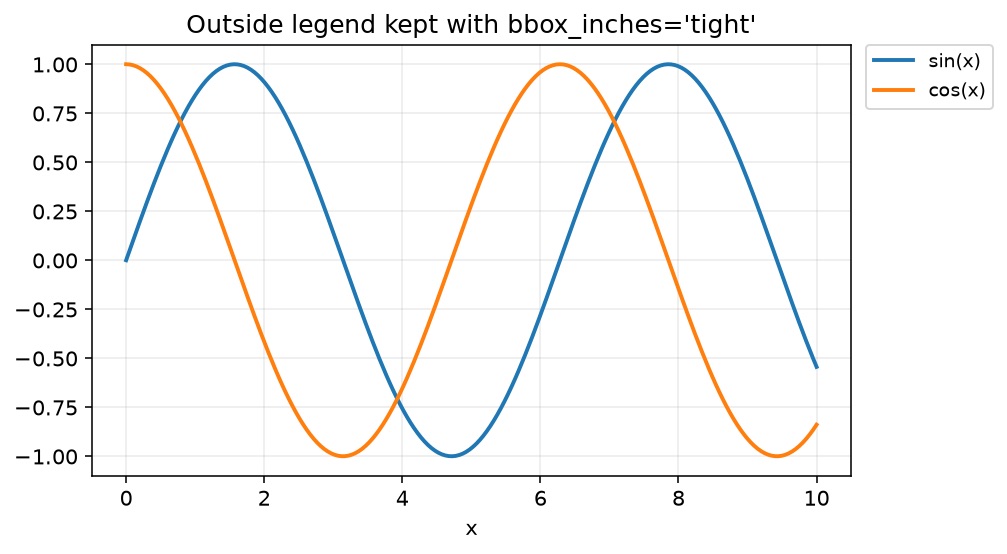
관련 심화: savefig cuts off labels. 라벨이 여전히 겹치면 앵커를 미세 조정하기 전에 figure size를 키우세요.
상자를 옮기지 않는 추가 제어
ax.legend(
    bbox_to_anchor=(1.02, 1),
    loc="upper left",
    borderaxespad=0,
    frameon=True,
    fancybox=False,
    framealpha=0.95,
    fontsize=9,          # or prop={"size": 9}
    title="Series",
    alignment="left",
)ncol— 다중 열 범례framealpha— 데이터 위에 둘 수밖에 없을 때 투명도title— 다중 시리즈 그룹 라벨
위치만이 아닌 일반 범례 스타일은 Matplotlib legend를 보세요.
흔한 함정
| 함정 | 보이는 증상 | 해결 |
|---|---|---|
loc="right"만 설정 | 범례가 여전히 안쪽 | 1.0 너머 bbox_to_anchor 필요 |
| GUI에는 바깥 범례, PNG에는 없음 | 잘린 내보내기 | bbox_inches="tight" 또는 constrained layout |
실수로 data 좌표 bbox_to_anchor | 범례가 멀리 날아감 | 기본은 axes 좌표; 의도 없으면 2-tuple, 임의 Bbox 금지 |
| 범례 글꼴이 너무 큼 | figure를 잠식 | fontsize=8–10 또는 열 수 줄이기 |
| colorbar와 겹침 | 여백이 찌그러짐 | 둘 다 공간 확보, 또는 범례를 아래로 |
FAQ
마무리
바깥 범례는 미스터리 API가 아니라 레이아웃 문제입니다. loc으로 범례 모서리를 고정하고, bbox_to_anchor로 axes 바로 밖(> 1 또는 < 0)에 그 핀을 두고, 내보내기 때 tight/constrained로 여백이 파일에 남게 하세요. 시리즈가 많으면 오른쪽 스택, 넓은 figure면 하단 ncol 행이 잘 맞습니다.
관련 가이드
- Matplotlib legend — 스타일, 제목, 다중 범례 패턴
- Matplotlib savefig cuts off labels — 내보내기 잘림 체크리스트
- Matplotlib figure size — 앵커 미세 조정 전 범례 공간
- Matplotlib fill_between — 명확한 범례가 필요한 음영 시리즈
- Matplotlib multiple line plots — 이 문제를 유발하는 다중 시리즈 차트
- Matplotlib annotations and text — 범례만으로 부족할 때 라벨
- Matplotlib subplots — 패널 간 공유 범례