Matplotlib 凡例を外側に置く:bbox_to_anchor 早見表


既定の凡例は 軸の内側 に乗り、データに被りがちです。外側に置くには、loc(凡例ボックスのどの角をアンカーにするか)と bbox_to_anchor(そのアンカーを軸座標のどこに置くか)をセットで使います。
クイックフィックス
import matplotlib.pyplot as plt
import numpy as np

x = np.linspace(0, 10, 200)
fig, ax = plt.subplots()
ax.plot(x, np.sin(x), label="sin(x)")
ax.plot(x, np.cos(x), label="cos(x)")

# Outside, upper-right of the axes
ax.legend(bbox_to_anchor=(1.02, 1), loc="upper left", borderaxespad=0)

plt.tight_layout()
plt.show()| 配置 | 典型的な呼び出し |
|---|---|
| 軸の右 | legend(bbox_to_anchor=(1.02, 1), loc="upper left") |
| 右・上下中央 | legend(loc="center left", bbox_to_anchor=(1.02, 0.5)) |
| 下・横並び | legend(loc="upper center", bbox_to_anchor=(0.5, -0.12), ncol=n) |
| 上 | legend(loc="lower center", bbox_to_anchor=(0.5, 1.02), ncol=n) |
| 切れないエクスポート | savefig(..., bbox_inches="tight") または tight_layout() / constrained_layout=True |
軸座標: (0, 0) は軸の左下、(1, 1) は右上。1 を少し超える、または 0 を少し下回る値は、枠のすぐ外側です。
- Laya の使い方:pandas でテキスト分類(Jev のオープンソース代替を4言語で実測)
- Claude Code が AGENTS.md を読むように:設定方法、4つの読み込みモード、Codex・OpenCode・Cursor との共用
- GPT Image 2.5の使い方:FlareとSunburstの違い・API料金
- DeepSeek Harness の使い方:インストール、初期設定、最初のエージェント実行まで
- Runcell Science:Claude Scienceのオープンソース代替となるAI研究ワークスペース
- Macをスリープさせない方法:Codex・Claude Codeを止めずに動かす
- OpenClaw vs ZeroClaw vs Pi Agent vs Nanobot: 2026年に選ぶべきAIエージェントスタックは?
- Claude CodeでJupyterノートブックを分析する方法|Data Science向けの実践ポイントと限界
- Claude Code Routinesとは?AIエージェントの定期実行と自動化を理解する
- Claude Code DesktopでBypass permissionsを有効にする方法
- GoogleのA2Aプロトコルで2つのPythonエージェントを構築する方法 - ステップバイステップチュートリアル
- 2025年のPythonで人気のあるトップ10のデータ可視化ライブラリ
問題: 凡例がデータに被る
fig, ax = plt.subplots(figsize=(7, 4))
ax.plot(x, np.sin(x), label="sin(x)", lw=2)
ax.plot(x, np.cos(x), label="cos(x)", lw=2)
ax.legend(loc="best")  # still inside the axes
ax.set_title("Default legend (often overlaps data)")
plt.show()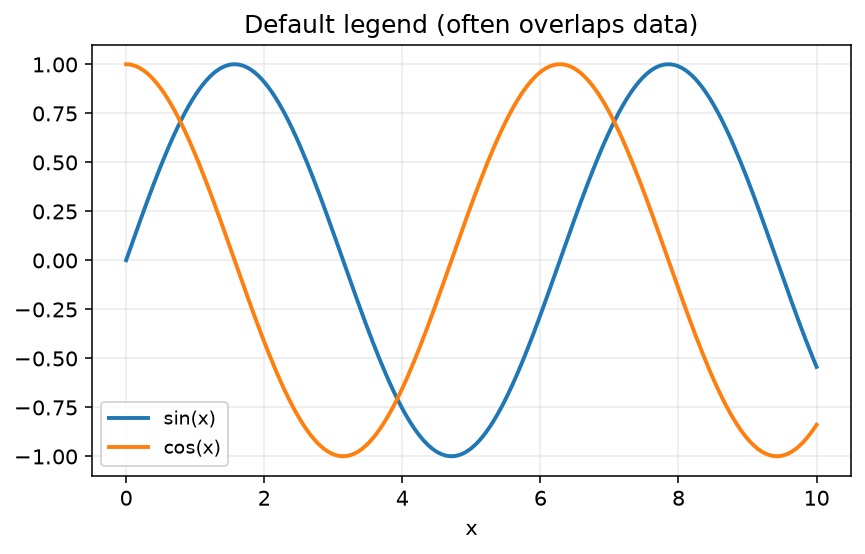
loc="best" は 内側 のいちばんマシな角を選ぶだけです。図の余白へ凡例を出してはくれません。
bbox_to_anchor と loc の役割分担
bbox_to_anchor=(x, y)— 既定では軸の割合座標での点。loc="upper left"など — 凡例ボックス上のどの点がそのアンカーにピン留めされるか。borderaxespad— 軸と凡例の余白。外側にきっちり寄せるなら0。
頭の中のモデル: プロット上のアンカー点 + 凡例のどの角をその点に乗せるか。
凡例を右に置く
fig, ax = plt.subplots(figsize=(7, 4))
ax.plot(x, np.sin(x), label="sin(x)", lw=2)
ax.plot(x, np.cos(x), label="cos(x)", lw=2)
ax.legend(bbox_to_anchor=(1.02, 1), loc="upper left", borderaxespad=0)
ax.set_title("Legend outside: upper right of axes")
fig.tight_layout()
plt.show()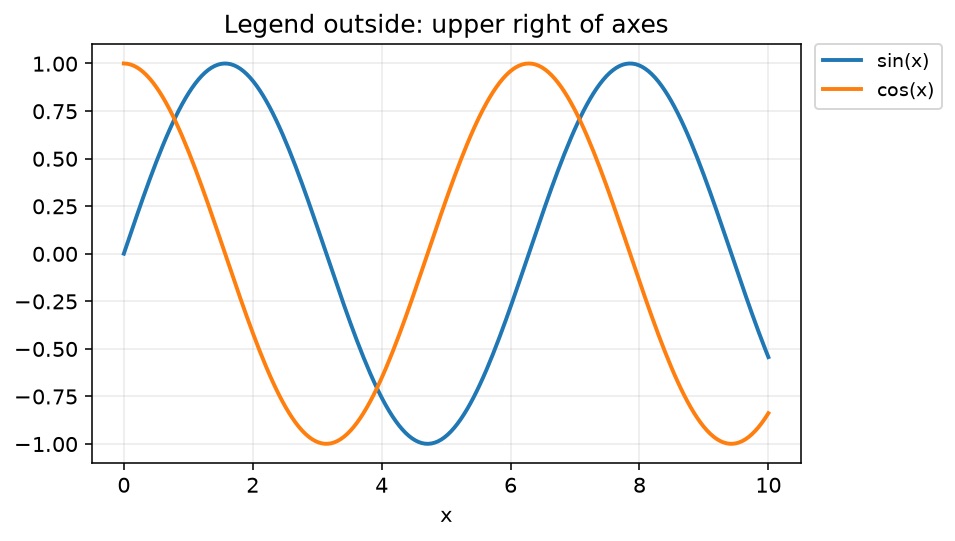
ウィンドウでもまだ切れるなら、tight_layout() / subplots の constrained_layout=True、または次節のように軸を縮めて余白を確保します。
軸を縮めてから凡例をドックする
系列が多いときは、凡例専用の列を残します。
x = np.arange(10)
fig = plt.figure(figsize=(7.2, 4.2))
ax = fig.add_subplot(111)

for i in range(5):
    ax.plot(x, i * x, label=f"y = {i}x", lw=2)

# Leave ~22% of the figure width for the legend
box = ax.get_position()
ax.set_position([box.x0, box.y0, box.width * 0.78, box.height])
ax.legend(loc="center left", bbox_to_anchor=(1.02, 0.5), borderaxespad=0)
ax.set_title("Shrink axes, legend to the right")
plt.show()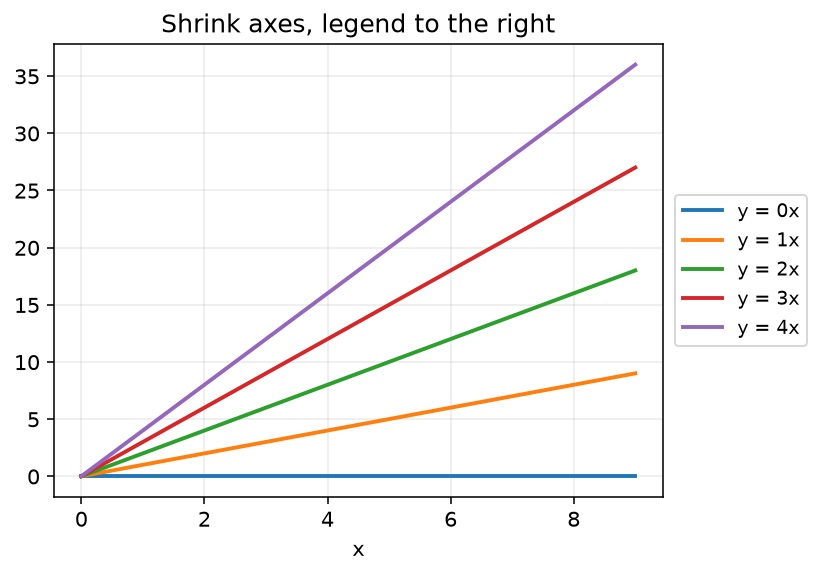
最近の代替: 外側の artist と相性の良いレイアウトエンジンで figure を作ります。
fig, ax = plt.subplots(layout="constrained")
# ... plot ...
ax.legend(bbox_to_anchor=(1.02, 1), loc="upper left")
プロットの下に横並び凡例
ncol で 1 行に並べ、チャート下に置きます。スライドや横長ダッシュボード向きです。
x = np.arange(10)
fig = plt.figure(figsize=(7.2, 4.4))
ax = fig.add_subplot(111)

for i in range(5):
    ax.plot(x, i * x, label=f"y = {i}x", lw=2)

box = ax.get_position()
ax.set_position([box.x0, box.y0 + box.height * 0.12, box.width, box.height * 0.88])
ax.legend(loc="upper center", bbox_to_anchor=(0.5, -0.12), ncol=5)
ax.set_title("Horizontal legend below the plot")
plt.show()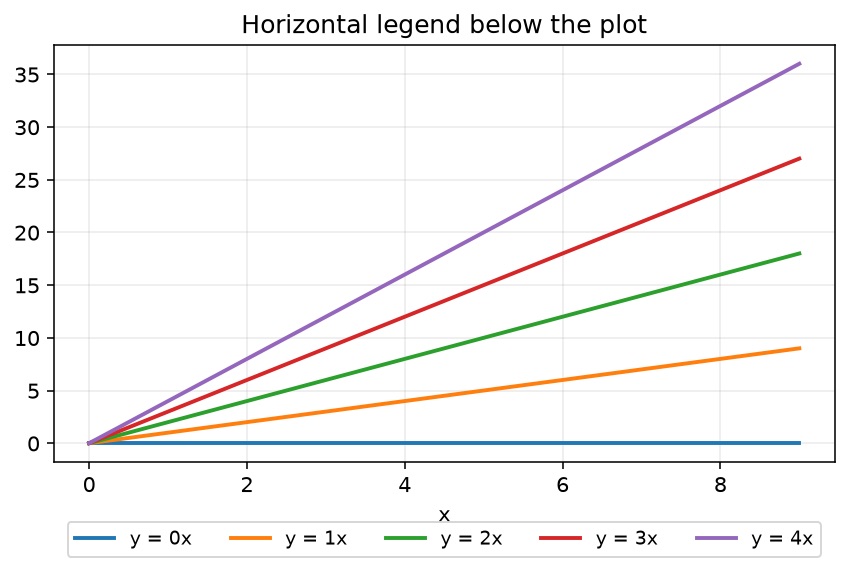
判断ガイド
| 状況 | 優先する手段 |
|---|---|
| 系列 2–4、単純な折れ線 | bbox_to_anchor=(1.02, 1), loc="upper left" + tight_layout() |
| 系列が多くレイアウトを安定させたい | 軸を縮める / layout="constrained" + 右側凡例 |
| 横長の図 / プレゼン | 下側凡例 + ncol |
| 地図や画像で箱が邪魔 | 妥協として内側半透明: framealpha=0.3 |
| 論文用 PNG/PDF | 必ず bbox_inches="tight" を試す(次節) |
エクスポートの罠: 外側凡例がファイルで消える
対話ウィンドウでは見えるのに、savefig で切れることがあります。定番の直し方:
fig, ax = plt.subplots(figsize=(7, 4))
ax.plot(x, np.sin(x), label="sin(x)", lw=2)
ax.plot(x, np.cos(x), label="cos(x)", lw=2)
ax.legend(bbox_to_anchor=(1.02, 1), loc="upper left", borderaxespad=0)
ax.set_title("Outside legend kept with bbox_inches='tight'")

fig.savefig("legend-outside.png", dpi=150, bbox_inches="tight", facecolor="white")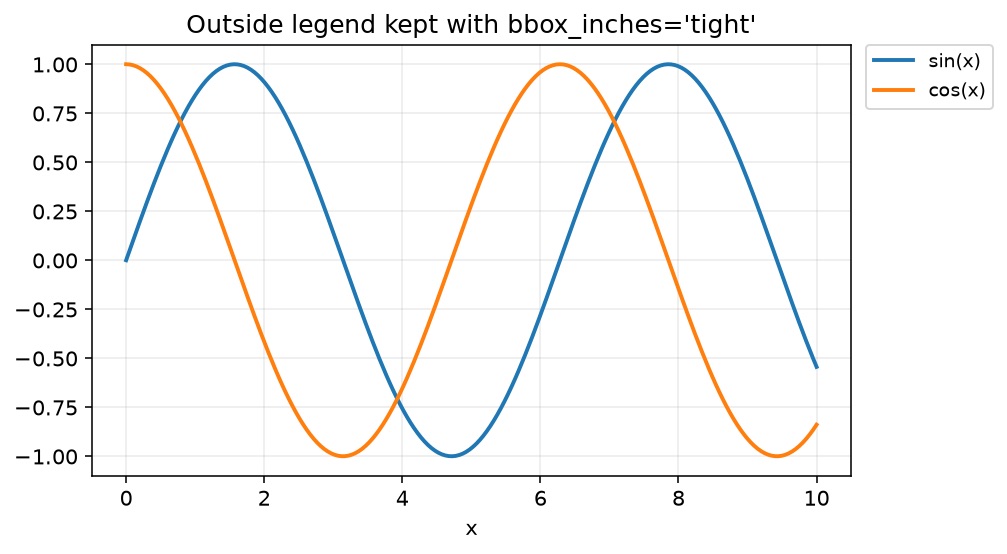
詳しくは savefig でラベルが切れる。ラベルがまだぶつかるなら、アンカーの微調整より先に 図サイズ を上げます。
ボックスを動かさない追加コントロール
ax.legend(
    bbox_to_anchor=(1.02, 1),
    loc="upper left",
    borderaxespad=0,
    frameon=True,
    fancybox=False,
    framealpha=0.95,
    fontsize=9,          # or prop={"size": 9}
    title="Series",
    alignment="left",
)ncol— 複数列の凡例framealpha— データ上にどうしても残すときの透明度title— 複数系列のグループ見出し
位置以外の凡例スタイル全般は Matplotlib legend を参照してください。
よくある罠
| 罠 | 見える症状 | 直し方 |
|---|---|---|
loc="right" だけ | 凡例がまだ内側 | 1.0 を超える bbox_to_anchor が必要 |
| GUI では外側、PNG では無い | エクスポートでクリップ | bbox_inches="tight" または constrained layout |
誤ってデータ座標の bbox_to_anchor | 凡例が飛んでいく | 既定は軸座標。意図がない限り 2 タプルで、Bbox は使わない |
| 凡例フォントが巨大 | 図を支配する | fontsize=8–10、または列を減らす |
| colorbar と重なる | 余白が潰れる | 両方にスペースを取る、または凡例を下へ |
FAQ
まとめ
外側凡例は謎 API ではなくレイアウト問題です。loc で凡例の角をピン留めし、bbox_to_anchor でそのピンを軸のすぐ外(> 1 または < 0)に置き、エクスポートでは tight / constrained で余白がファイルに残るようにします。系列が多いときは右側スタック、横長の図では下側の ncol 行が向いています。
関連ガイド
- Matplotlib legend — スタイル、タイトル、複数凡例
- savefig でラベルが切れる — エクスポート時クリップのチェックリスト
- Matplotlib の図サイズ — アンカー微調整の前に凡例の余白を確保
- Matplotlib fill_between — はっきりした凡例が要る帯塗り系列
- Matplotlib 複数折れ線 — この問題が起きやすい複数系列
- Matplotlib アノテーションとテキスト — 凡例だけでは足りないときのラベル
- Matplotlib subplots — パネル横断の共有凡例