Graphic Walker


Graphic Walkerは、ドラッグ&ドロップでデータをインタラクティブな可視化に変換する、オープンソースのTableau代替ツールです。軽量で埋め込み可能なReactコンポーネントとして動作し、重いBIプラットフォームは不要です。
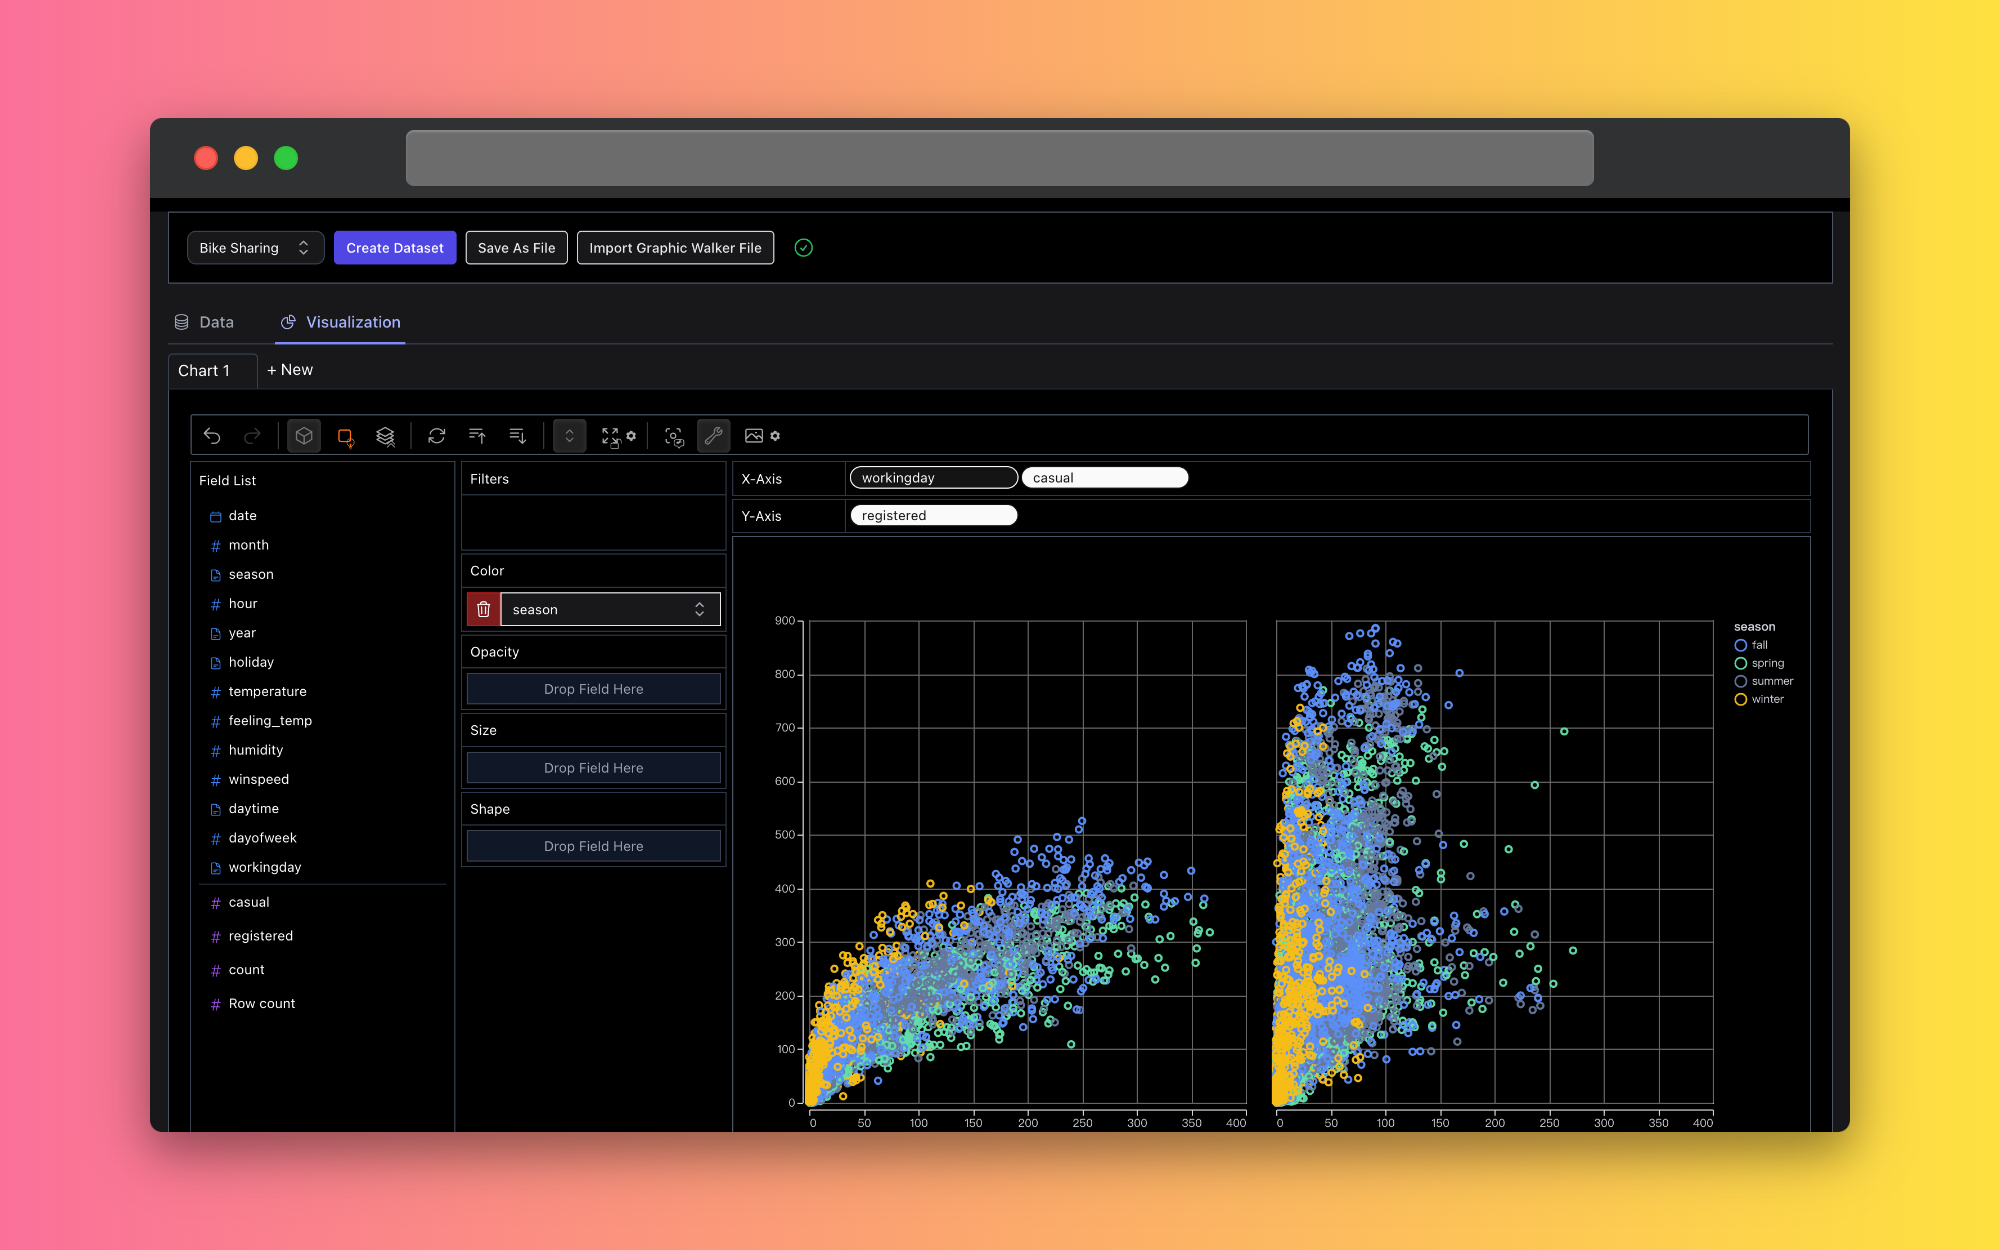
主な特徴
- ドラッグ&ドロップで探索 — フィールドをビジュアルエンコーディングチャネル(行、列、色、サイズ、形状、不透明度)にドラッグして可視化を作成
- グラフィックスの文法 — vega-lite (opens in a new tab)を基盤とし、棒グラフ、折れ線グラフ、面グラフ、散布図、ヒートマップ、箱ひげ図、地理チャートをサポート
- 複数のコンポーネント — 完全な探索用の
GraphicWalker、読み取り専用チャート表示用のGraphicRenderer、埋め込み用のPureRenderer、データテーブル用のTableWalker - クライアントまたはサーバー計算 — デフォルトでWebWorkerで計算を実行、または大規模データセット向けにサーバーへ委譲
- テーマ設定 — 組み込みテーマ(vega、g2、streamlit)、ダークモード対応、完全にカスタマイズ可能なUIカラー
- 地理的可視化 — GeoJSON/TopoJSONサポートによるコロプレスマップとポイントマップ
- チャートエクスポート — ref APIを通じてチャートをSVGまたはPNGとしてエクスポート
- i18n — 英語、中国語、日本語の組み込みサポートとカスタム翻訳サポート
- Reactなしでも大丈夫 — あらゆるWebフレームワーク向けのVanilla JS埋め込み関数
クイックスタート
npm install @kanaries/graphic-walkerimport { GraphicWalker } from '@kanaries/graphic-walker';
const fields = [
{ fid: 'date', name: 'Date', semanticType: 'temporal', analyticType: 'dimension' },
{ fid: 'category', name: 'Category', semanticType: 'nominal', analyticType: 'dimension' },
{ fid: 'sales', name: 'Sales', semanticType: 'quantitative', analyticType: 'measure' },
];
function App() {
return <GraphicWalker data={data} fields={fields} />;
}完全なウォークスルーについては、はじめにガイドをご覧ください。
ドキュメント
| セクション | 説明 |
|---|---|
| はじめに | インストール、基本的な使い方、フィールド設定 |
| APIリファレンス | すべてのコンポーネントの完全なプロパティドキュメント |
| ガイド | チャートタイプ、テーマ設定、計算、地理的可視化など |
| チュートリアル | 特定のチャートタイプを作成するためのステップバイステップチュートリアル |
| FAQ | よくある質問とトラブルシューティング |
オンラインプレイグラウンド
インストールなしでGraphic Walkerを試す: Graphic Walker Online (opens in a new tab)
ライセンス
Graphic WalkerはApache-2.0 License (opens in a new tab)の下でリリースされています。