Area Chart Maker: Visualize Data Over Time with VizGPT
Ready to start creating your own Area Charts with VizGPT? Try this Prompt:
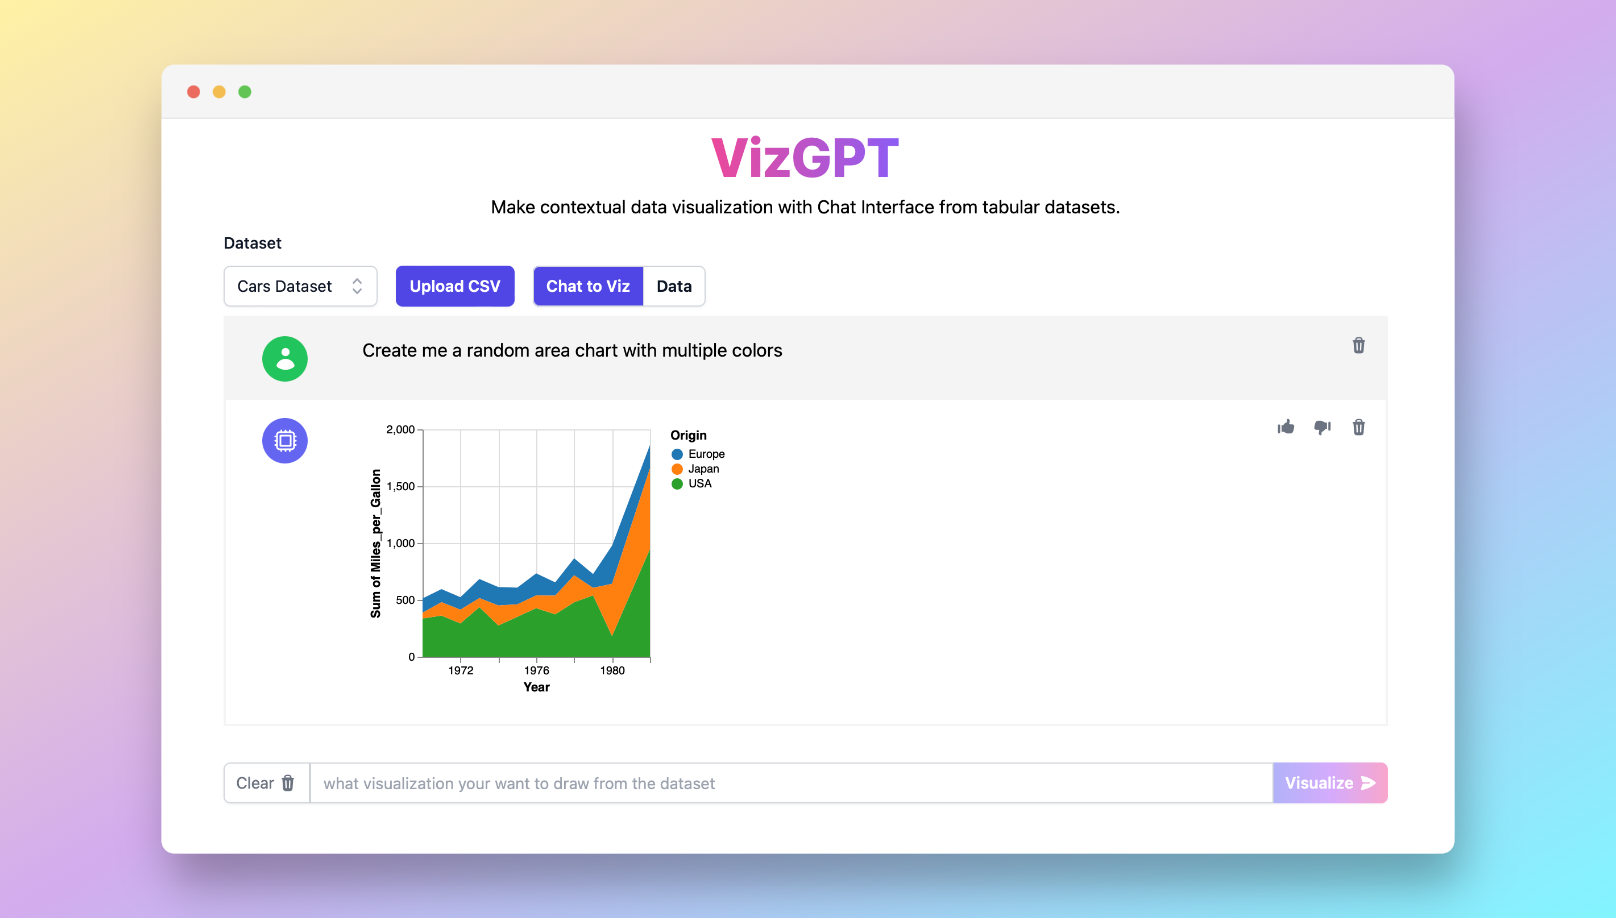
Create an Area Chart from the data set
Want to Upload a Customized CSV File? Upgrade to Kanaries Plus Plan, you can get the full package of apps (opens in a new tab) for handling much more complicated data analysis!

Introduction to Area Chart Makers
Discover a whole new way of data visualization with our Area Chart Maker, a key feature of VizGPT. This tool enables you to create intuitive area charts and stacked area charts, ideal for visualizing quantities over time. Whether you need a simple area chart, a stacked chart, or a more complex stacking graph, you can use VizGPT - our ChatGPT-powered Area Chart Maker is designed to help you achieve your data visualization goals.
Area Chart Maker: What it is?
Area charts and stacked area charts are visual representations that allow you to understand the progression of multiple data series over time. A regular area chart offers a simple view of individual data series, while a stacked area chart allows for a more intricate representation of part-to-whole relationships.
Area Chart Maker Solutions
Making an area chart or a stacked area chart is a breeze with our Area Chart Maker. Just upload your data, instruct VizGPT to form an area chart or stacked area chart, and click visualize. You'll have a stacked chart or area chart that breathes life into your data in no time.
If you're interested in experimenting with different data visualizations, our tool also supports other charts, including bar charts, histograms, and scatter diagrams. Find the visualization that best fits your data.
Types of Area Chart Maker
Data visualization with area charts and stacked area charts doesn't have to be complicated. With our Area Chart Maker, you can easily craft clear, dynamic area charts and stacking graphs. Start your data visualization journey with VizGPT today and harness the power of your data.