Causal Analysis
What is causal analysis?
Causal analysis refers to the process of examining the relationship between two or more variables to determine if one variable has a causal effect on the other. This involves identifying the variables that may be responsible for a particular outcome and using statistical techniques to determine whether a causal relationship exists between them.
How to perform causal analysis with RATH
To perform causal analysis using RATH, you can follow these steps:
- Identify the variables of interest and collect relevant data.
- Analyze the data using statistical techniques to determine whether there is a significant relationship between the variables.
- Draw conclusions about the causal relationship between the variables.
Case study: Causal analysis of the "Diabetes Database" from Kaggle
For example, let's explore the "Diabetes Database" from Kaggle (opens in a new tab) using RATH for causal analysis. First, import the database into RATH, then clean the data by removing invalid data with BMI, BloodPressures and SkinThickness which equals 0. On the DataSource Tab, click on the Clean Method button and choose the drop null records option.
After cleaning the data, click on the drop down menu to the right of Start Analysis button and choose the Causal Analysis option.
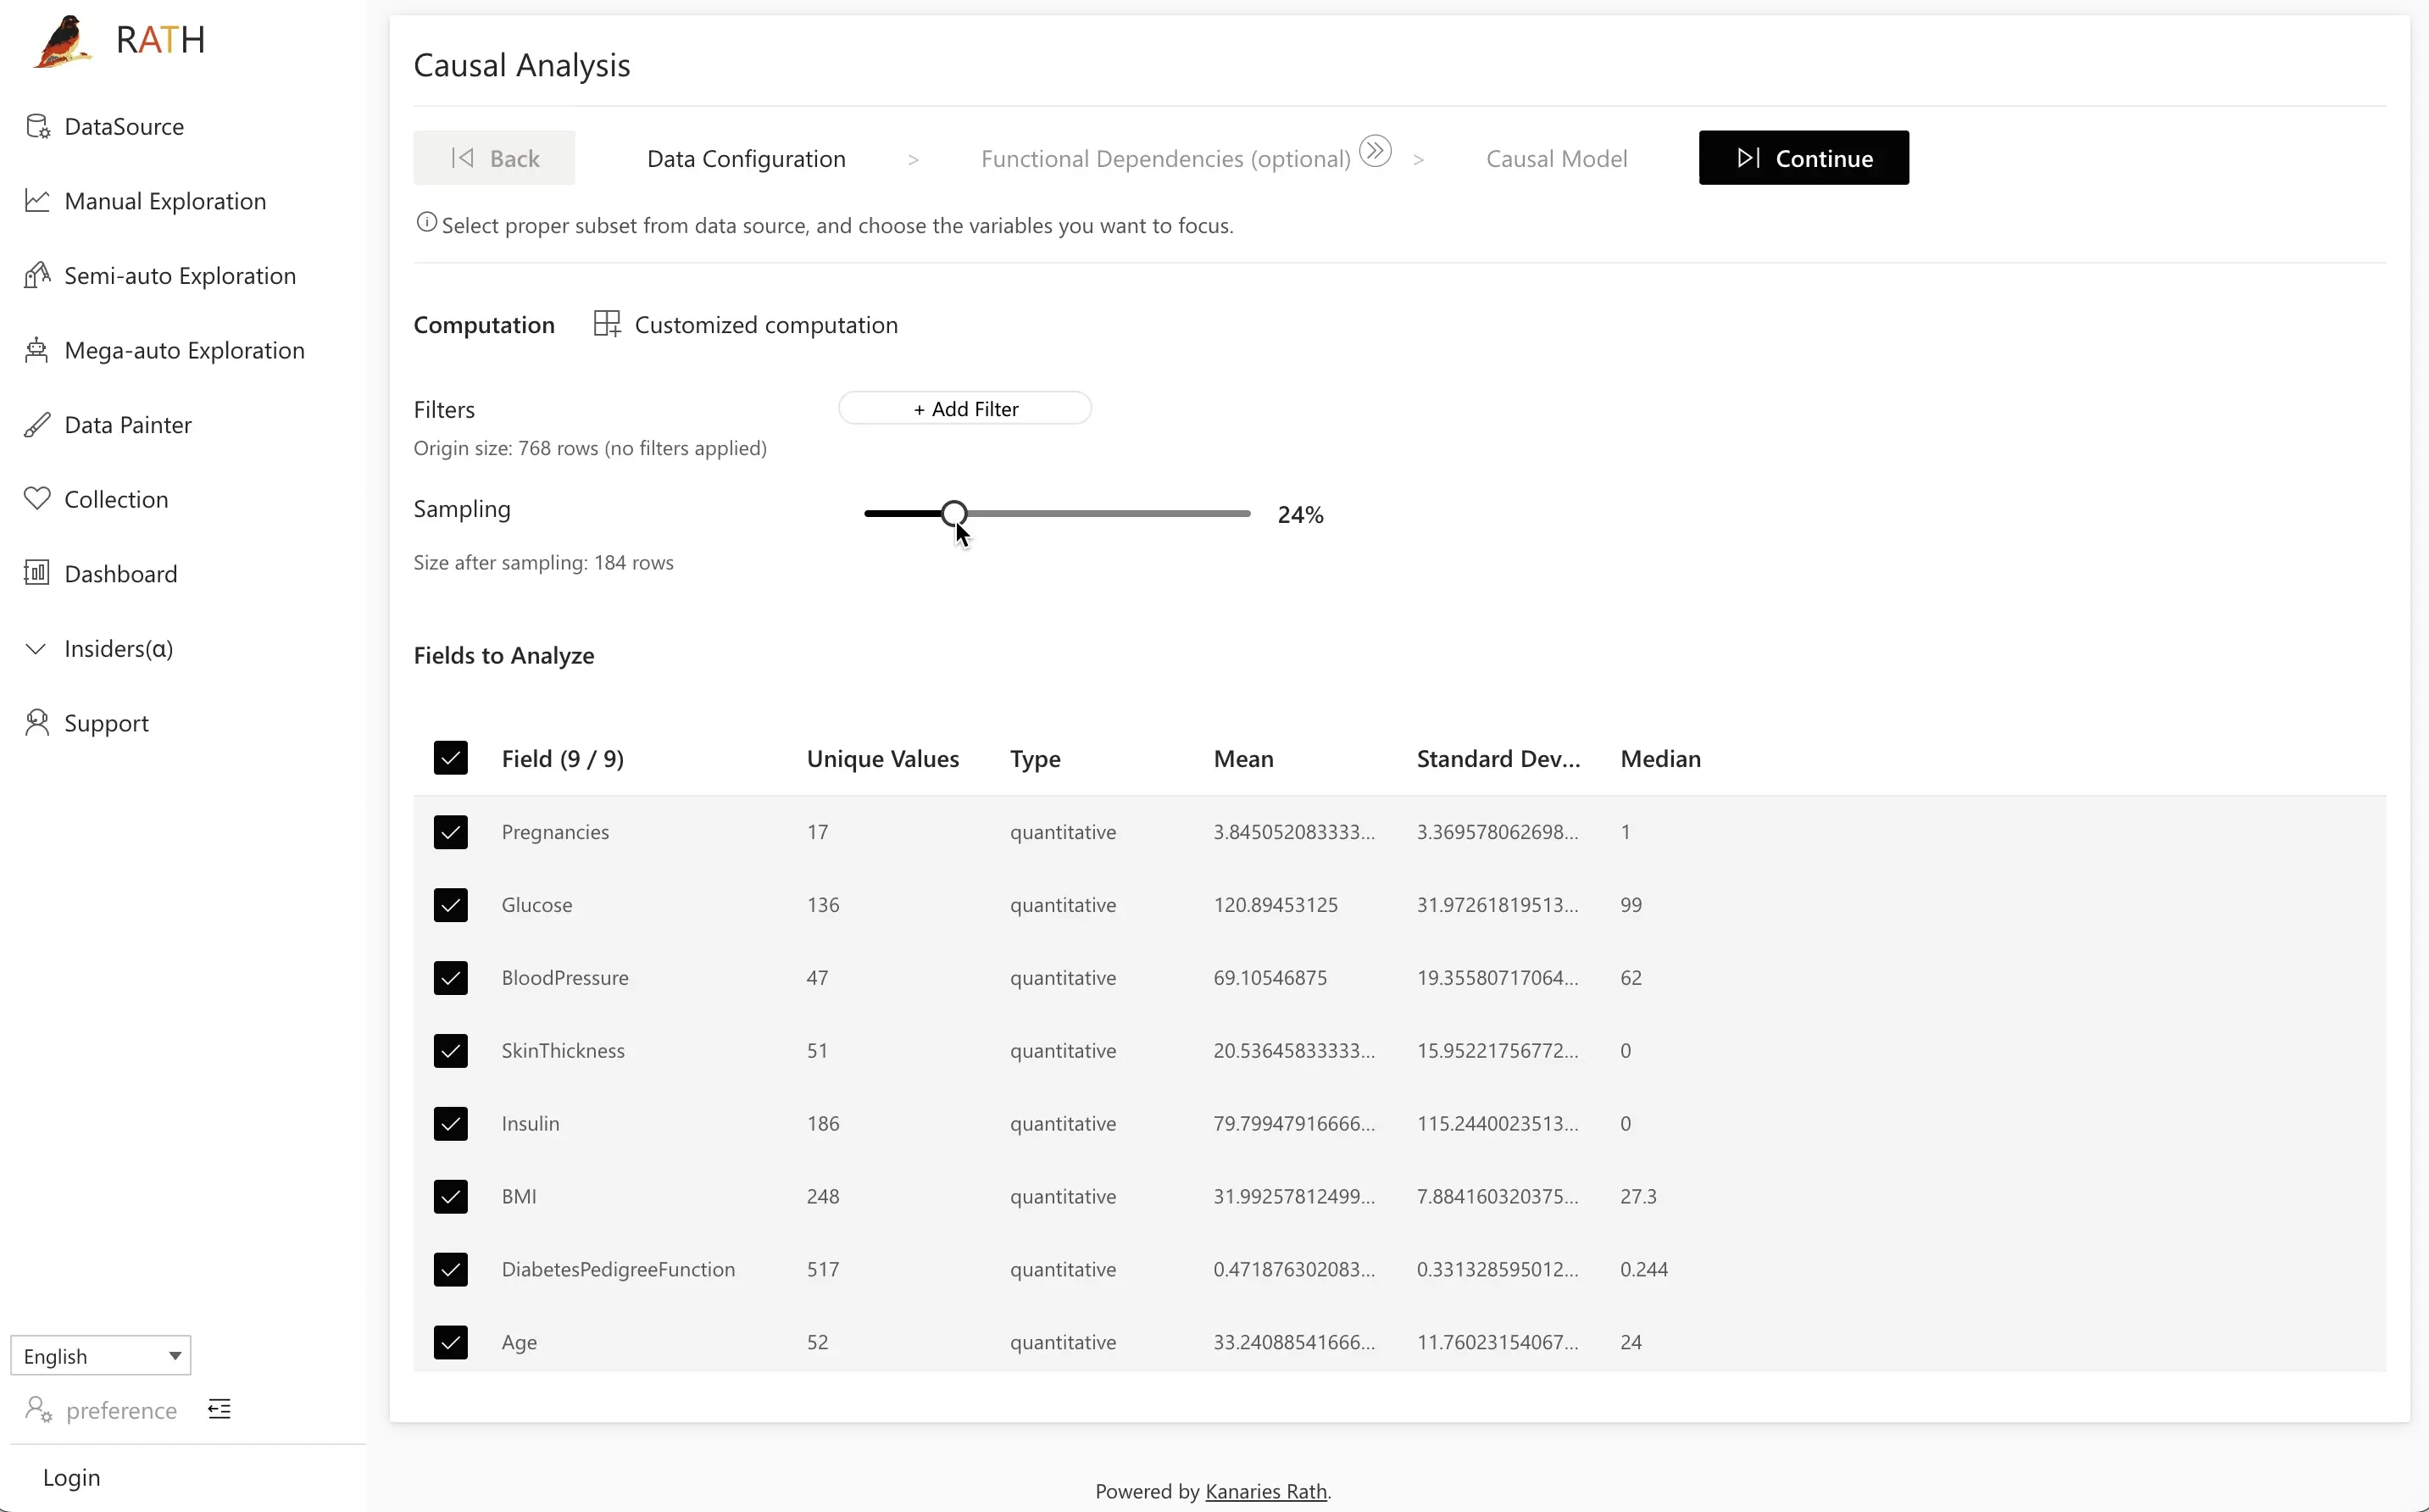
Step 1: Data Configuration
To conduct a causal analysis, select all the data fields that you want to include. For instance, you may want to focus on a specific subset of data or only the data that's relevant to your analysis. Click on the Next button to proceed.
Step 2: (Optional) Functional Dependencies
Edit the dependencies between known variables to increase the accuracy of the causal analysis process. For example, you can instruct RATH about less obvious relationships between variables.
The following screenshot demonstrates a sample for RATH to automatically build functional dependencies for your database. RATH analyzes the values of different variables and calculates the possible relationships. You can build your own dependencies here.
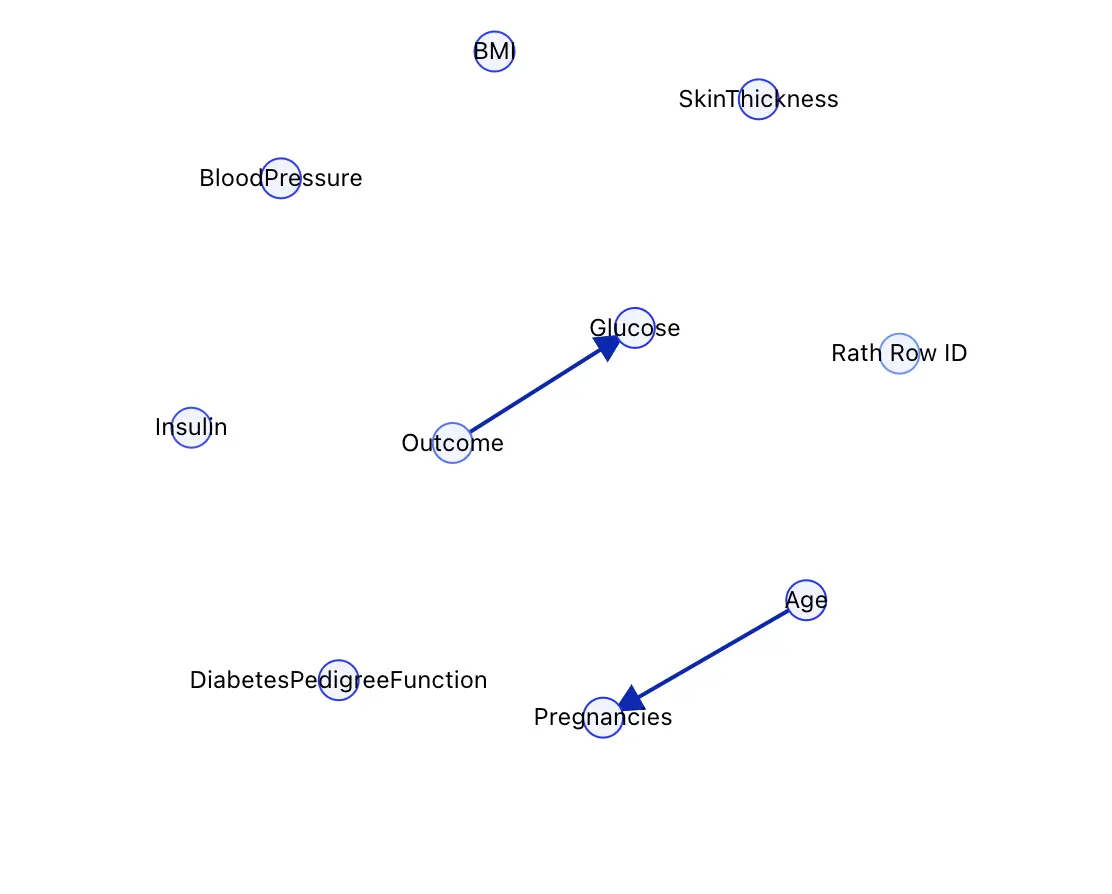
Best Practice: If some of your data is generated using regular expressions or SQL formulas, it's suggested to declare their dependencies in this step. If you're generating this data using RATH, it's not necessary to build dependencies in this step as RATH handles the workload automatically.
Step 3: Causal Model
Click on the Causal Discovery button to initiate the causal analysis process.
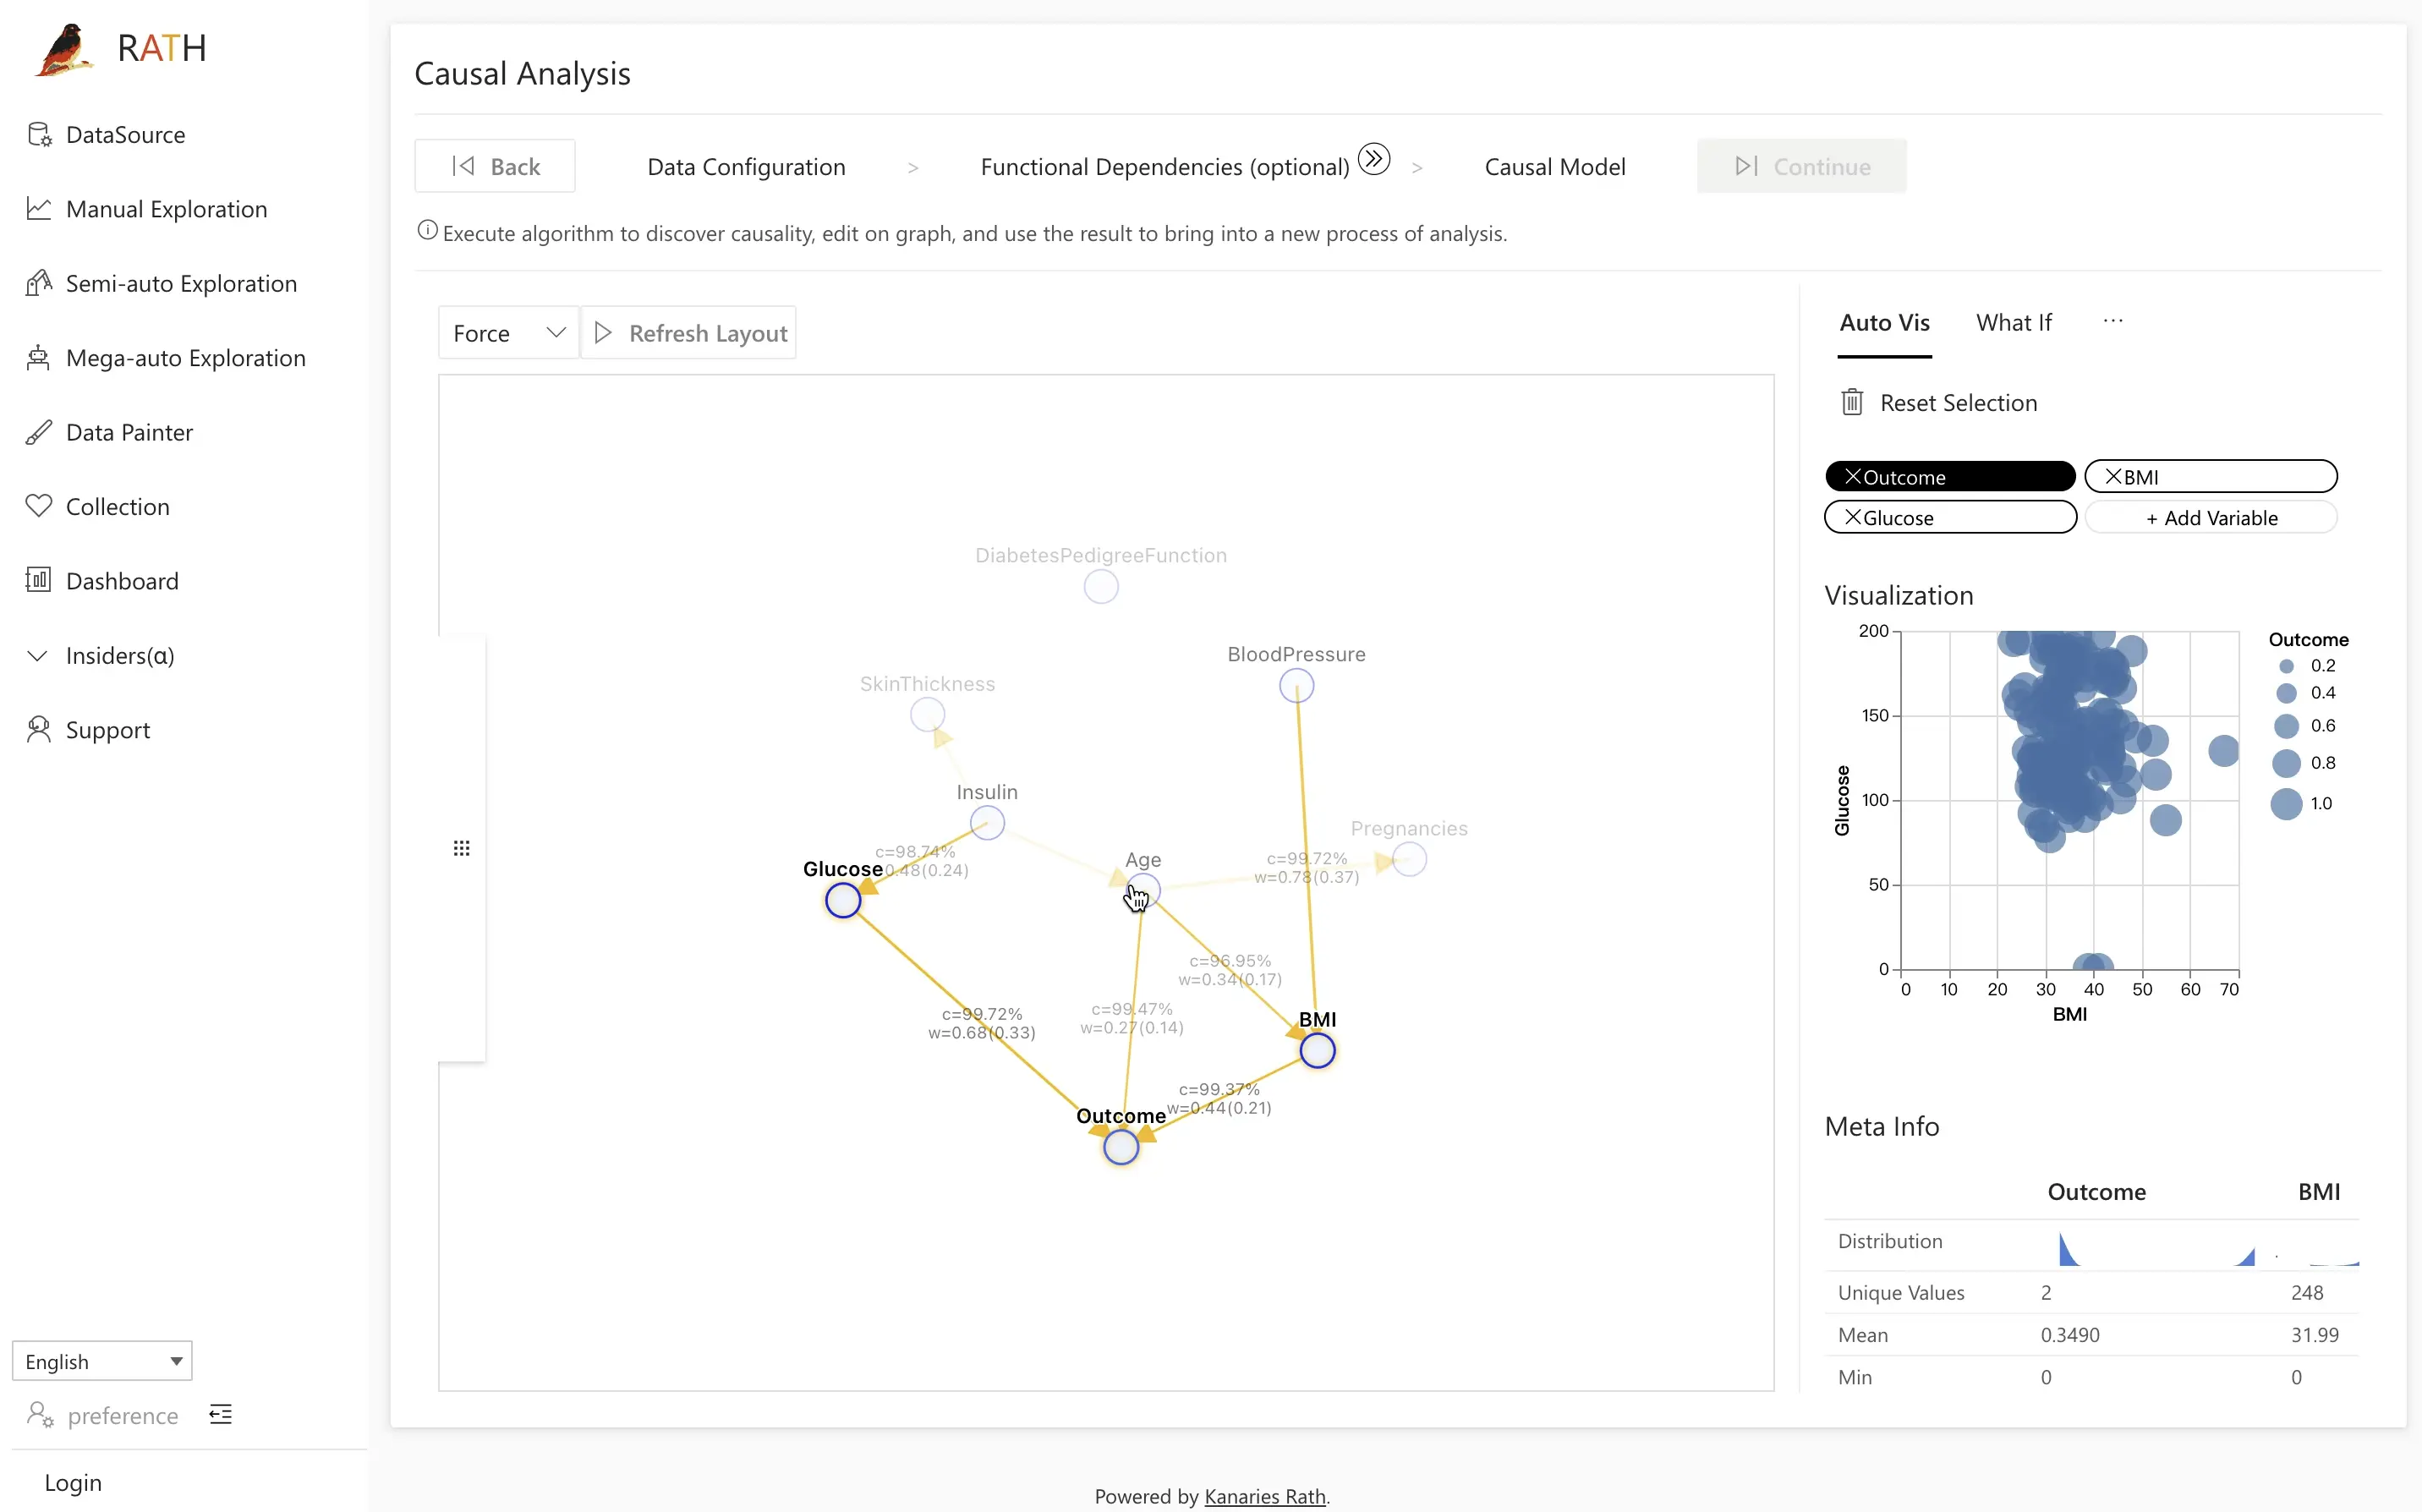
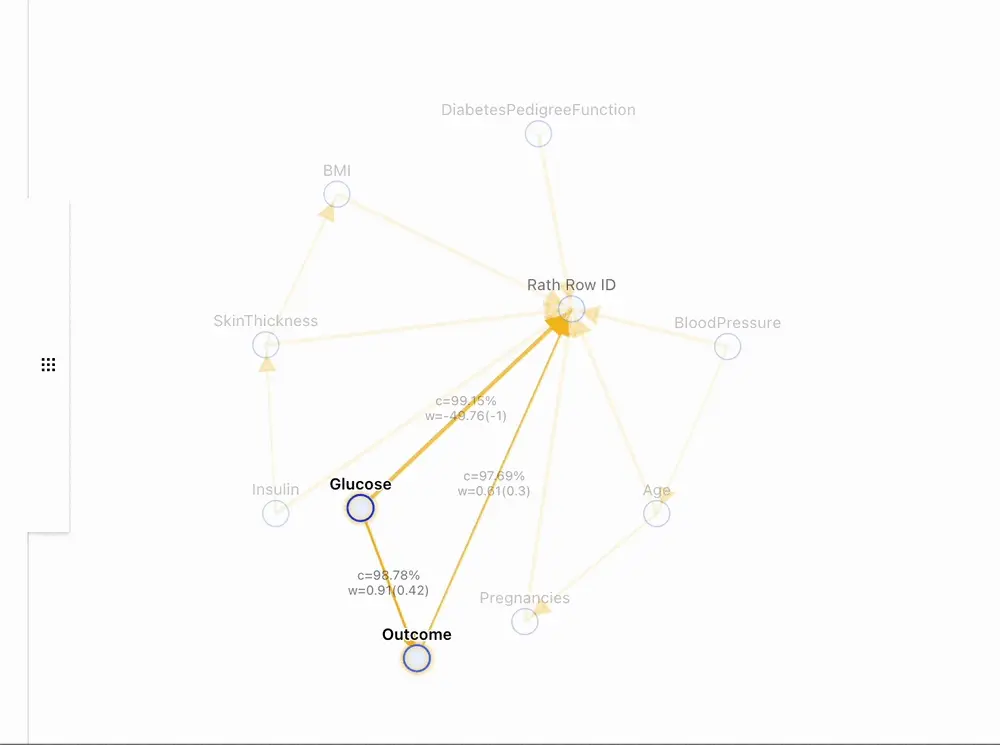
The following screenshot shows the causal discovery result for the "Diabetes" database:
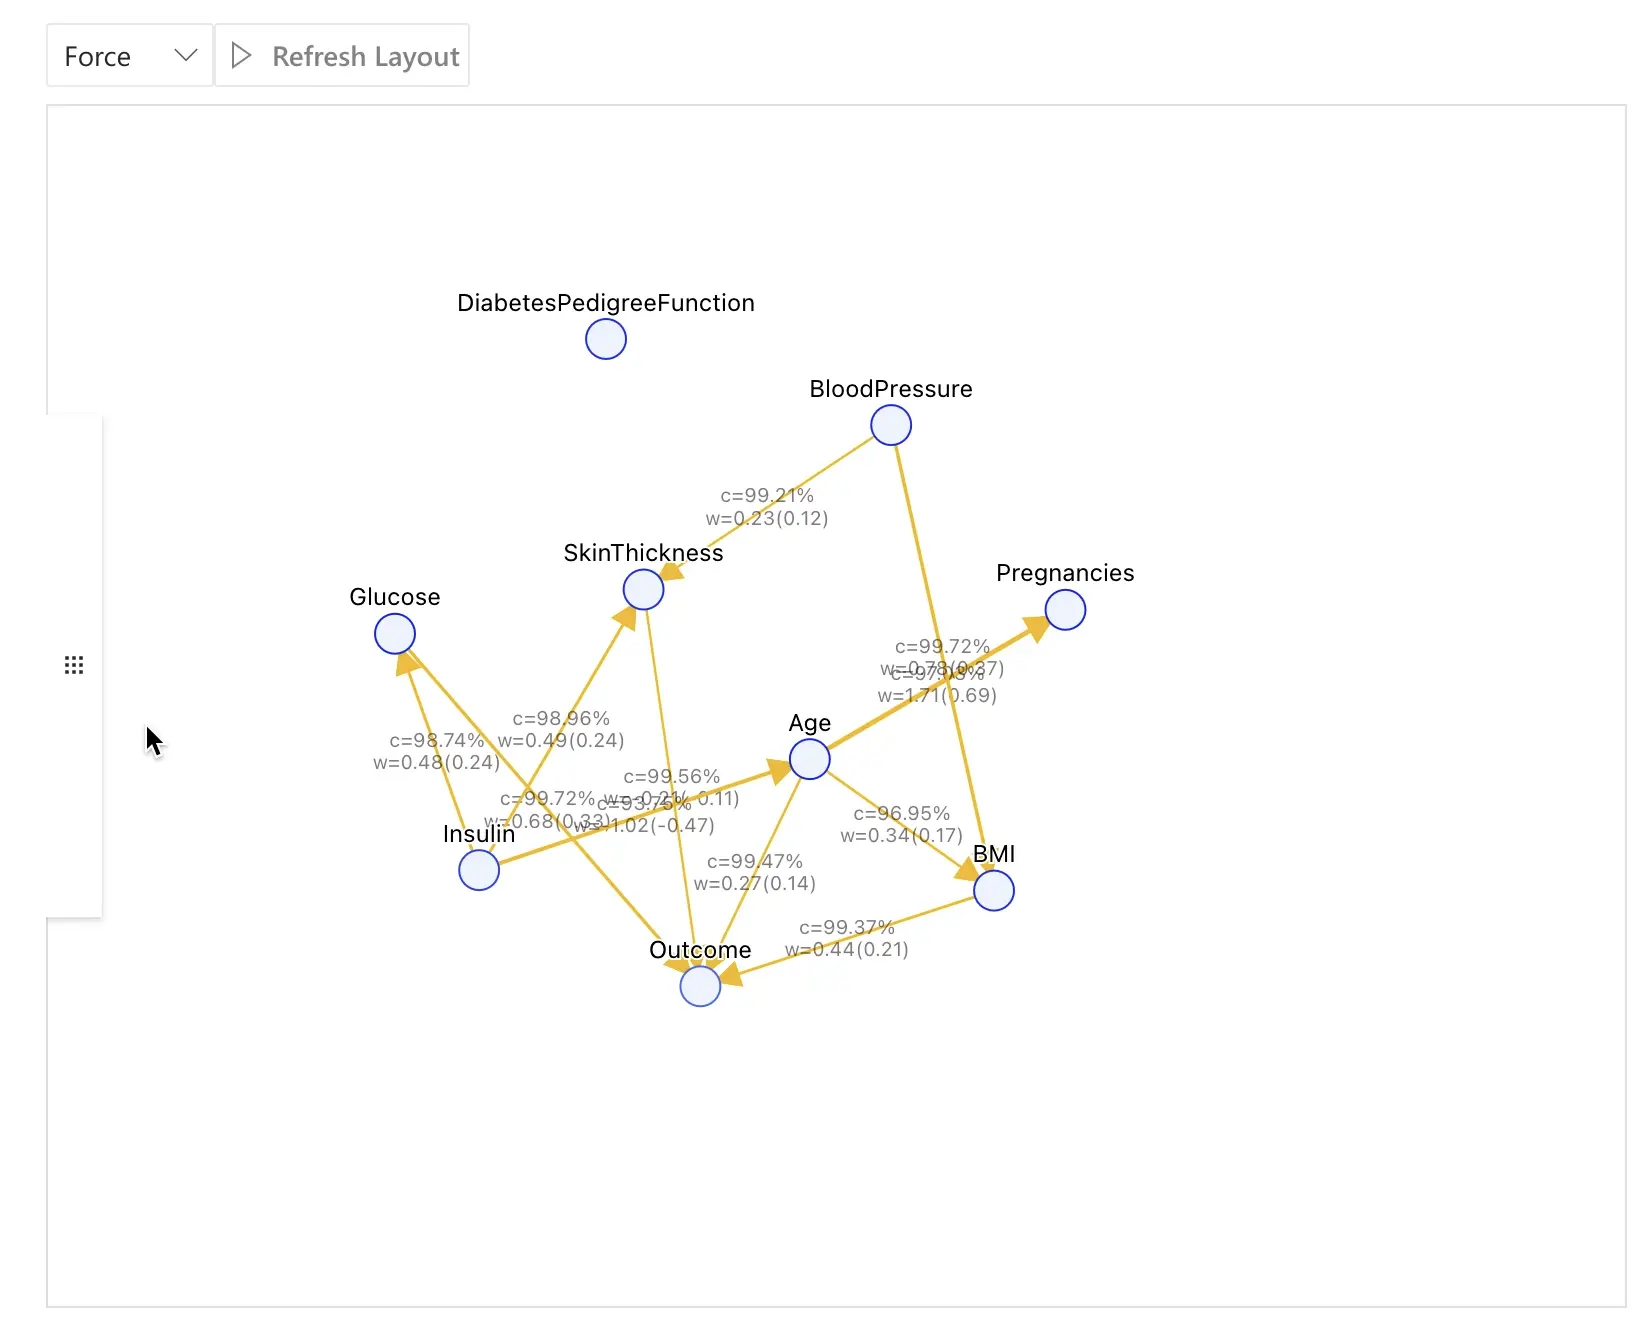
The factors that impact this model include:
Glucose: The amount of glucose in the body that affects Outcome.Insulin: The amount of insulin in the body that affects Glucose, which in turn affects whether one develops diabetes.Age: Which is directly influenced by Insulin and further affects the Outcome.
By clicking on a node in the interactive graph, the nodes directly related to it will be highlighted, and the strength of the relationship between the two will be displayed by the edge between them. The right side also provides various functional modules for further exploration after clicking the node.
Step 3.1: Comparative Analysis with Field Insights
In data analysis, comparative analysis is a method that involves comparing the differences between two groups and explaining the reasons for these differences based on a causal model. In practical applications, comparative analysis can provide valuable insights, such as by comparing the difference between an abnormal group and the whole to analyze the cause of the abnormality.
RATH supports the following types of comparative analysis:
- Comparing the selected section with the whole set (e.g., comparing January with the whole year)
- Comparing the selected section with its supplementary set (e.g., comparing January with other times except for January)
- Comparing the selected section to another specified set (e.g., comparing January with June)
You can use the comparative analysis feature in RATH to:
- Assist in researching and understanding causal relationships.
- Verify and explore causal hypotheses with field insights.
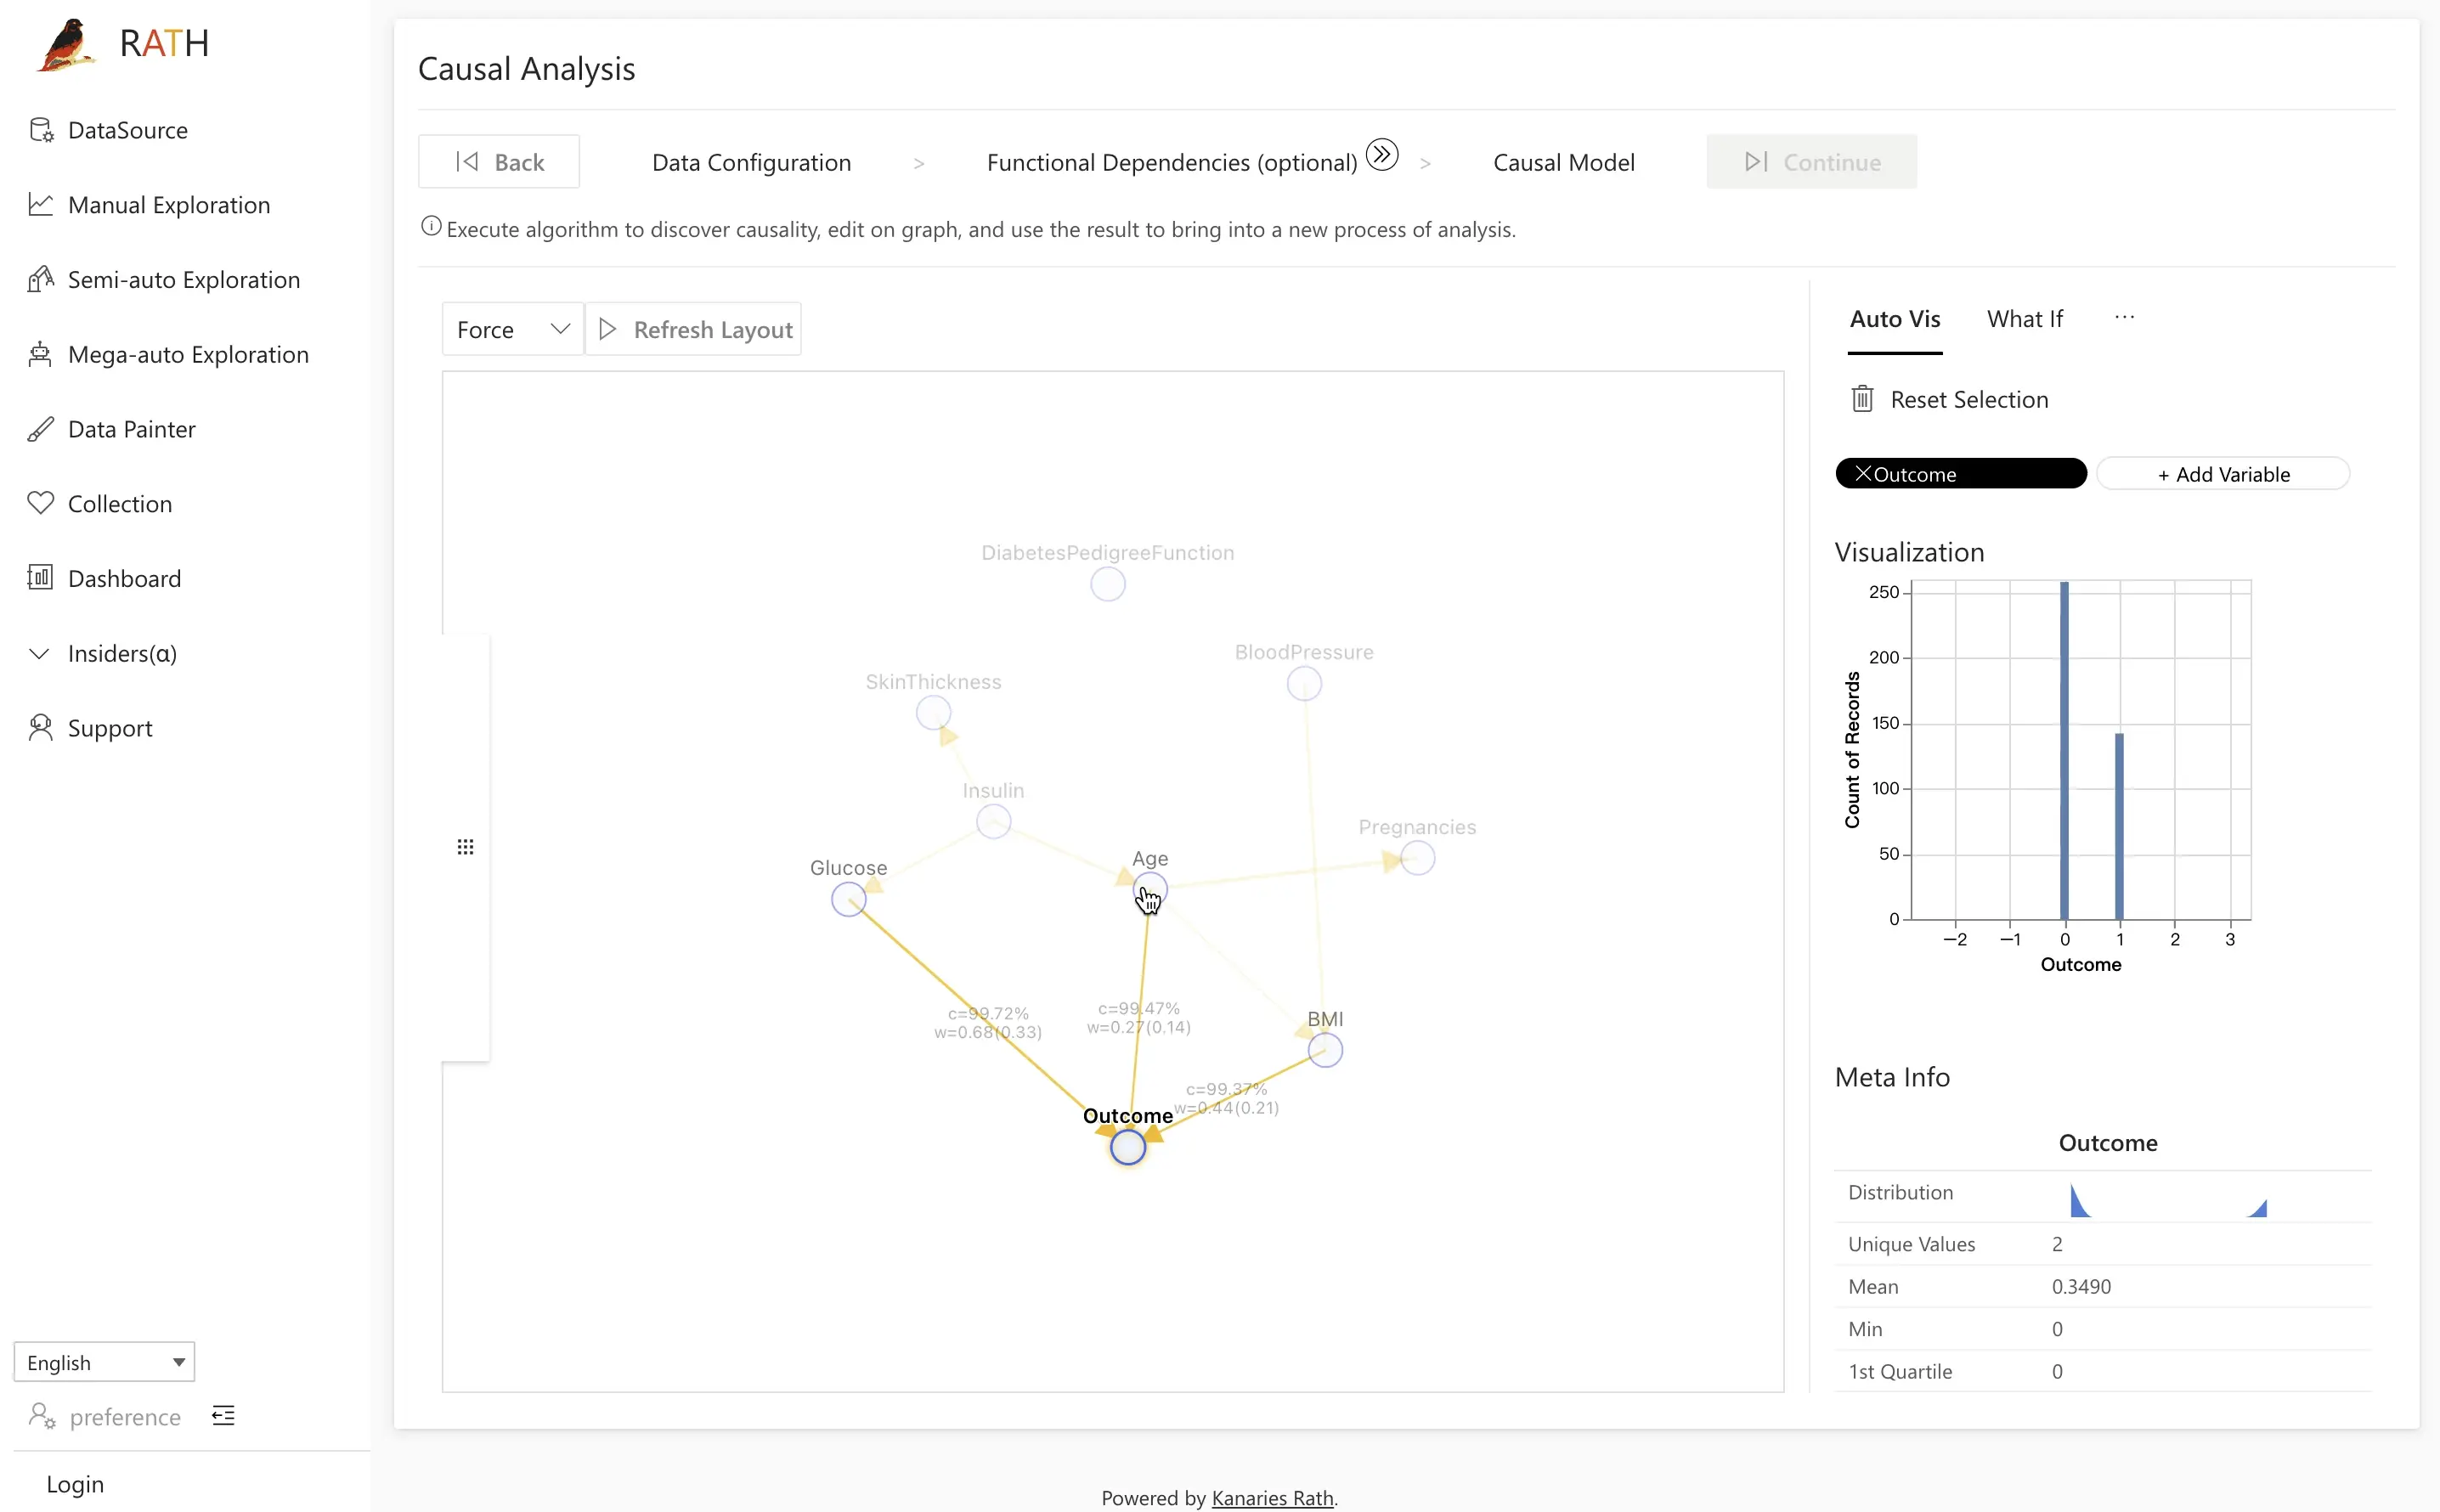
For example, to examine the potential causal relationships to the Outcome variable, navigate to the Field Insight tab and click on the Outcome node on the left side of the screen. On the right side of the screen, the distribution of individuals with and without diabetes will be displayed. Click on one of the distributions and initiate a comparative analysis.
After identifying the relevant data subset and control group (in this case, the Glucose variable), clicking on the Causal Discovery button will initiate an analysis of potential underlying causes, utilizing cause and effect diagrams to suggest possible explanations.
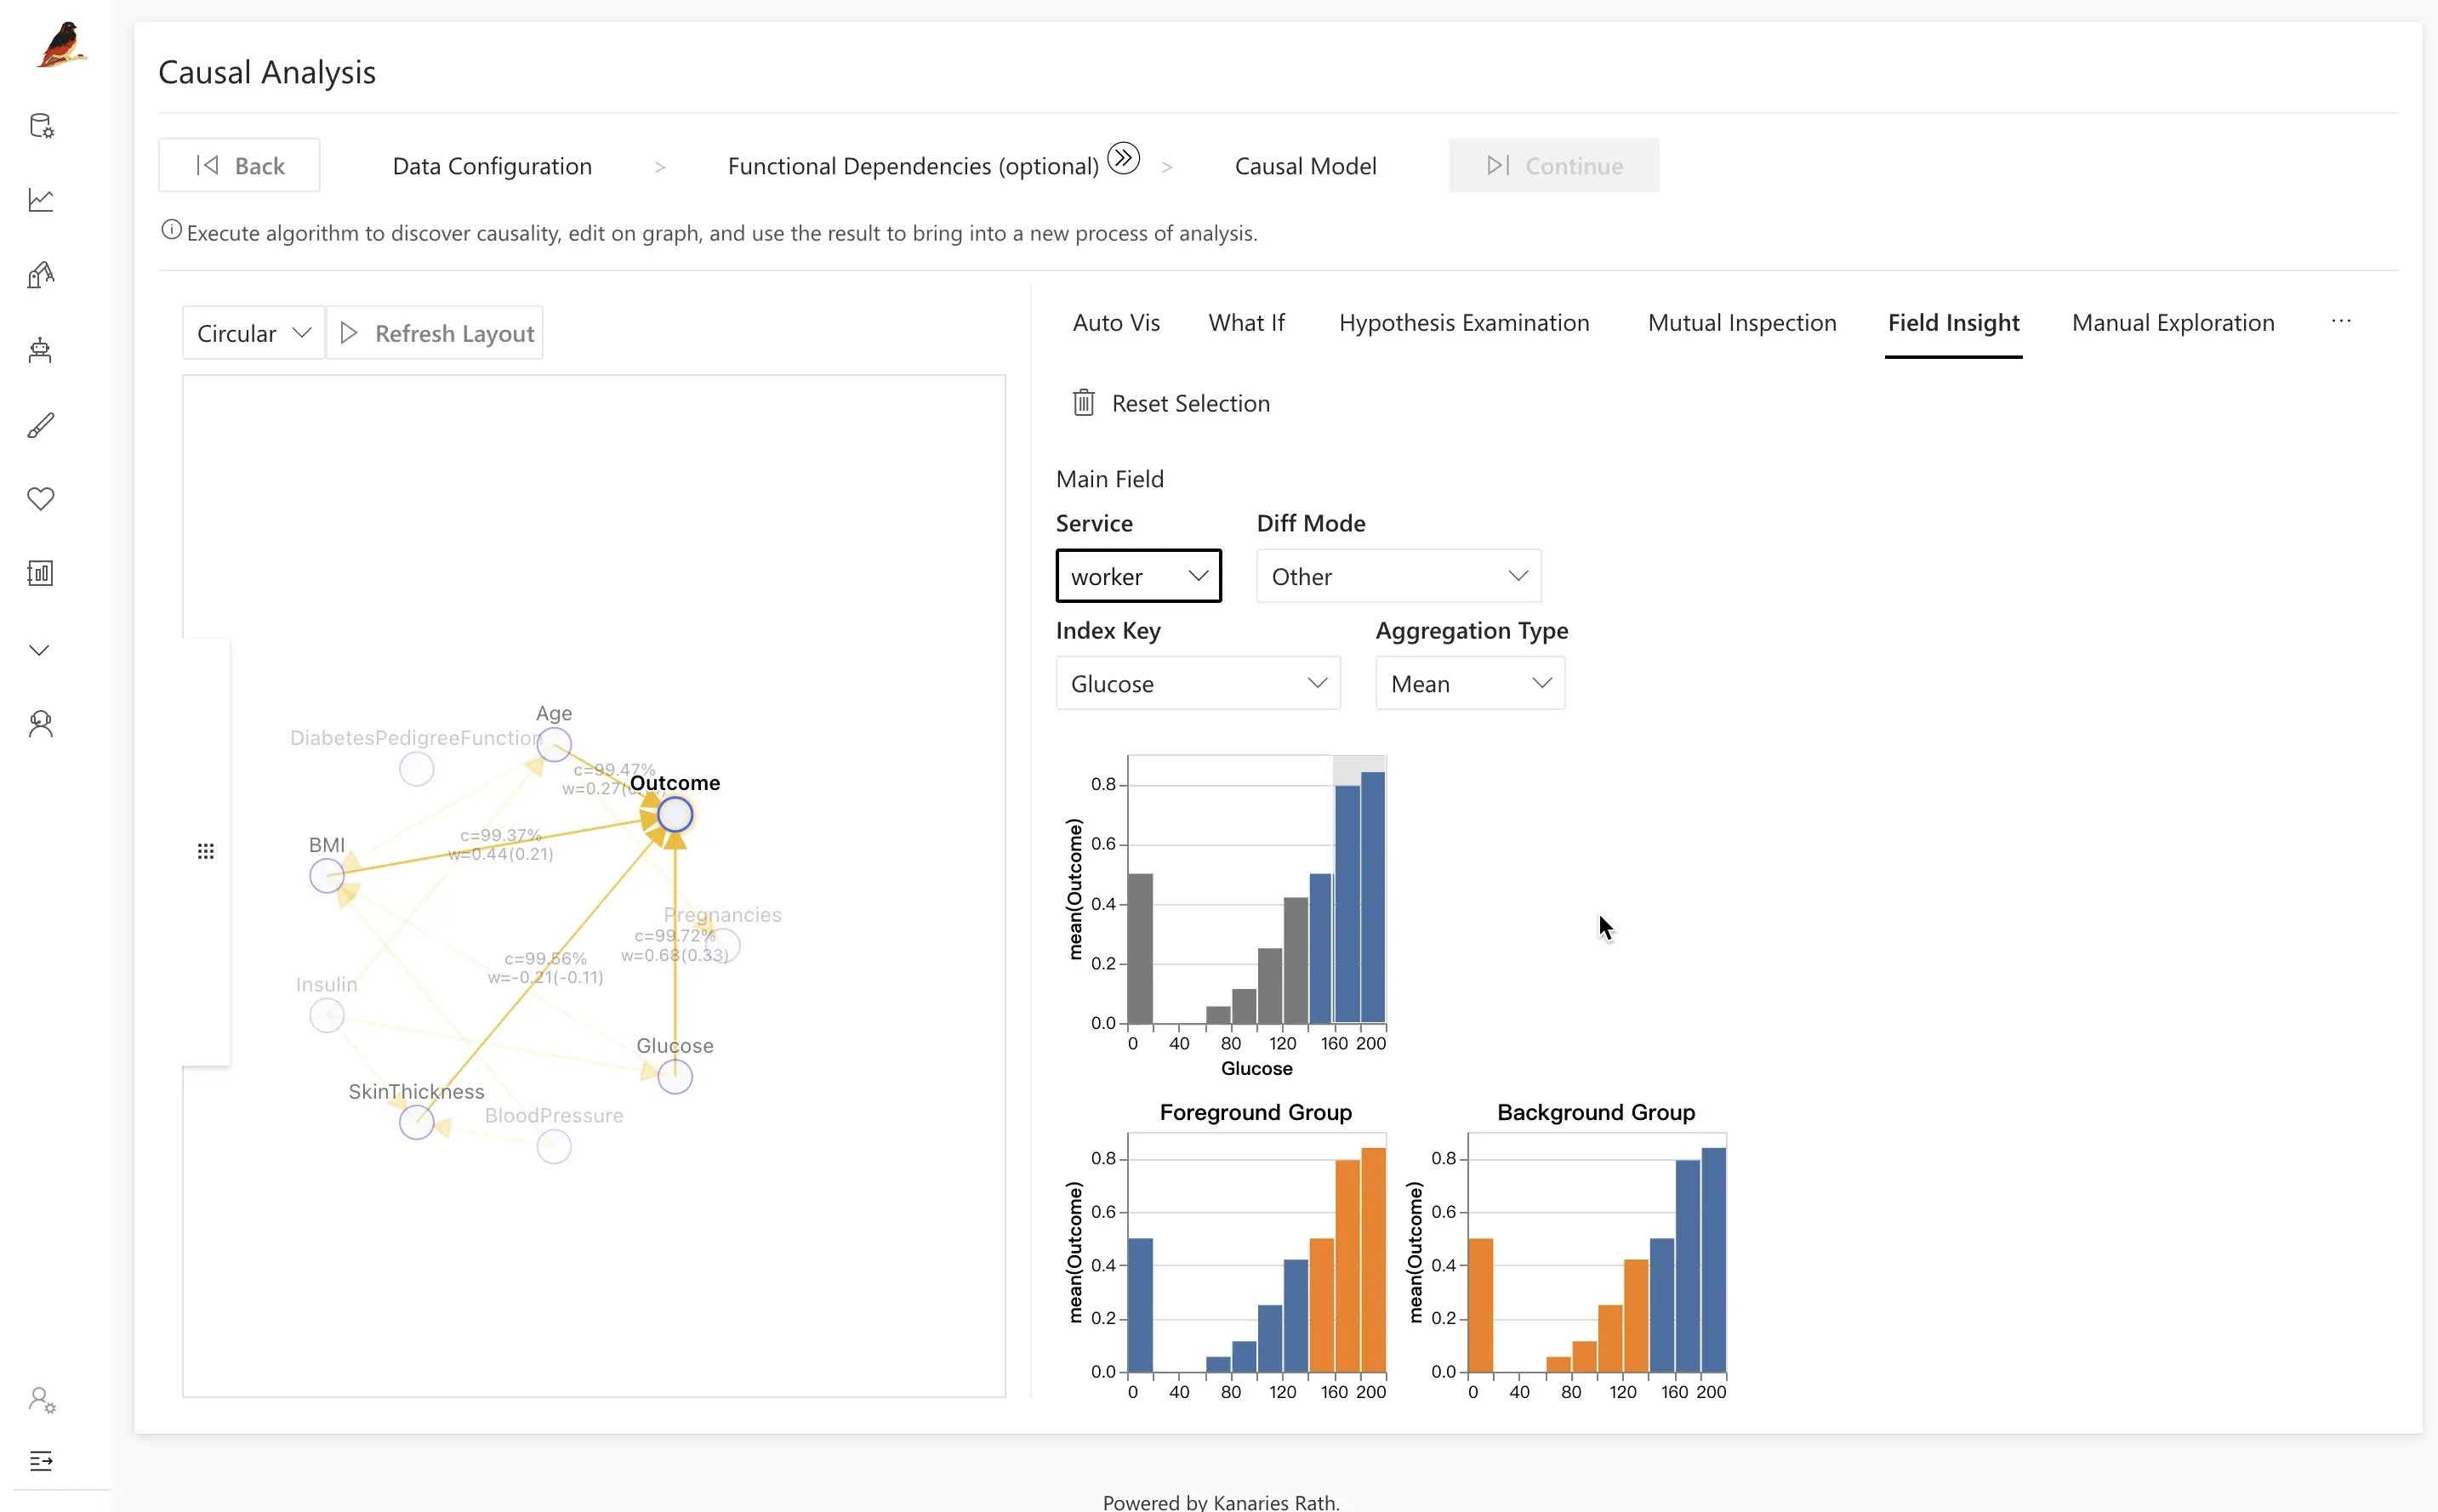
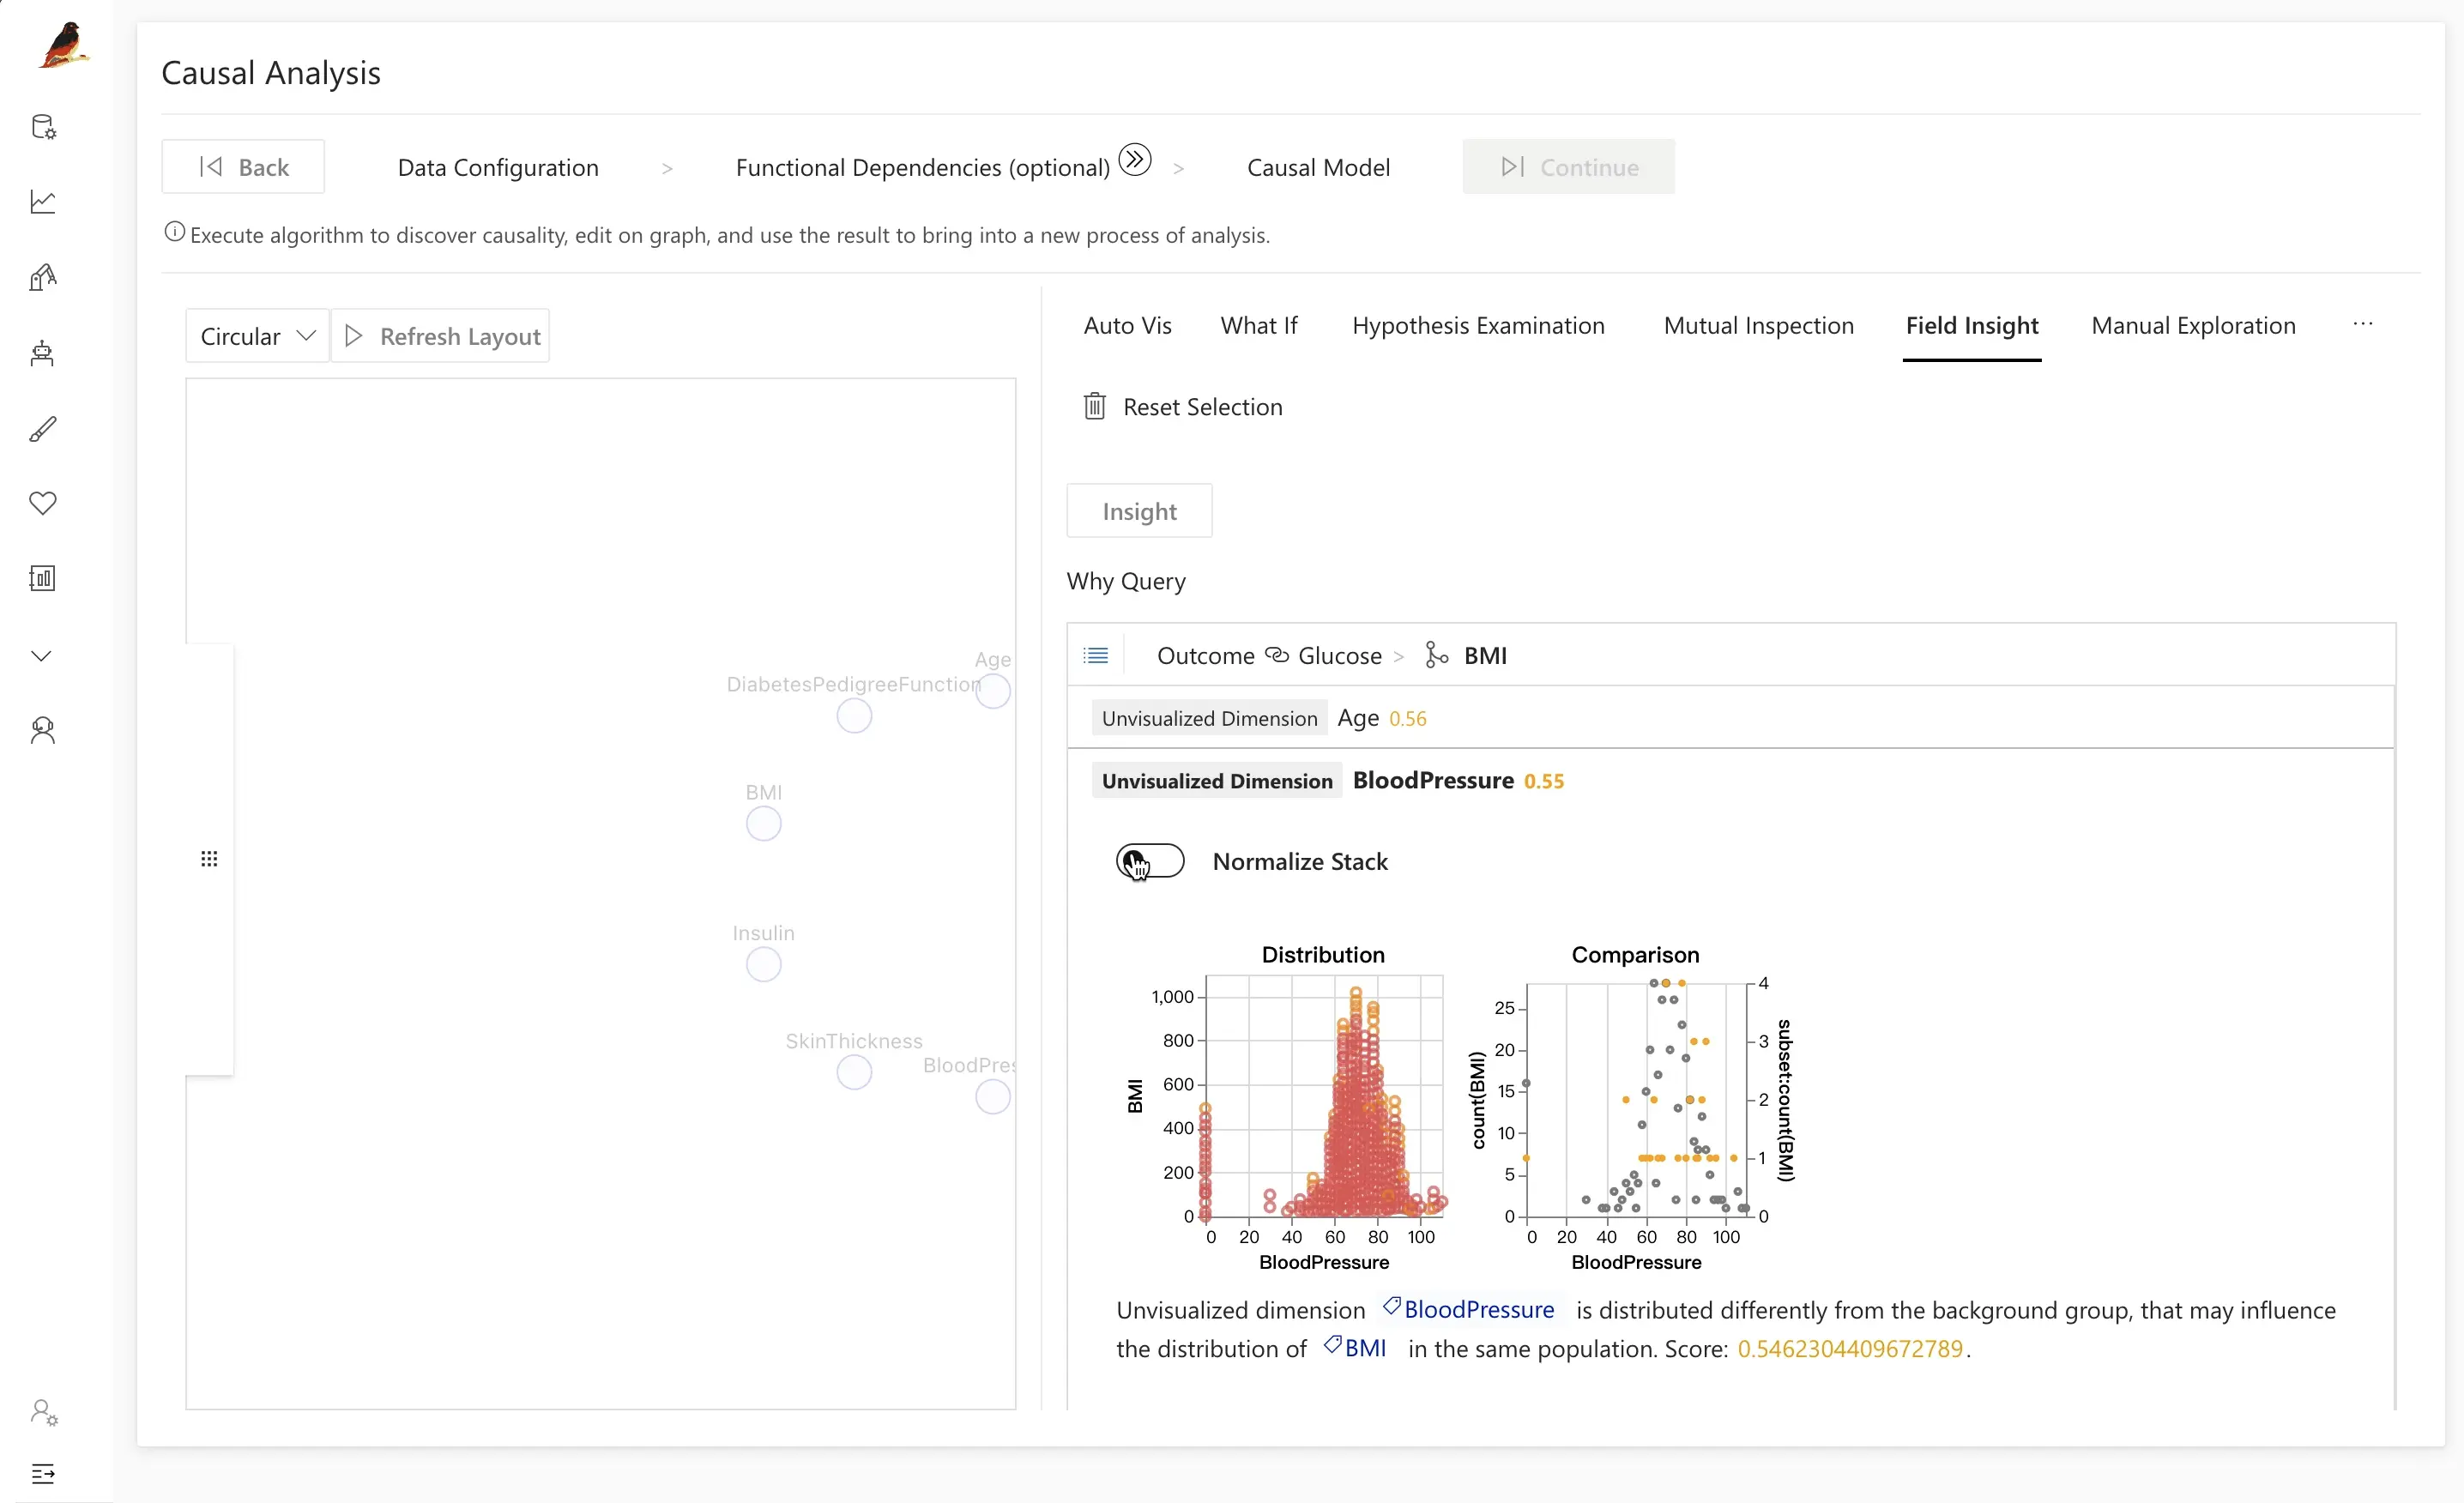
As shown in the example provided, a comparison of diabetic and non-diabetic patients reveals that the difference between the two groups may be due to factors such as BMI, age, and Glucose. By clicking on the latent factor of Glucose, it is evident that the distribution of glucose differs significantly between the two groups, with the diabetic population having a higher distribution as indicated by the orange color.
Step 3.2. Manual exploration
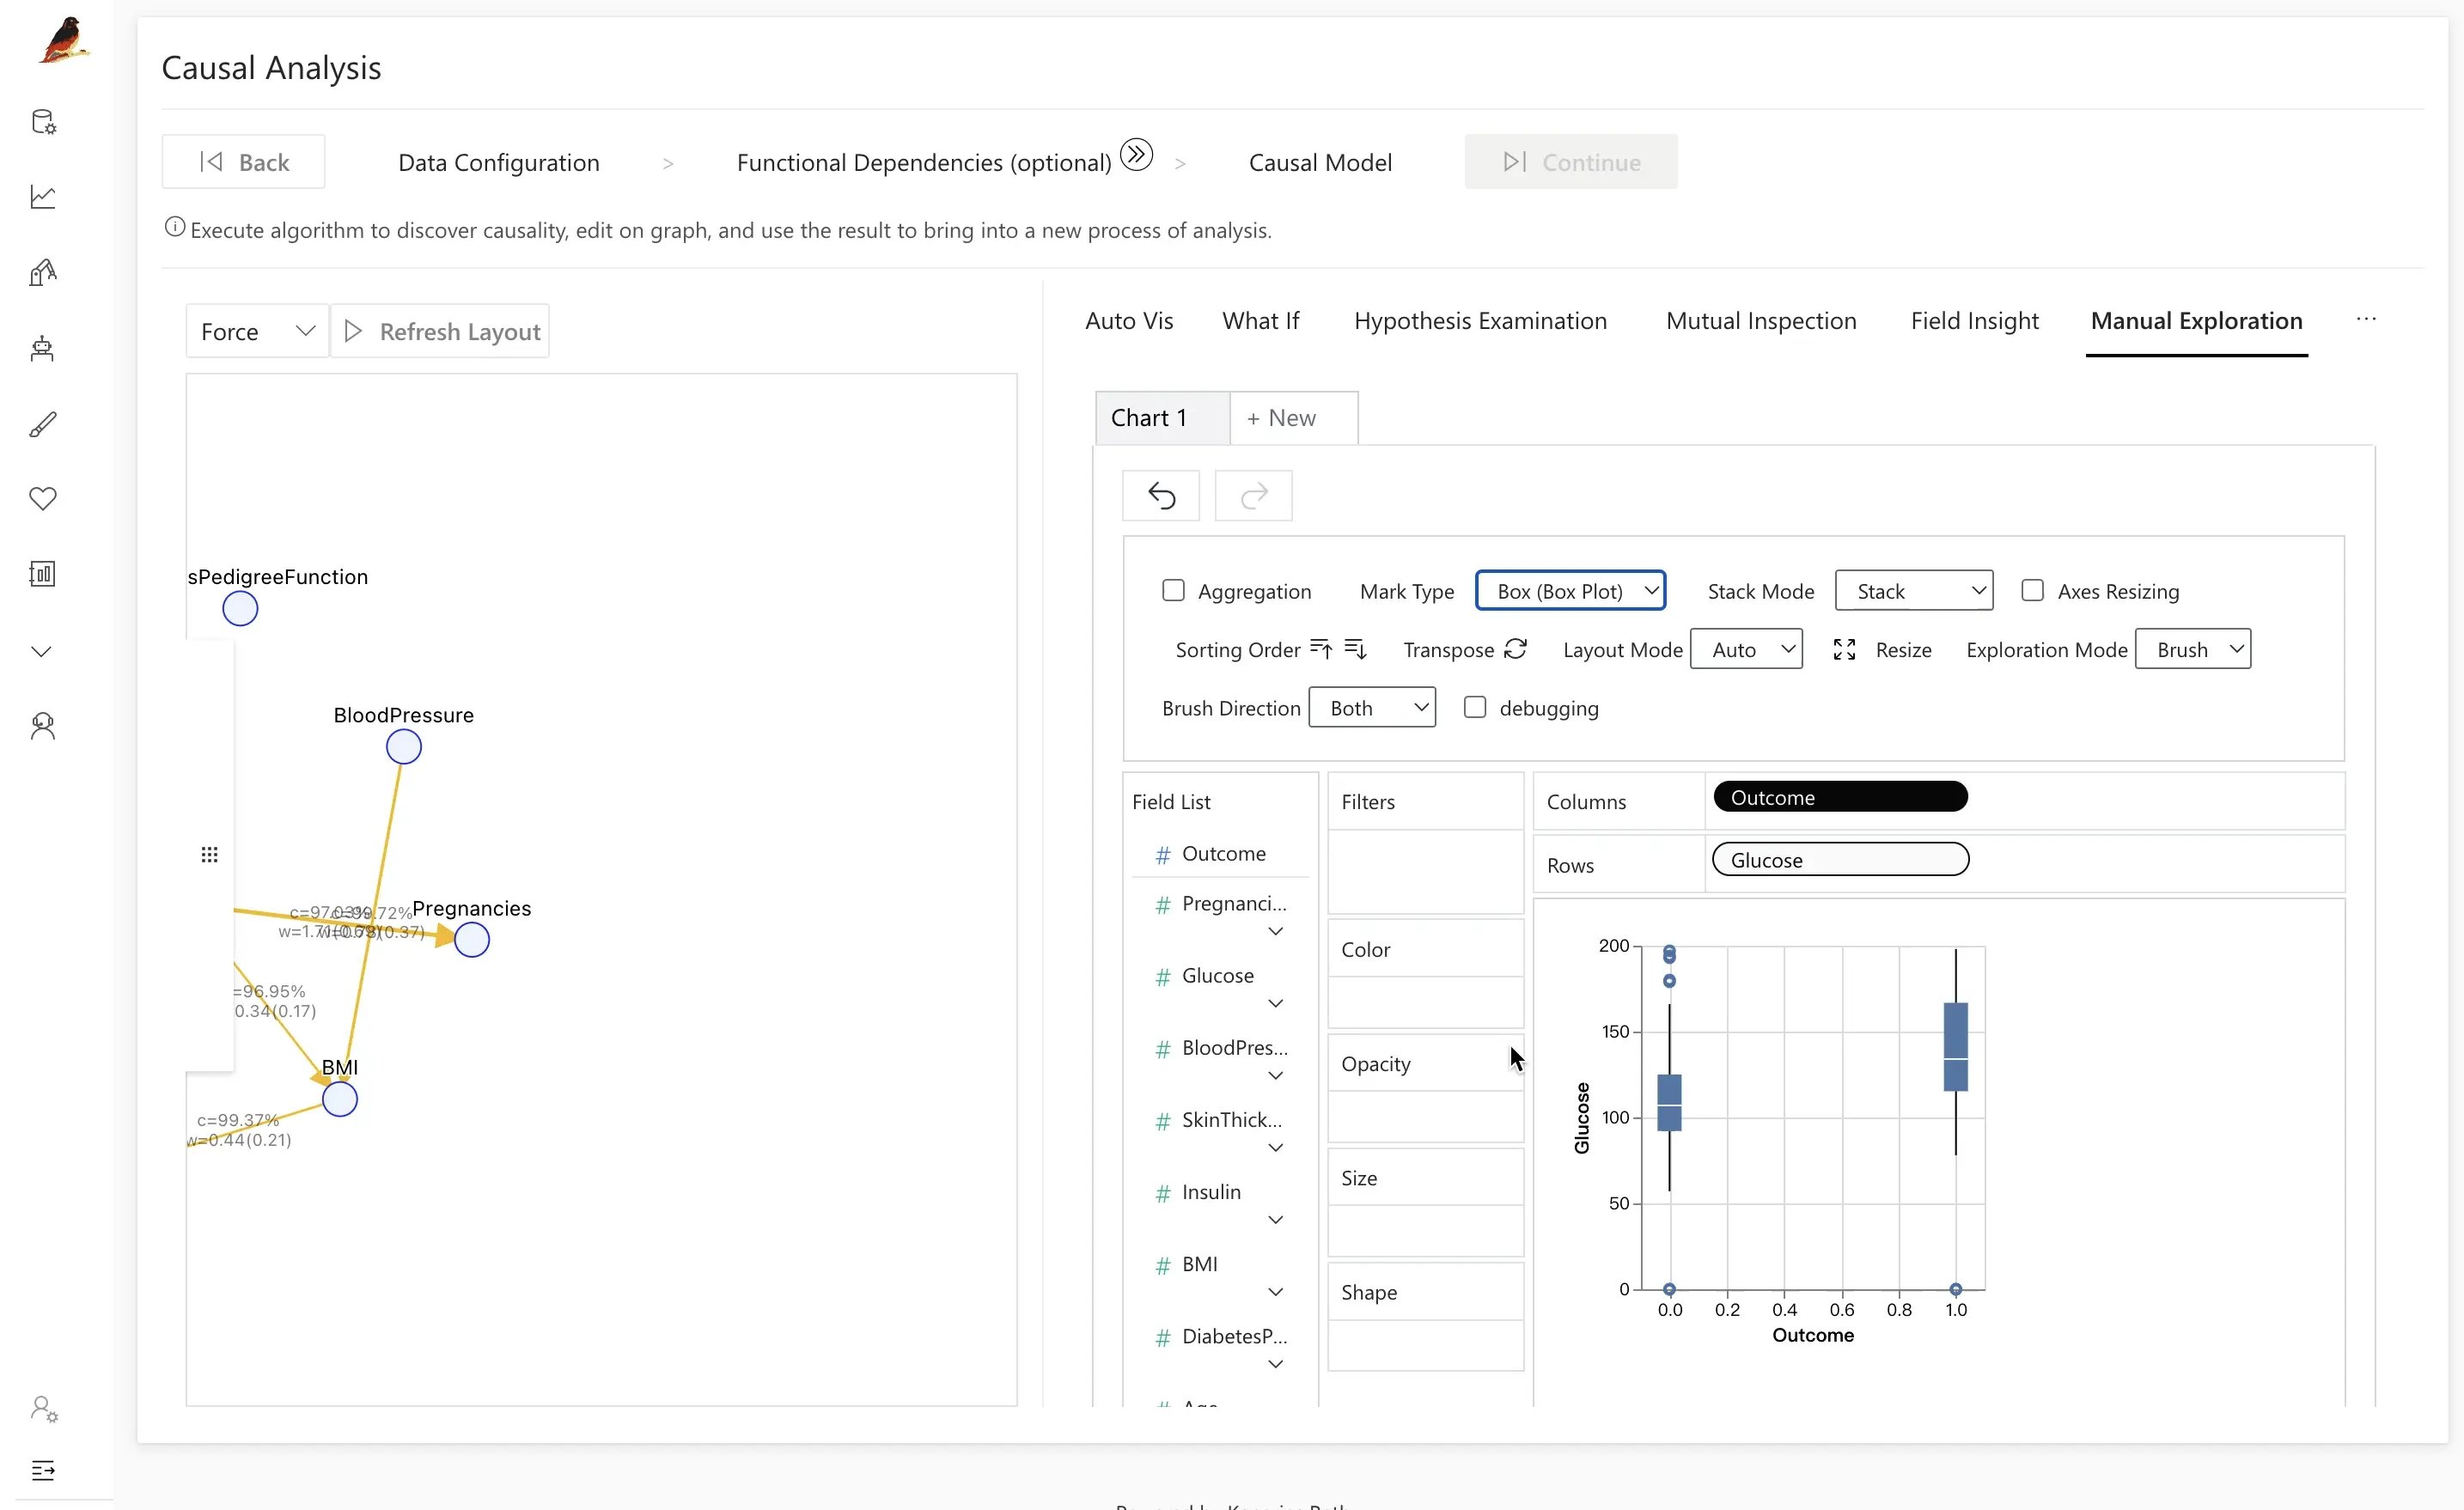
You can use manual exploration to verify certain assumptions about causality using a visual interface.
For example, exploring the Kaggle database titled "diabetes" shows that insulin levels are not a direct cause of diabetes. The relationship between outcome and glucose can be visualized using these tools, visually revealing that the insulin of the diseased group is higher than the healthy group.
To analyze data traditionally, we often study variable correlation or feature importance to identify relationships between two variables. However, this approach may overlook the specific impact mechanism that underlies the relationship.
To address this, RATH provides Causal Analysis, which helps us better understand the causal relationships between variables. By incorporating the results of Causal Analysis, we gain a deeper understanding of the specific impact mechanism.
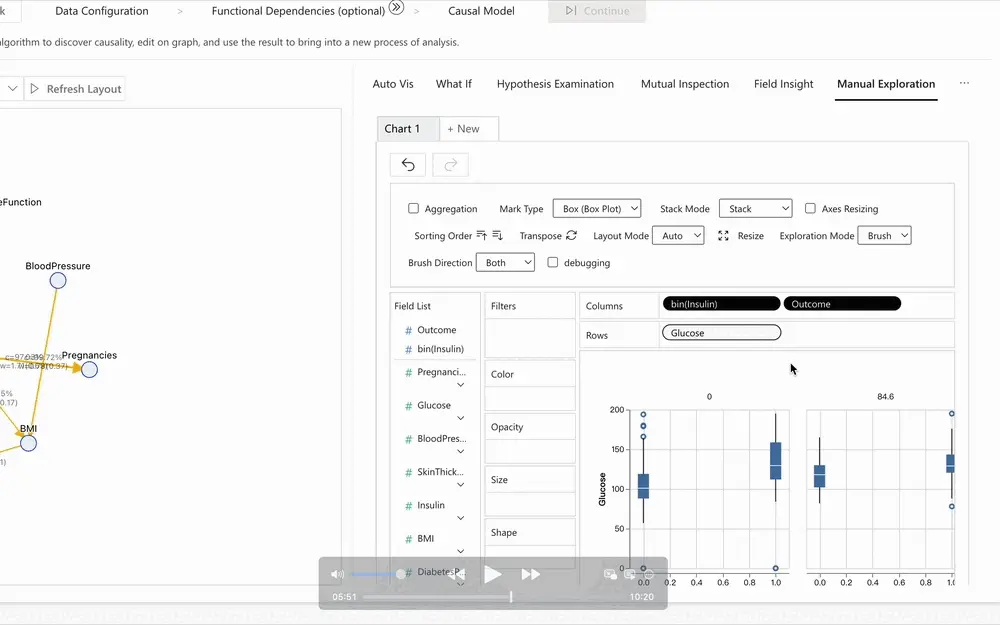
In the following graphic, we introduce Insulin between Outcome and Glucose variables. We observe that there is no significant difference in insulin between the diseased and healthy groups when controlling for different Insulin intervals. This suggests that the relationship between Outcome and Glucose variables is weaker than we originally thought when the factor of Insulin is introduced.
Step 3.3: Mutual Inspection
Use the Mutual Inspection tool to gain a deeper understanding of the causal relationship of your data or verify assumptions of causal relationships between variables.
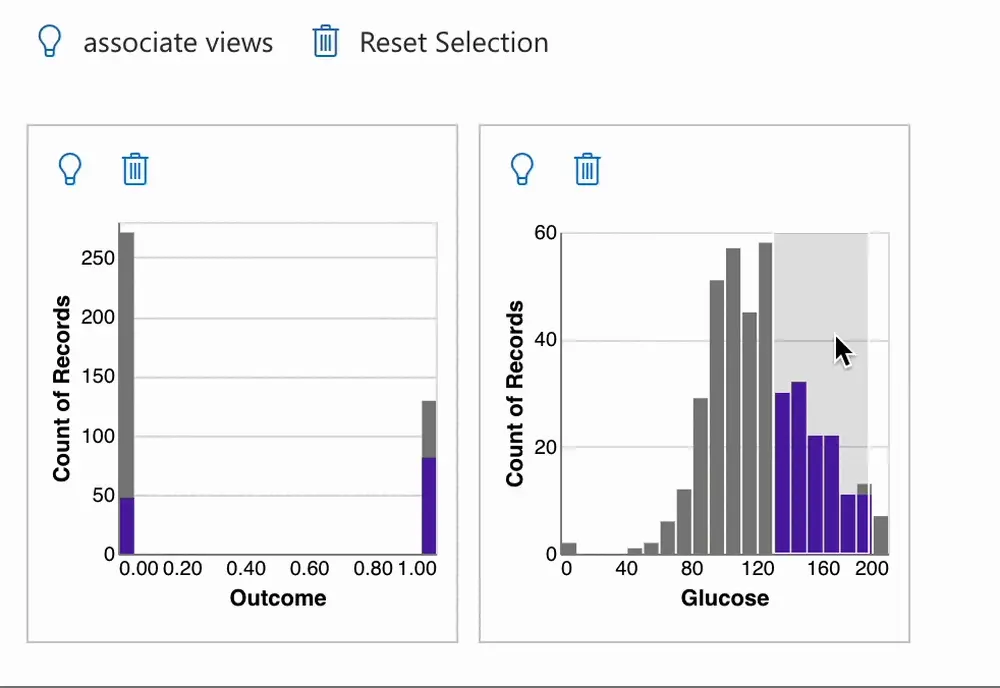
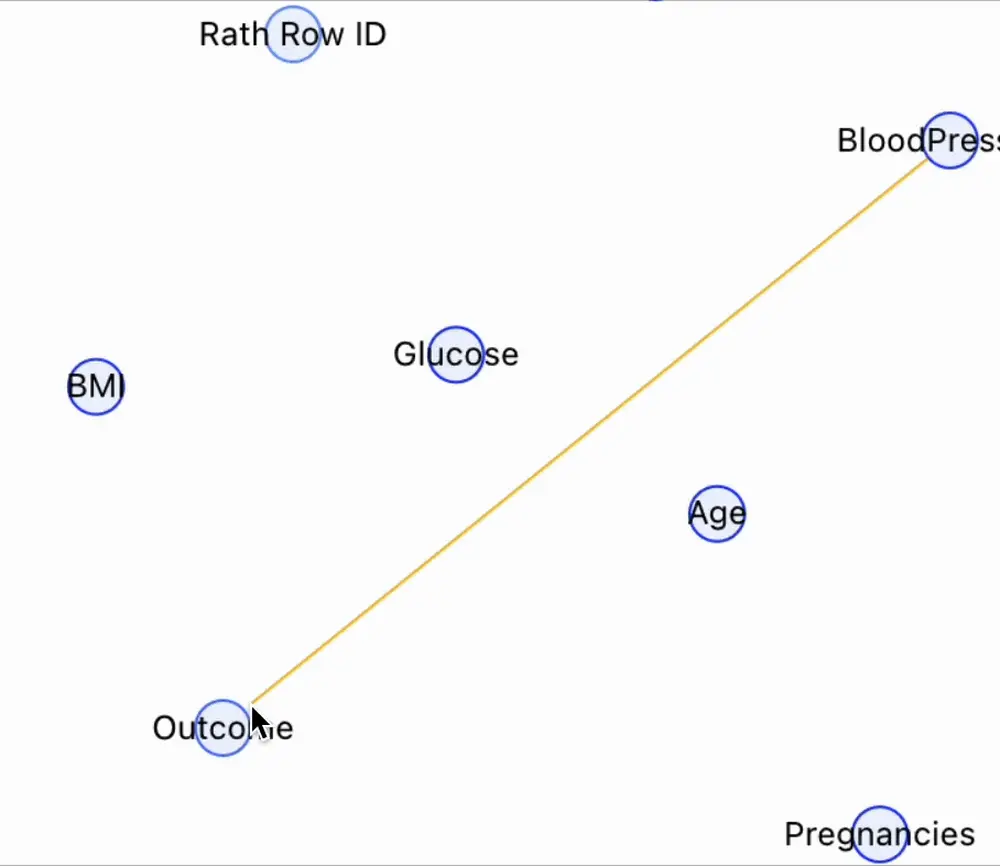
This tool generates interactive graphics to help you understand how variables affect each other. Click on a node in the causality diagram to add the distribution diagram of the corresponding variable to the verification module on the right. For instance, if you want to explore the relationship between Glucose and Outcome in your study, you can use this tool.
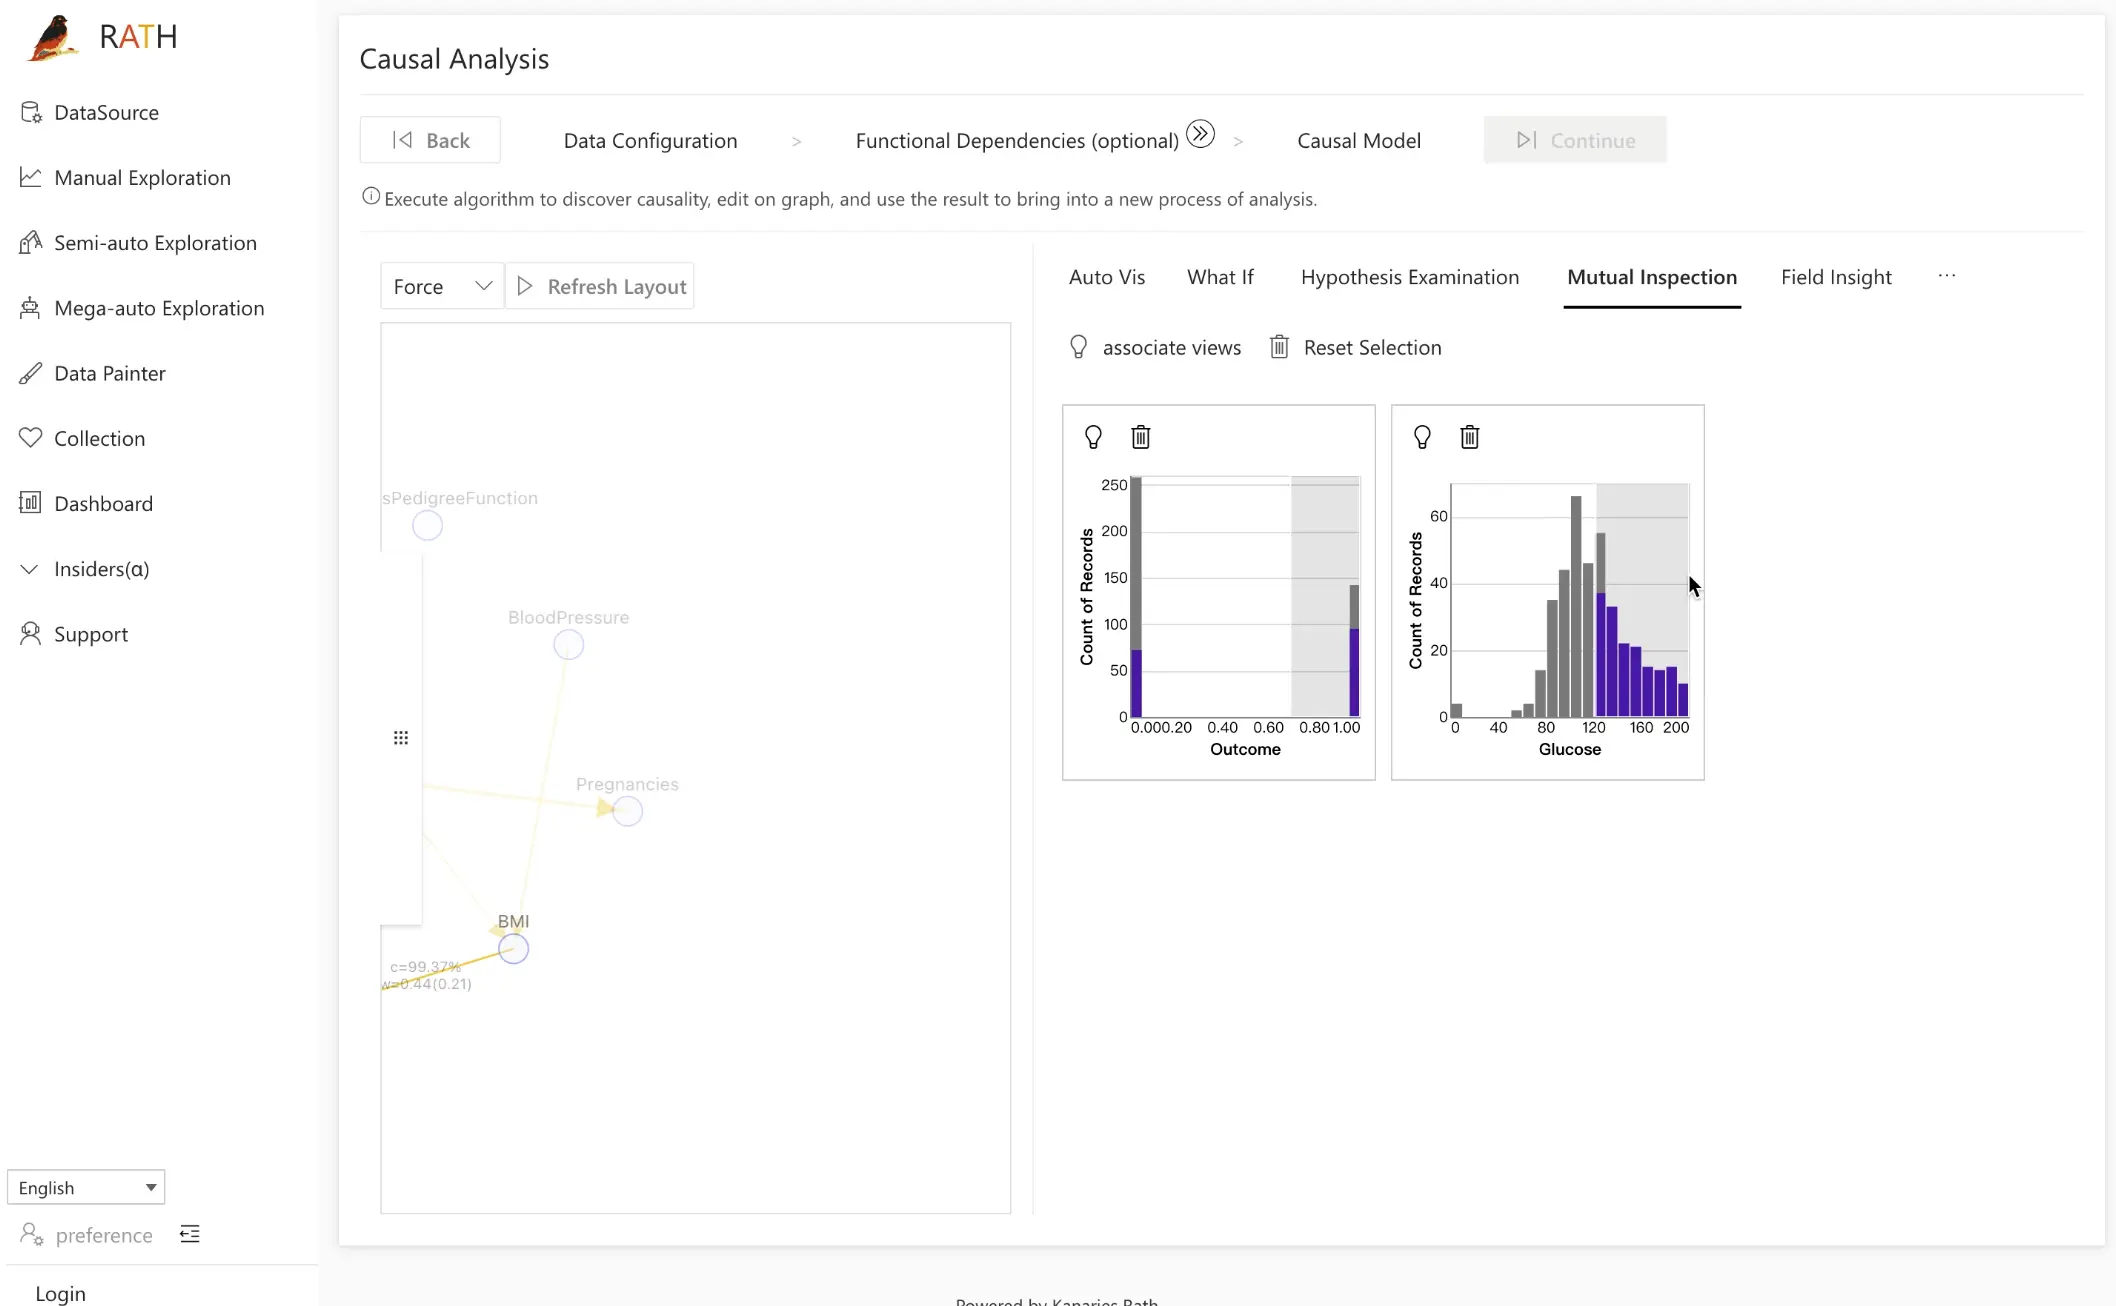
When we select a range of Glucose, drag this range, and observe the distribution of Outcome, we can observe a positive correlation between the two factors.
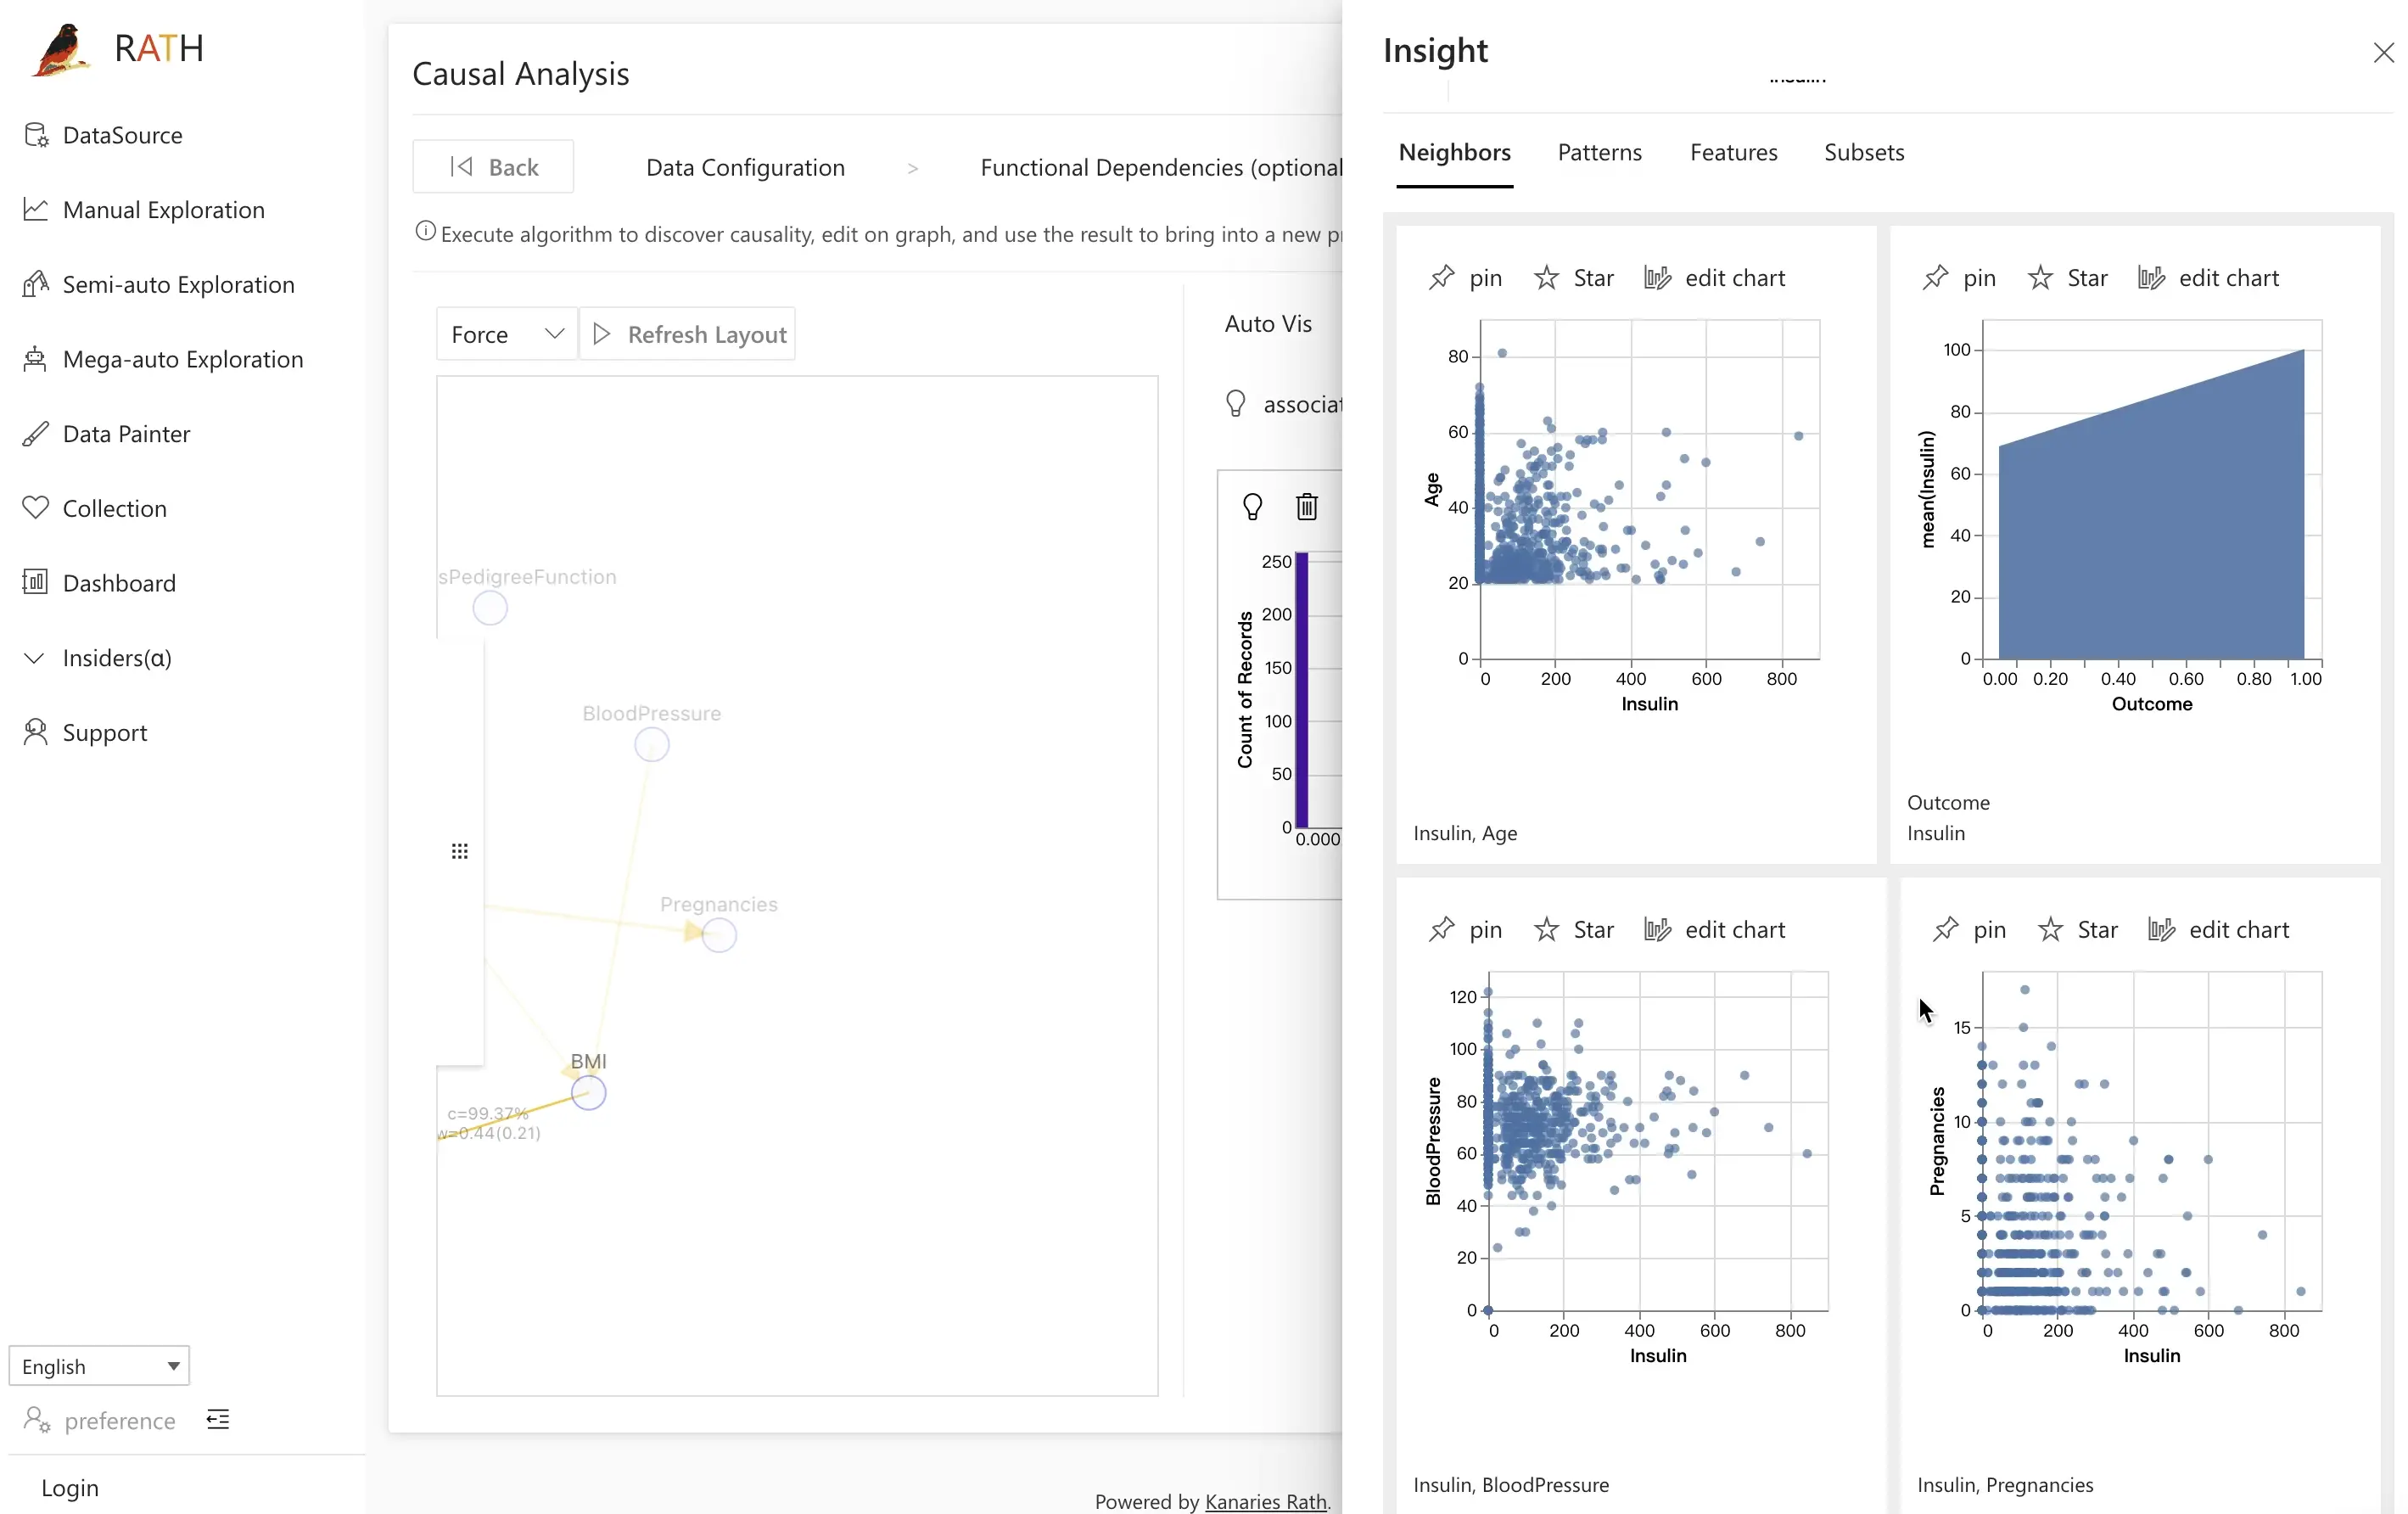
You can also use the Semi-auto Exploration feature by clicking on the associate views button to further study the relationship between variables. This feature generates recommended scatter plots to help you explore the possible relationship between the two factors.
Step 3.4. Prediction test
Advanced users can debug and deploy machine learning models with the Prediction Test feature. It enables you to freely edit causal models and apply advanced machine learning algorithms.
Click on the Outcome variable, and RATH will automatically create a simple machine-learning model for classification or regression tasks based on causality.
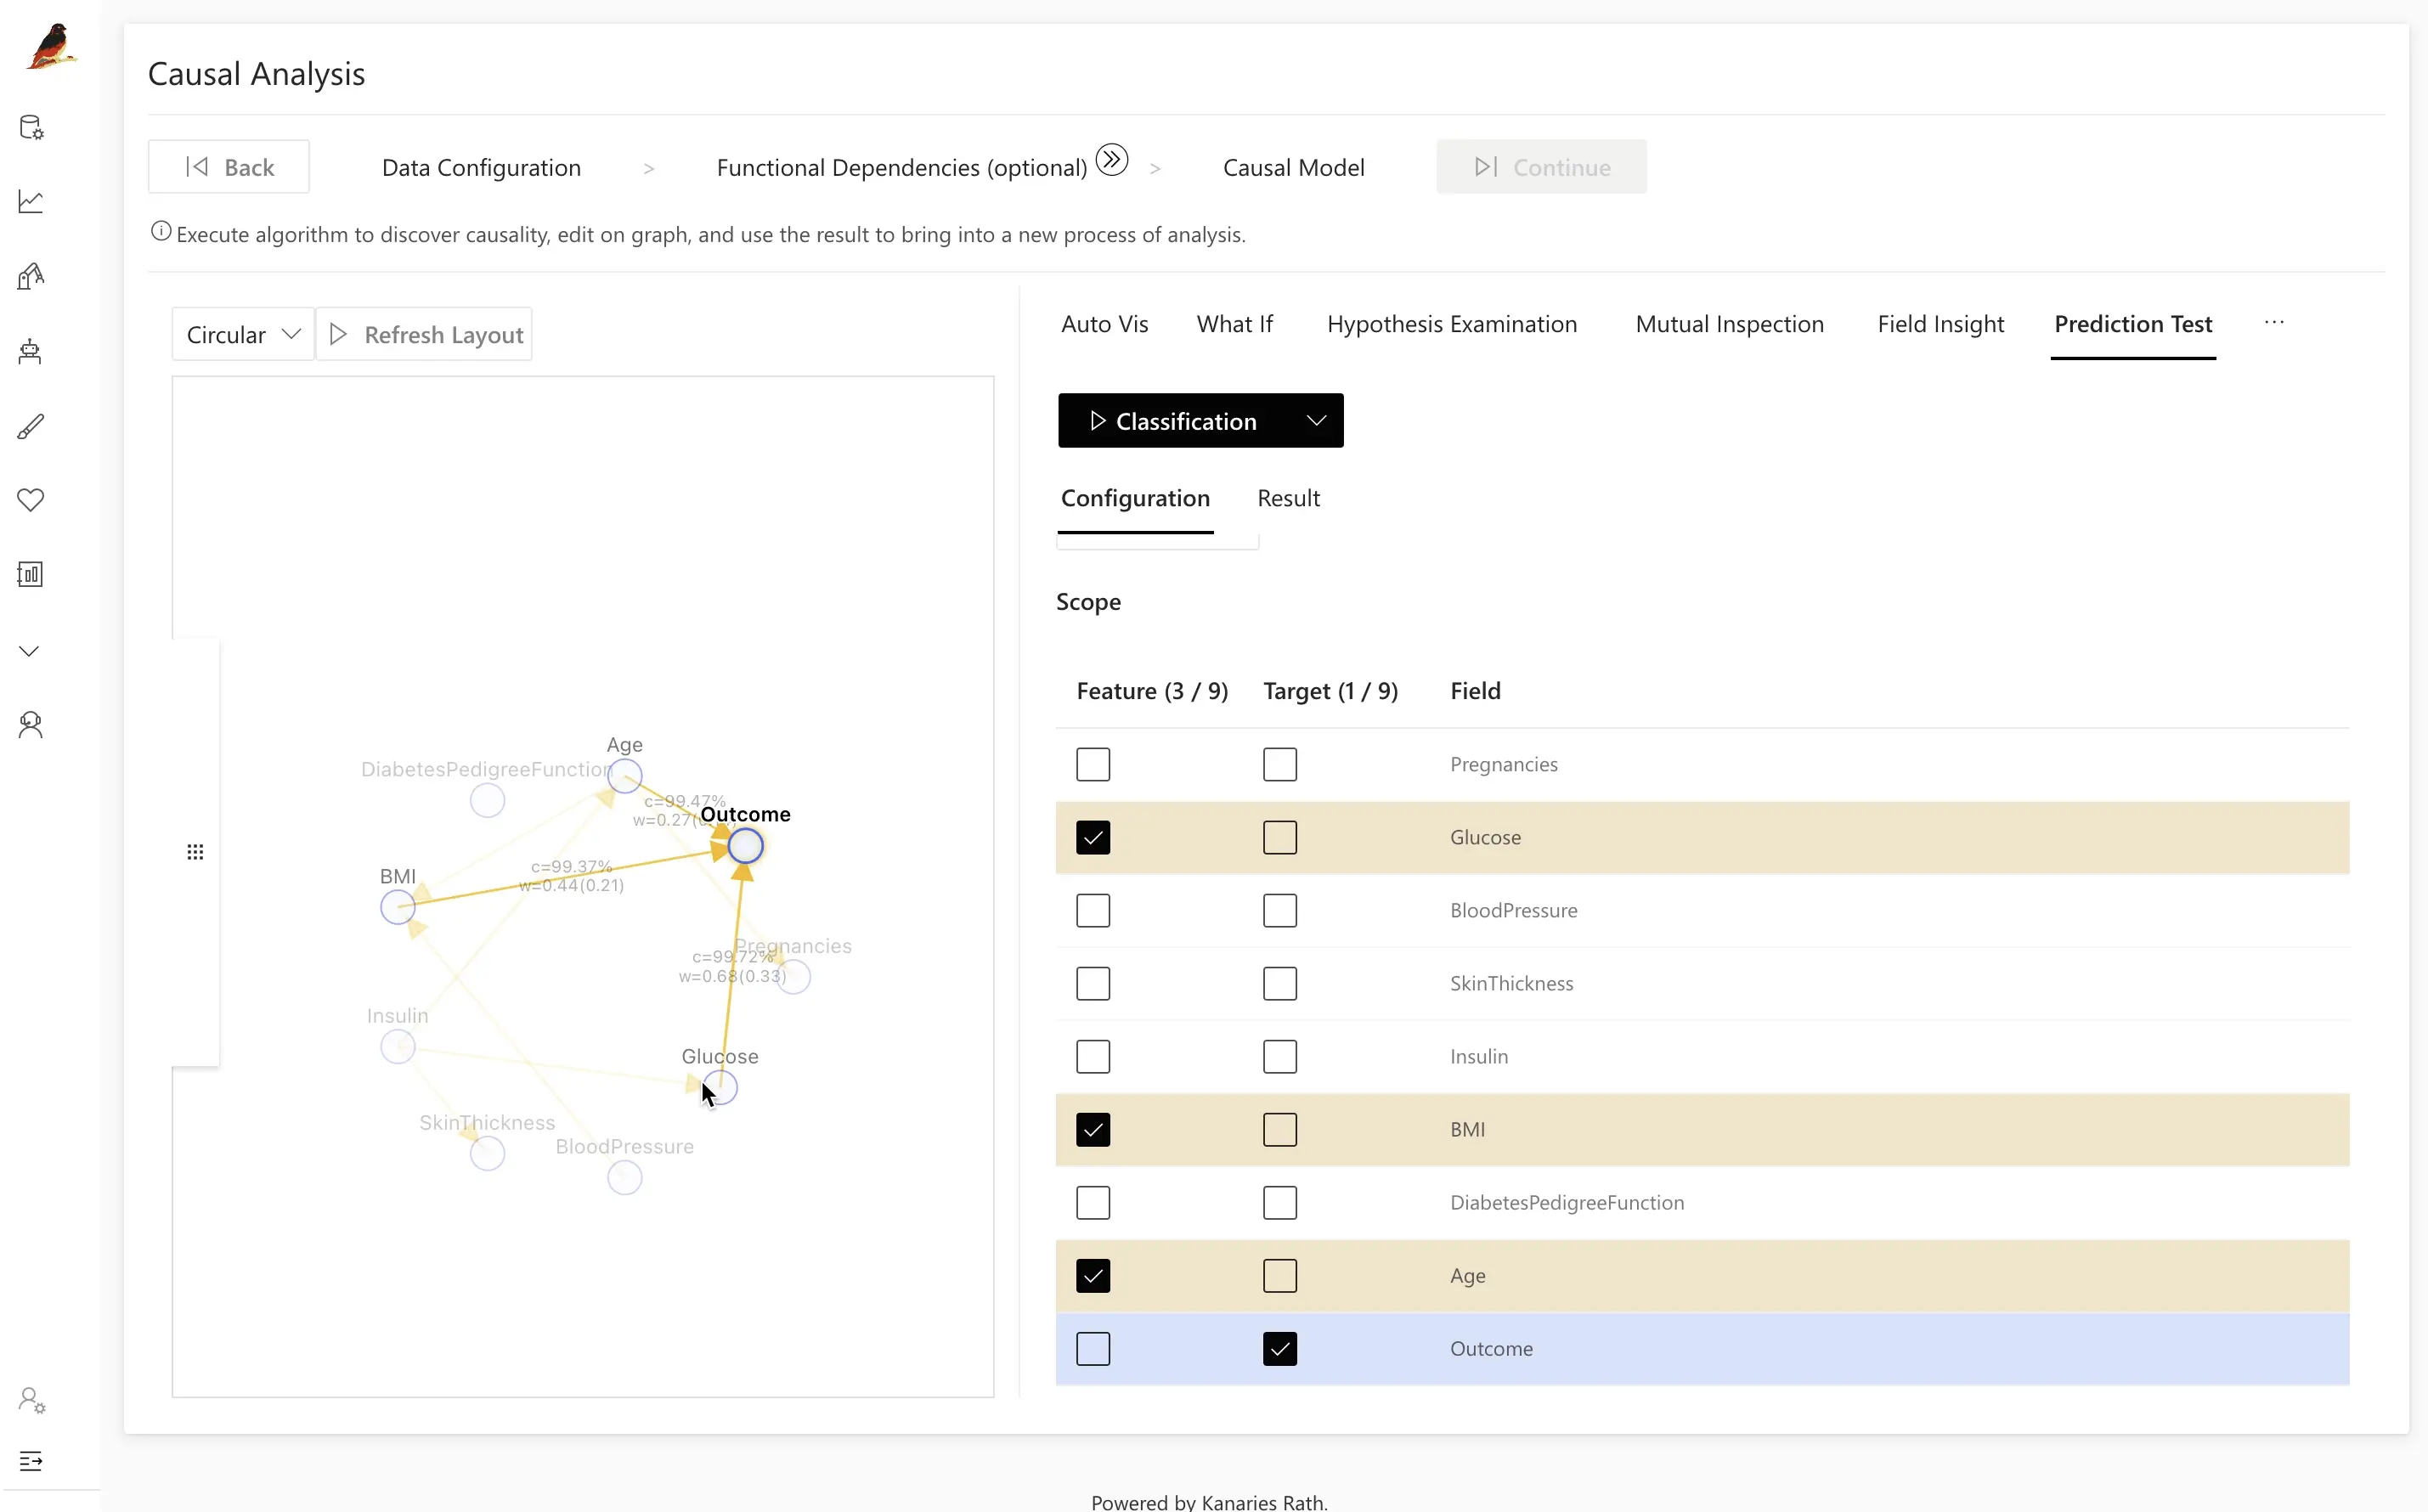
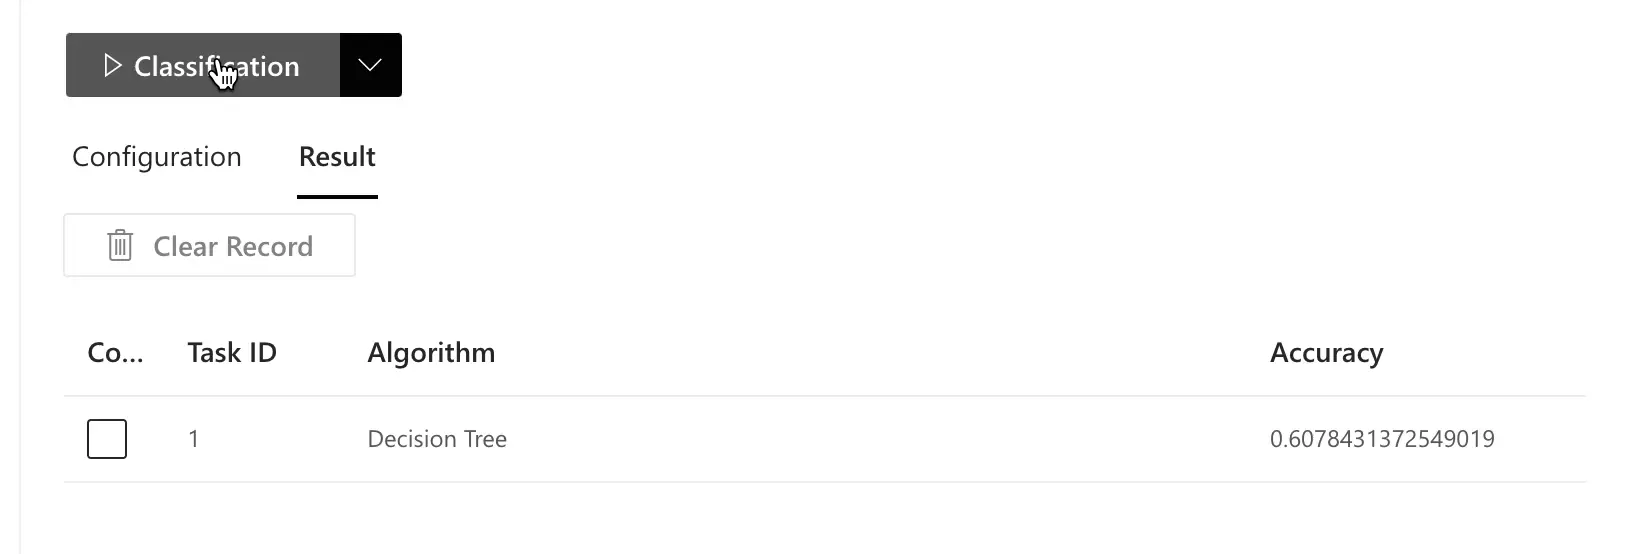
Click the Classification button to train the model and produce its Accuracy.
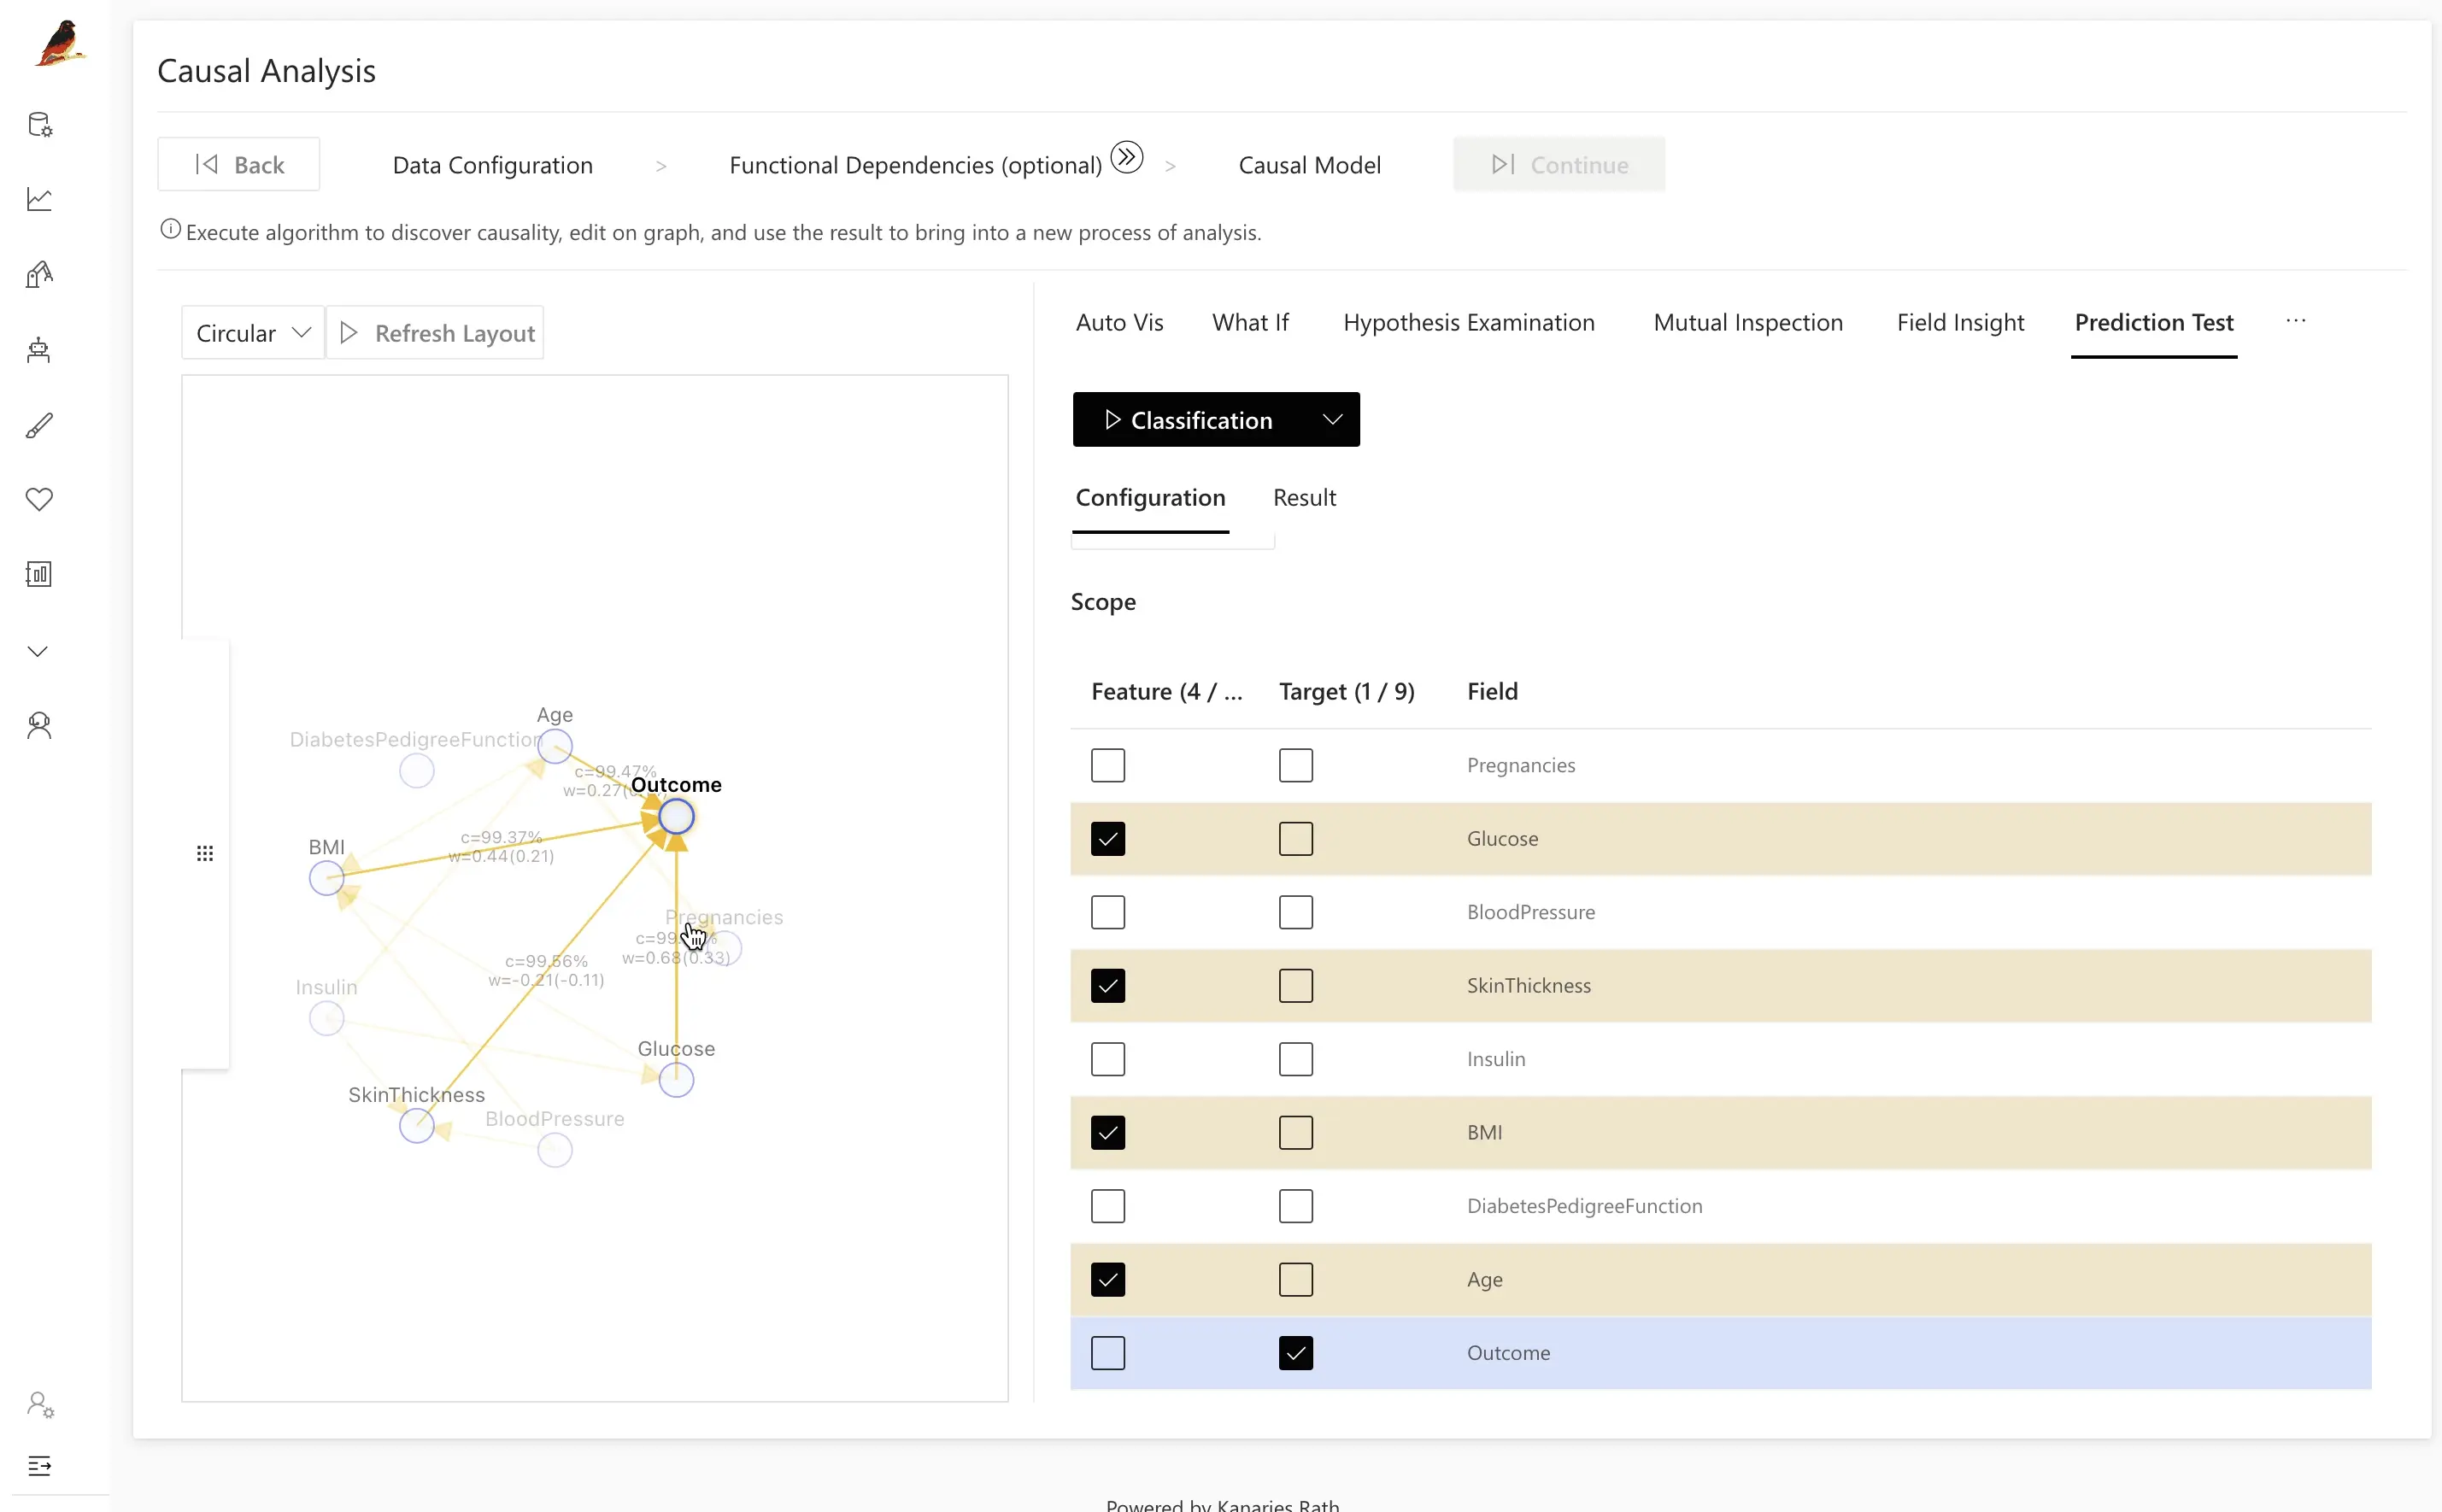
You can adjust your testing strategy by observing the causal model and selecting more efficient influencing factors according to the causal relationship to modify your causal model. For comparison, we deliberately avoid the features selected by RATH based on causality and attempt to train a different model.
As shown in the graphic below, the accuracy of the model created by RATH is significantly better than the model we created for comparison.
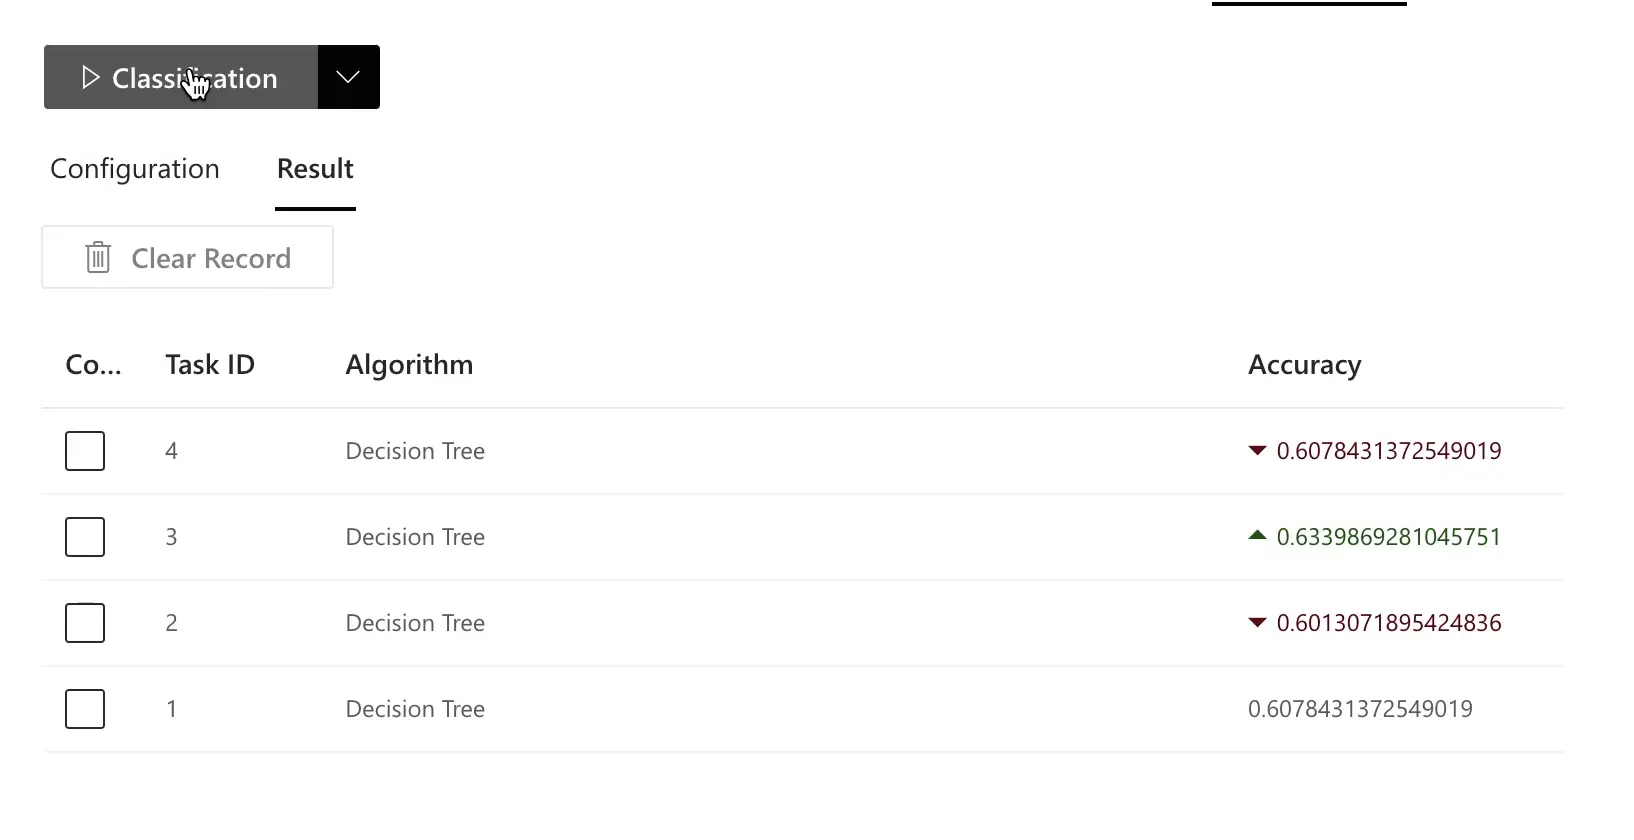
RATH is particularly suitable for handling massive data with a significant number of variables. It can help you find better features and create more accurate machine-learning models.
Edit causal model
Sometimes, RATH may produce unsatisfactory results due to data noise, insufficient data, or missing influencing factors. In such cases, you can directly edit the generated causal model.
To modify the model, open the panel on the left and turn on the Modify Constraints option, as shown in the screenshot below.
Drag and drop to edit the causal model. RATH will automatically generate new causal models based on your input.
Next steps
If you're a data analyst who wants to learn the What-if type of causal analysis, refer to the What-if Analysis chapter. For text pattern discovery, refer to the Text Pattern Extraction chapter.
RATH is also working on more user-friendly features such as the ability to generate text-based analysis and suggestions for decision-makers by analyzing an existing causal relationship model.