Workspace Tour
In this article, you are about to explore the User Interface for RATH, and take a look at the major features.
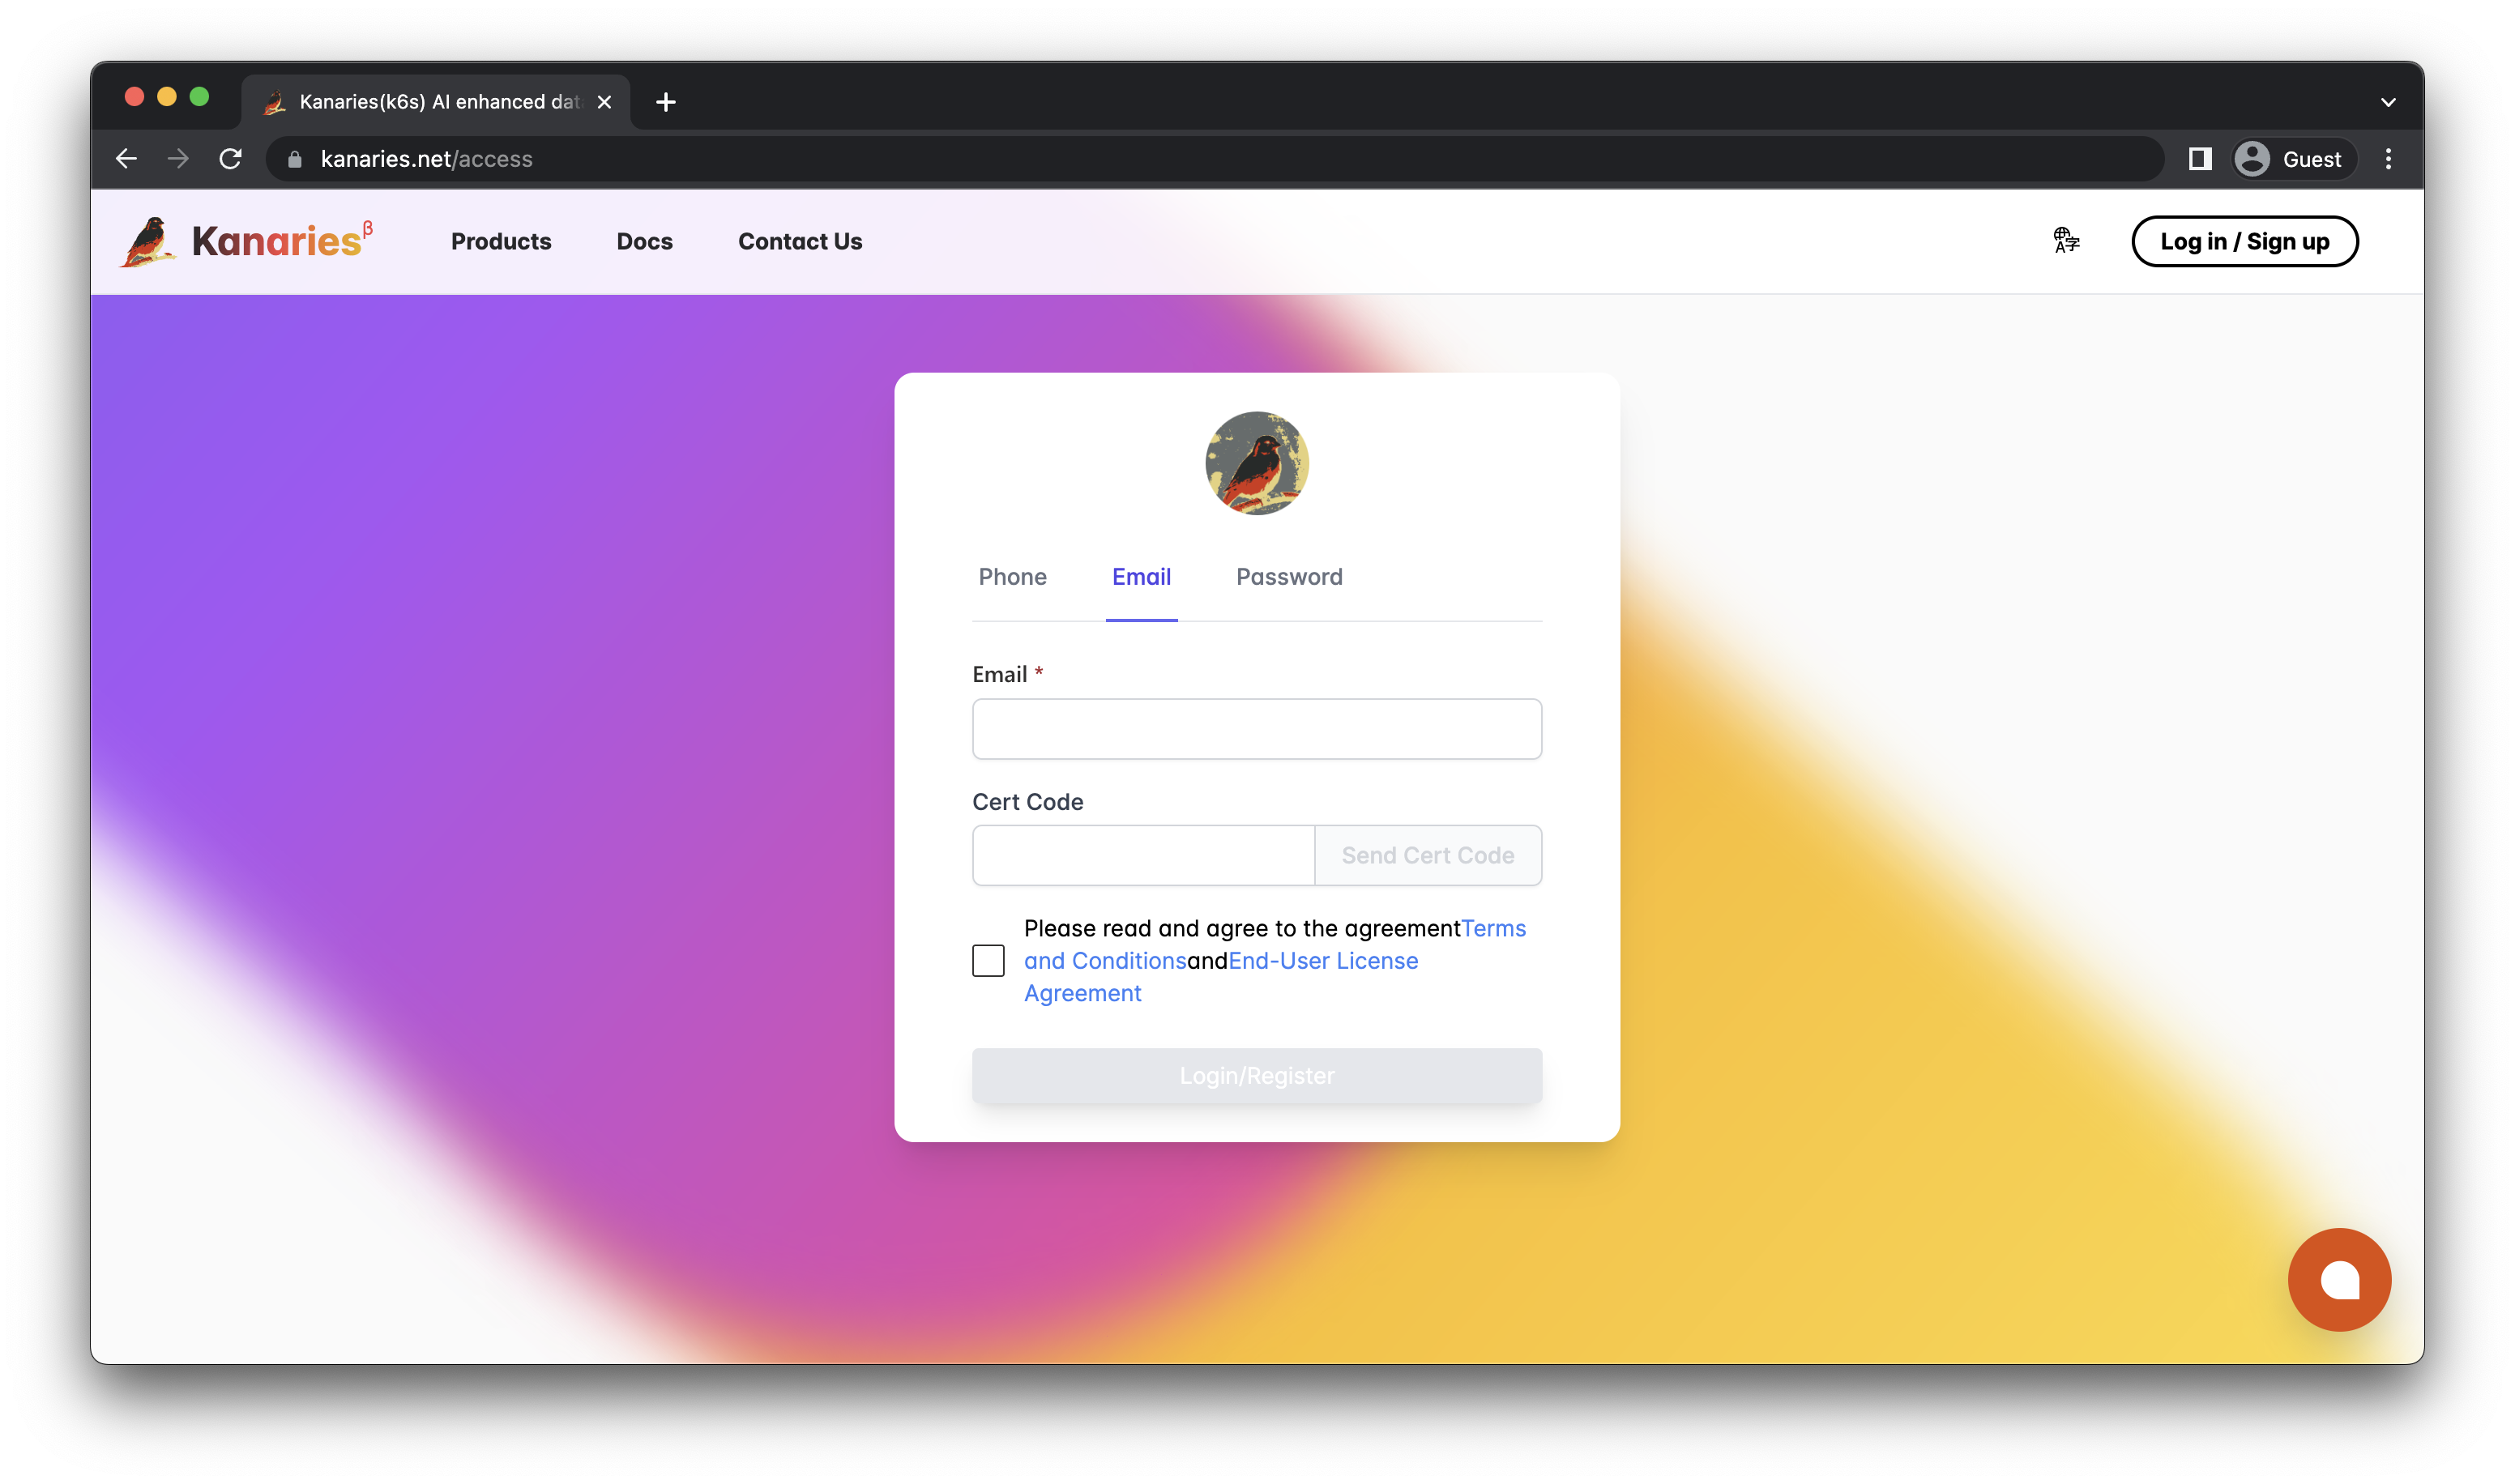
Create a RATH account
Before trying out RATH, you can either log into your existing account, or create a new one. You can use the account to access features such as Notebook, new feature previews, etc.
On the Products Page (opens in a new tab), RATH provides a variety of tools to choose from:
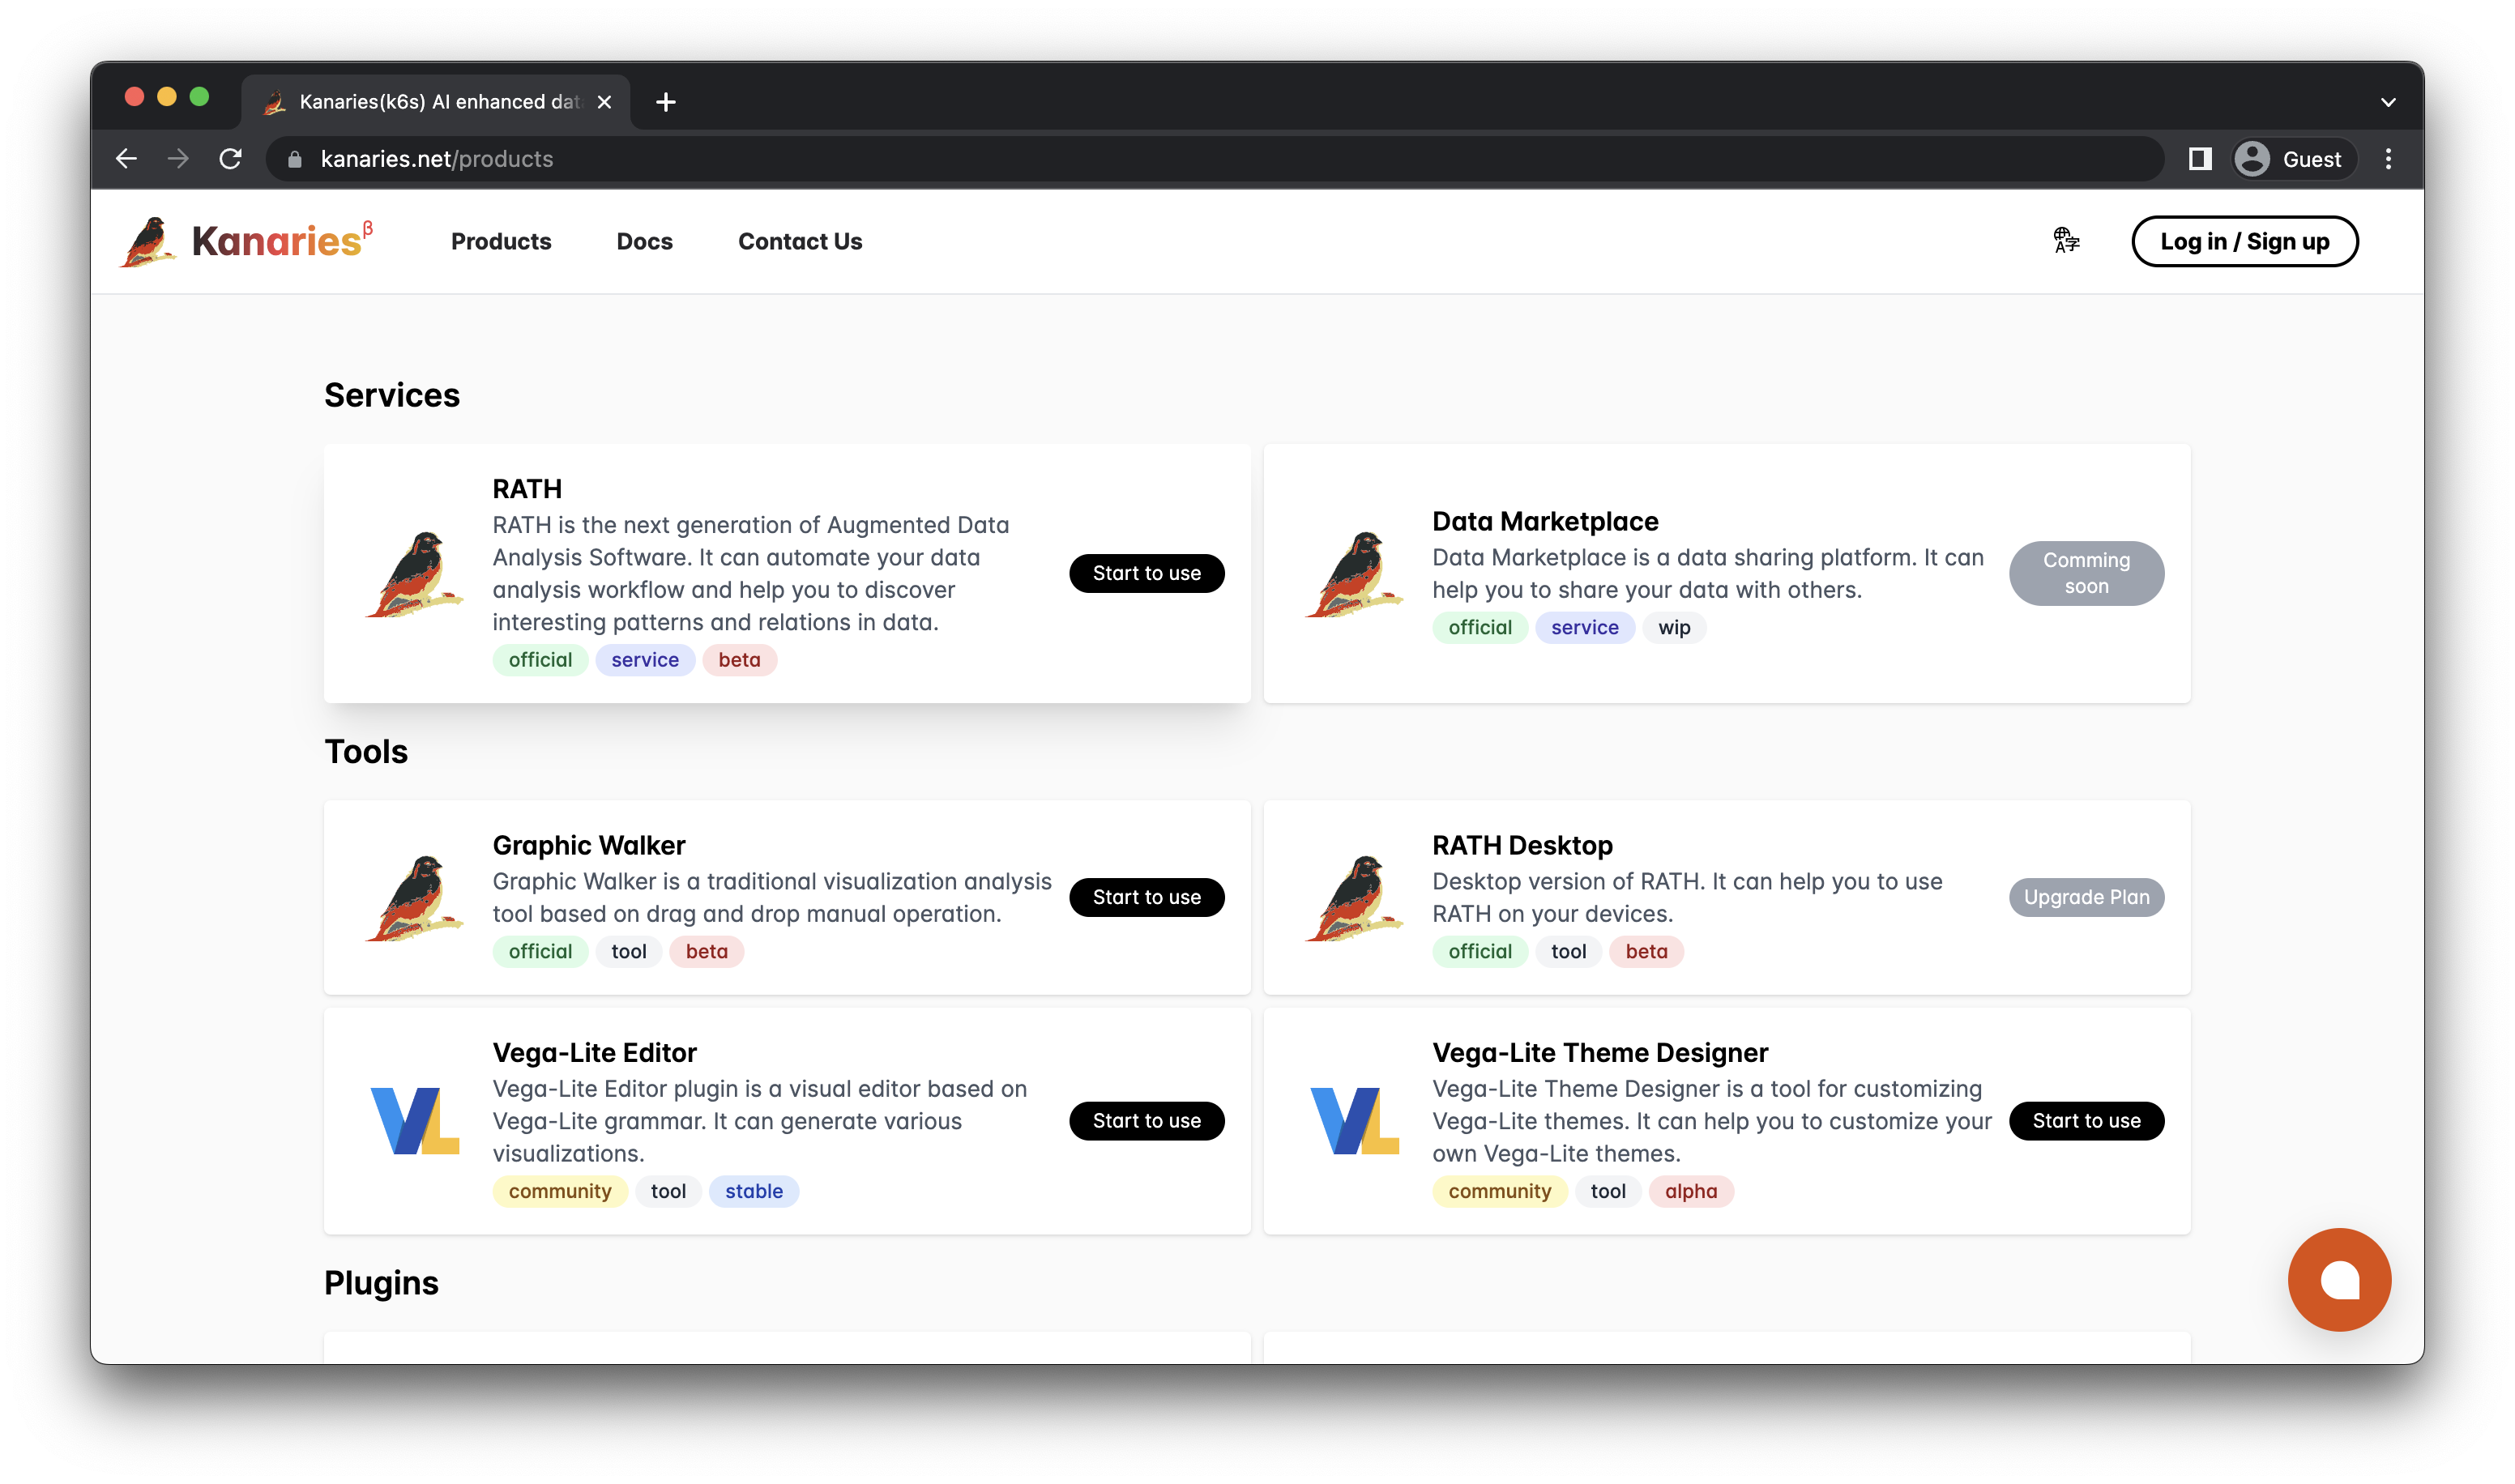
- RATH: The Augmented Analytics Software that runs in a browser.
- Data Marketplace(Coming Soon): A collaborative data-sharing platform that is similar to Kaggle.com.
- Graphic Walker: An embeddable Tableau alternative.
- Vega/Vega-Lite Editor: Editor for the Vega/Vega-Lite language to modify data visualizations.
- Vega/Vega-Lite Theme Editor: Customize Vega/Vega-Lite themes.
Connect to your data
Choose RATH to continue. On the next screen, you are about to select a data source and import it to RATH.
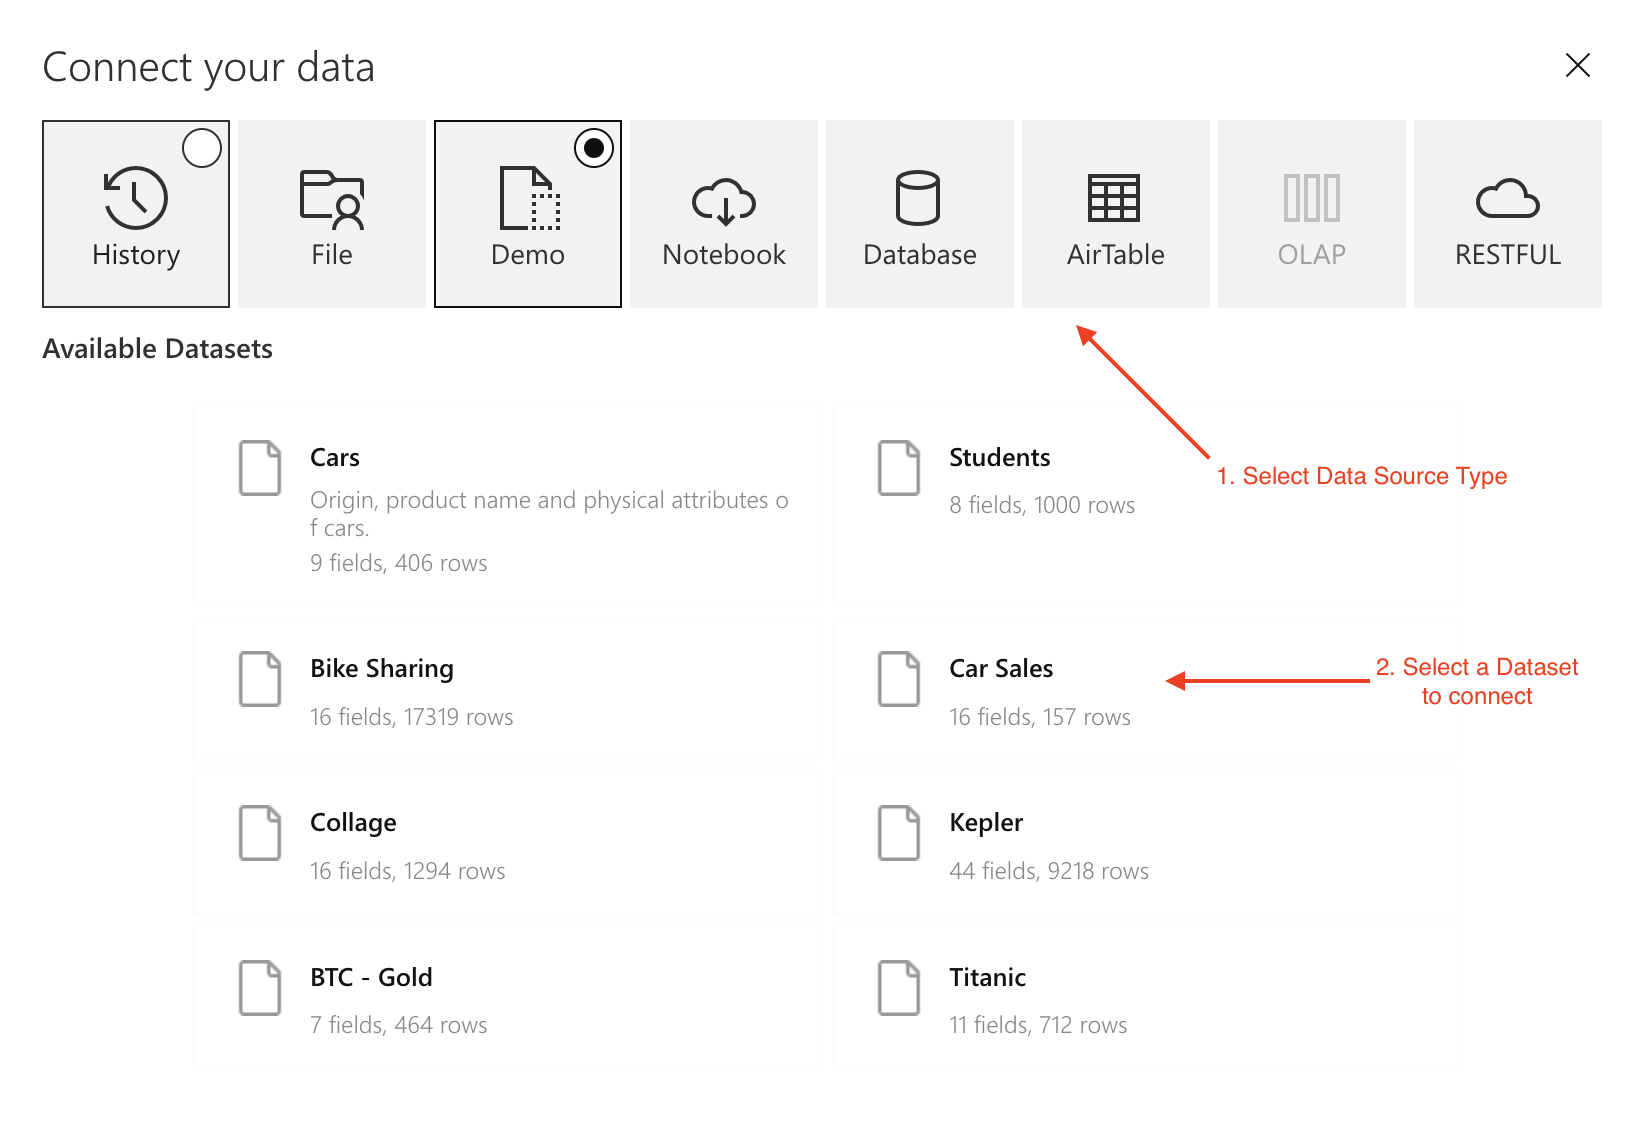
- Select a Data Source Type. For more details about each option, refer to the Connect Your Data chapter.
- Choose the Dataset you want to connect to.
Prepare data
On the Data Source tab, you are about to take a glance over your data source and perform some quick data wrangling, and data exploring.
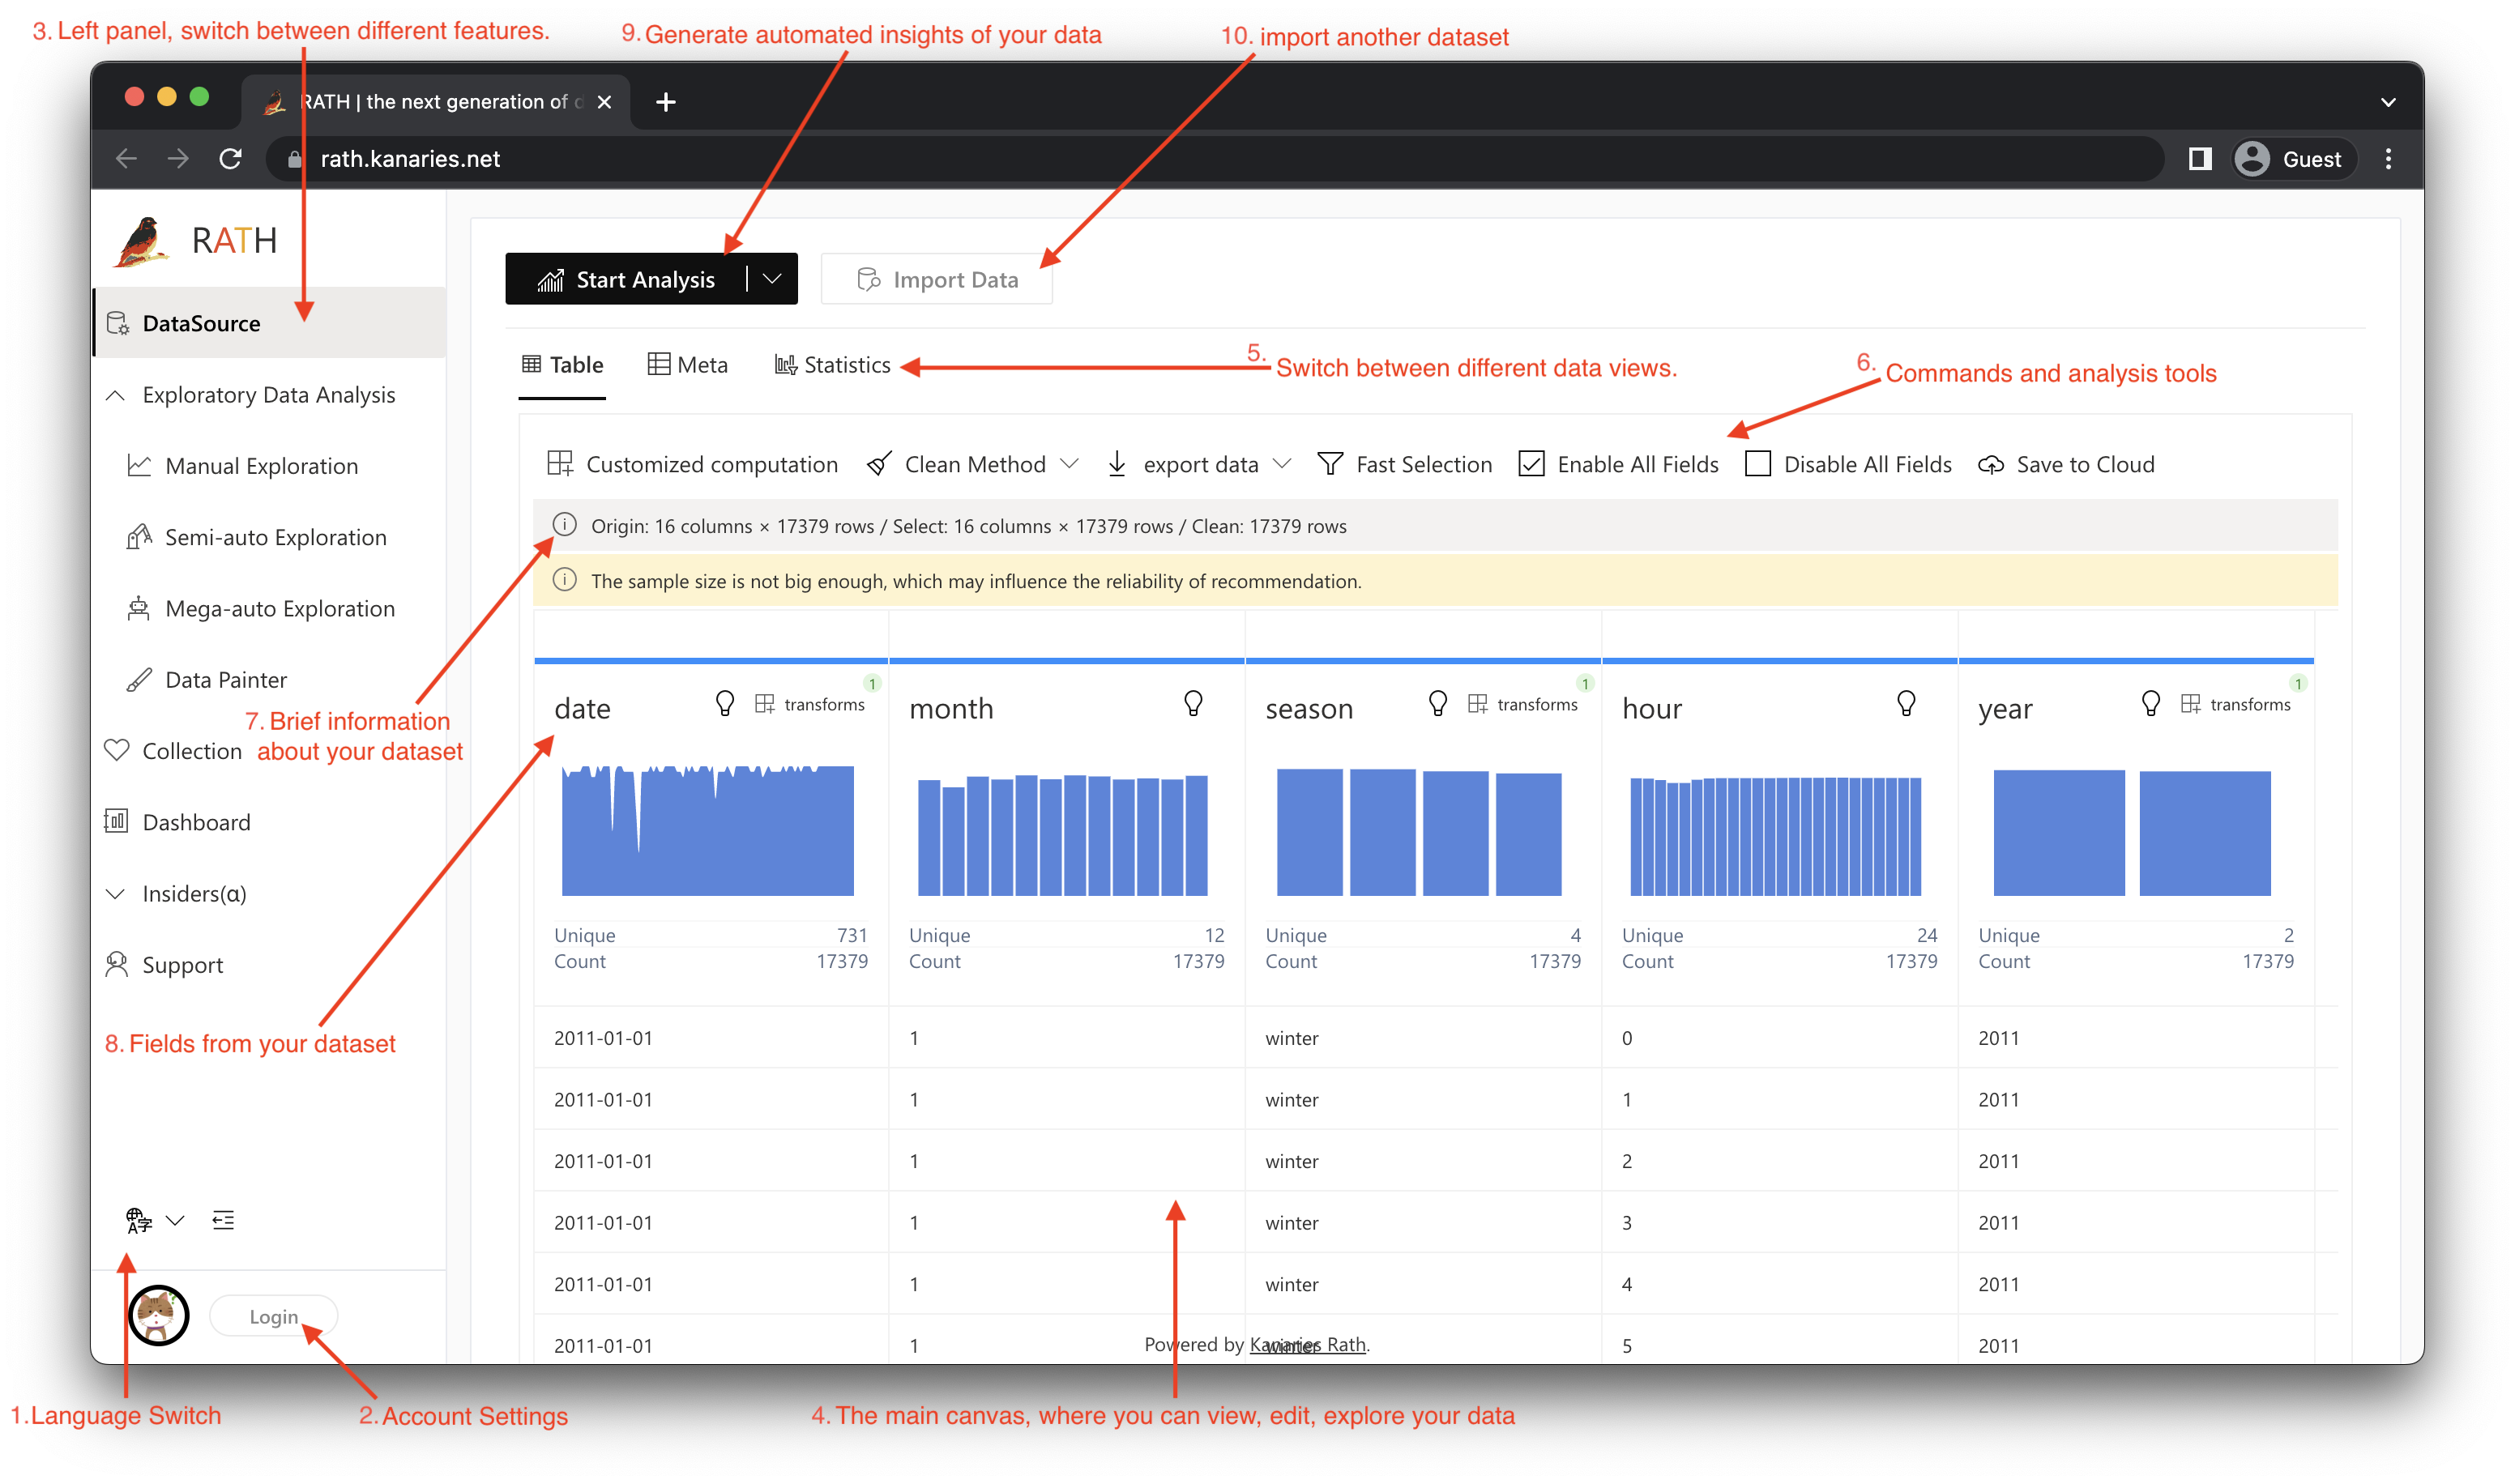
- Language switch
- Access account settings
- Left panel, where you can switch between different RATH features. The default tab is Data Source.
- The main canvas, where you can view, edit and explore your data.
- You can view your dataset in a Table View, Metadata View, or Statistics View. For more about the differences between these views, refer to the Data Profiling chapter.
- Use the commands and analysis tools to process your data. For more details, refer to the Data Wrangling chapter.
- RATH will give you brief information with regard to your dataset.
- Get a brief idea about the dataset, overview, edit, and clean these fields according to your needs.
- Click on the Start Analysis button to automatically generate some insights!
- Click on the Import Data button to import another dataset.
Generate automated insights
After clicking on the Start Analysis button, you are redirected to the Mega-auto Exploration tab, where you can view the Data Charts that RATH automatically generated by analyzing your dataset.
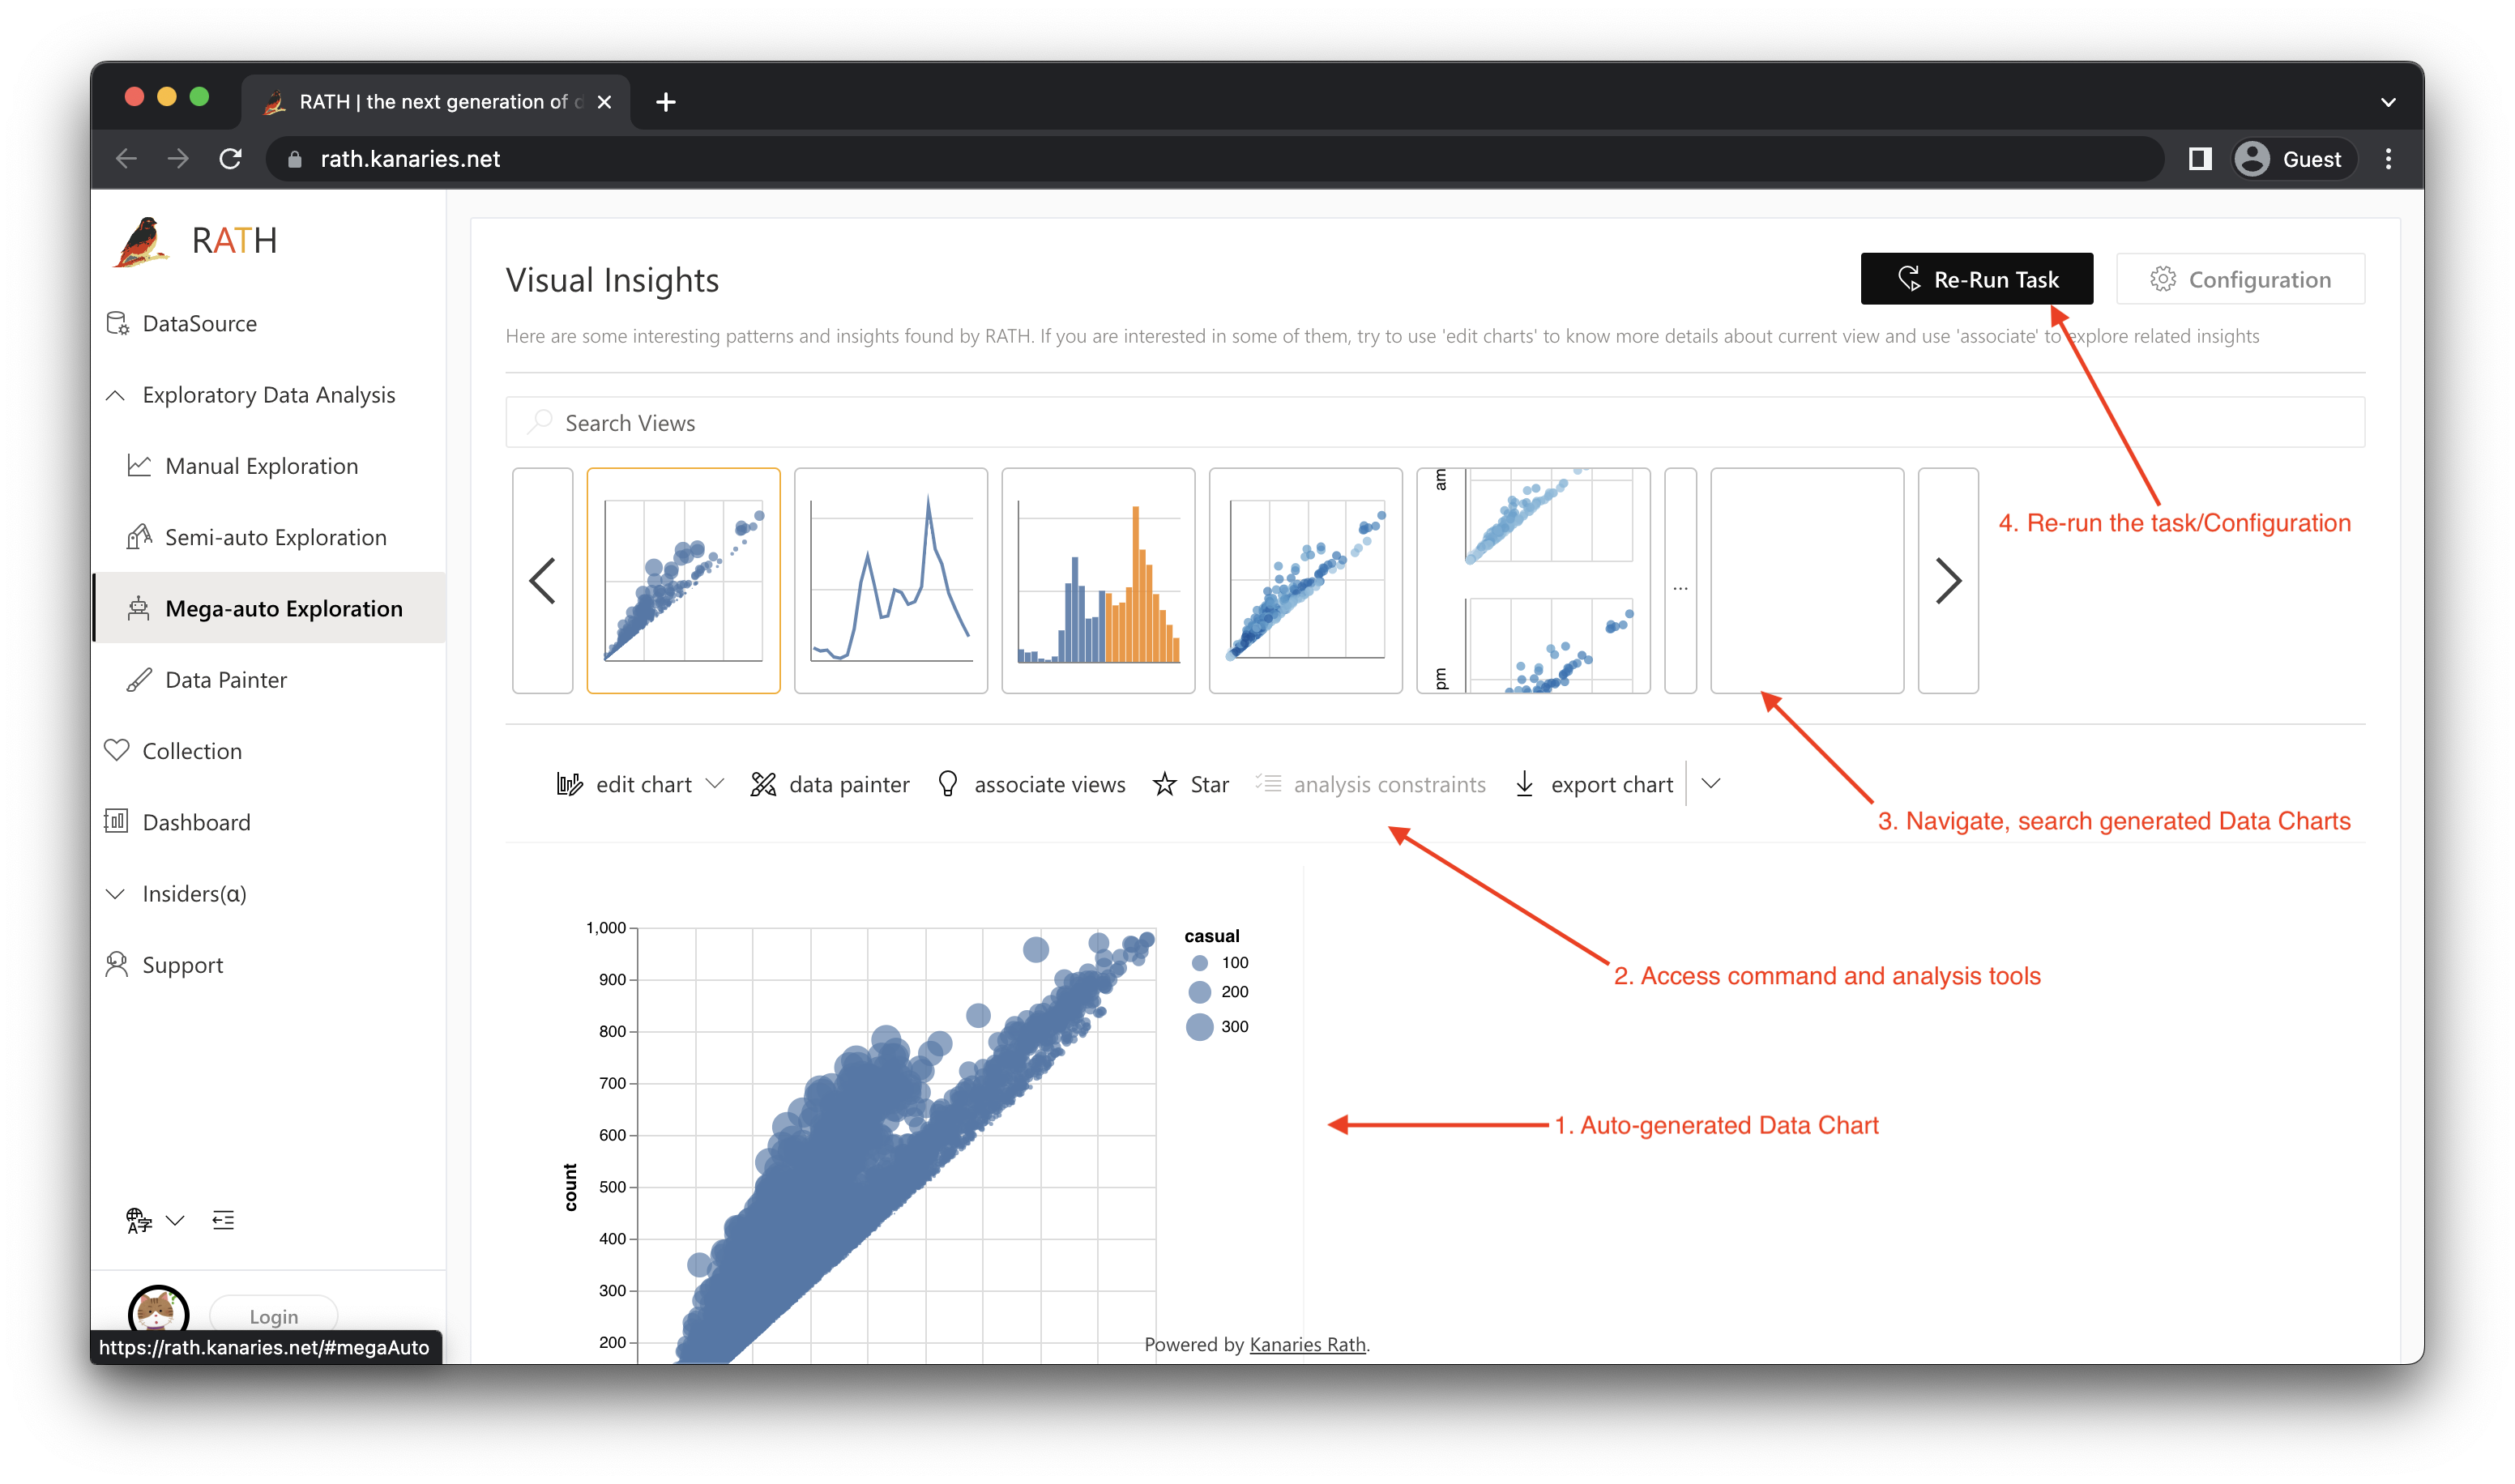
- The automated generated Data Chart.
- Click on the buttons above the chart to access commands and analysis tools.
- A curated list of generated data charts. You can select, explore, and search these charts.
- Configure or re-run the task.
For more details, refer to the Generate Automated Data Insights chapter.
Use RATH as data exploration Copilot
On the Semi-auto Exploration tab, RATH will work as your copilot in data science, learn your intentions and generate relevant recommendations.
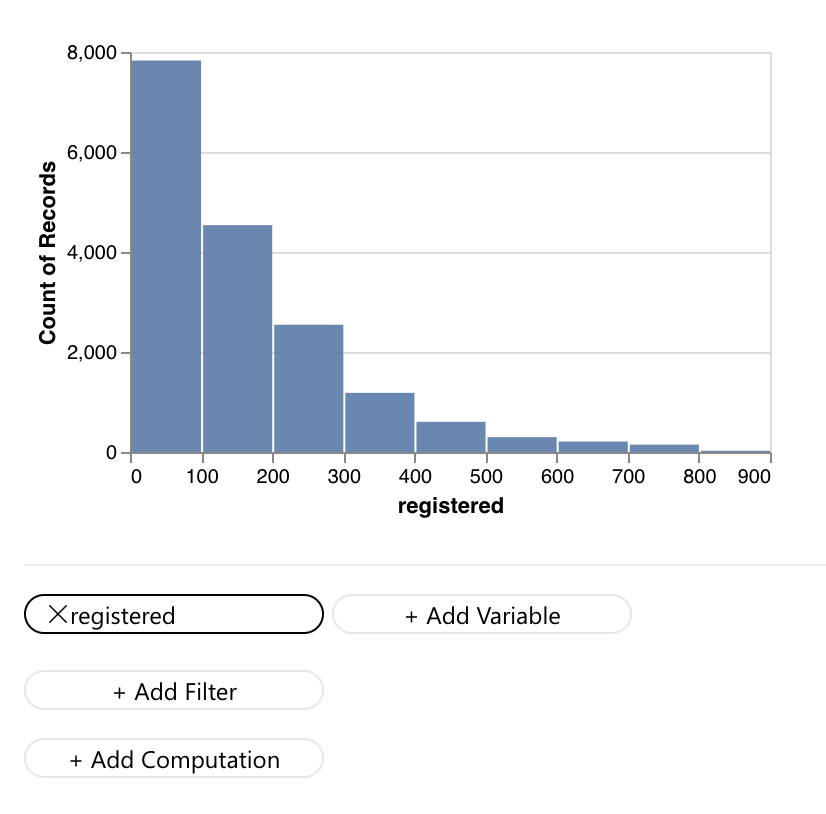
Here's a quick feature walkthrough. We picked the "Bike Sharing" Demo dataset and select a simple chart (registered) as an example:
-
Begin your data exploration journey with any chart.
-
Scroll down on the "Semi-auto Exploration" Tab, you can see the data visualizations that RATH automatically generated. RATH AI can understand your intent and suggest charts that you might want to explore.
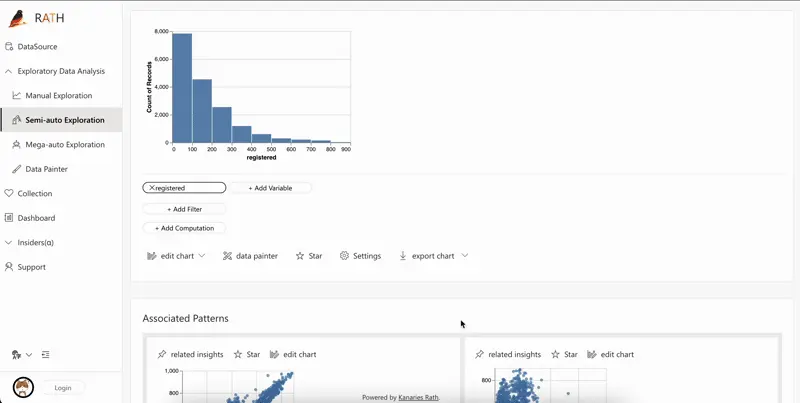
-
Repeat the process to explore further.
For more details about each section of this feature, refer to the Explore Data in Copilot Mode chapter.
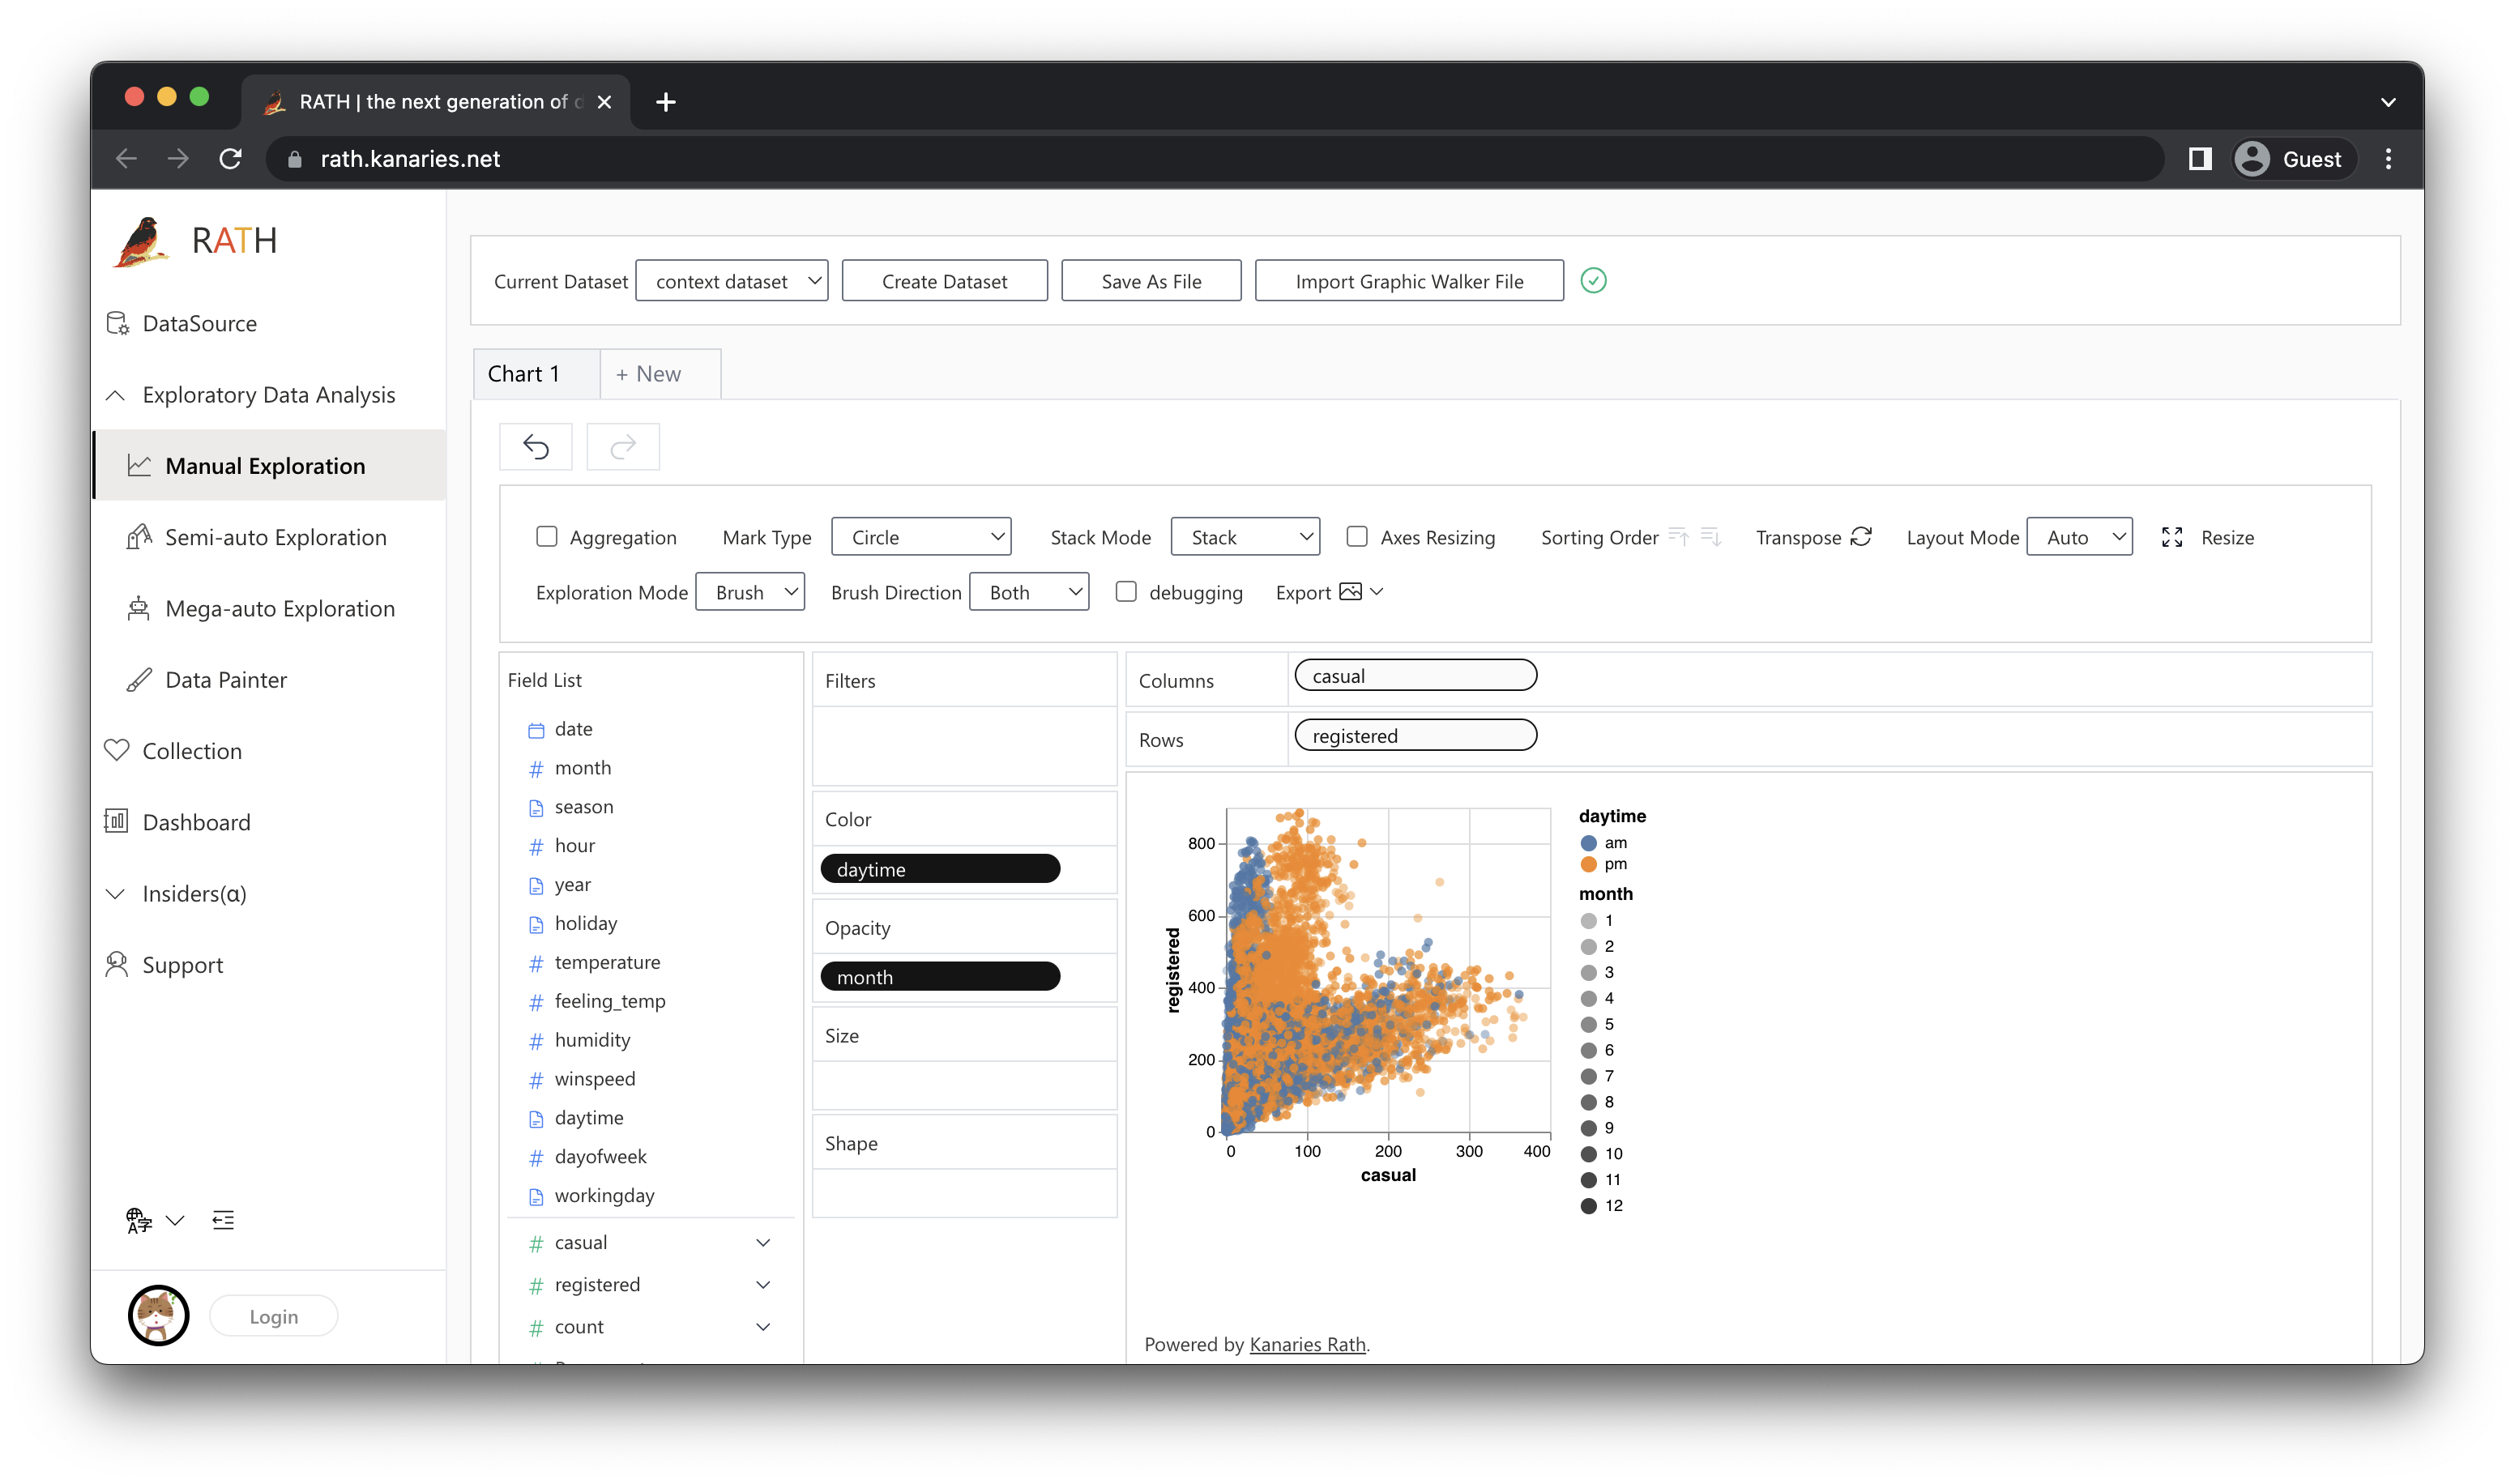
Edit Chart with a tableau-alternative interface
For users who need to fall back to a more traditional BI interface.
To use this feature, simply:
-
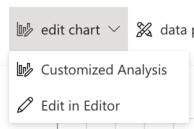
Click on the Edit Chart button on any given chart. This allows you to edit the chart on the Manual Exploration tab.
-
Click on the Manual Exploration tab to build a chart from scratch.
For more details, refer to the Explore Data in Copilot Mode chapter.
You can also use this feature as an independent module (with an independent name, Graphic Walker), and embed it with your own React App. For more details, refer to the Embedded Modules chapter.
More feautres
Explore more advanced RATH features with these documents:
- Explore Data with Data Painter
- Causal Analysis
- What-if Analysis