RATH
RATH is the Next-Generation, Open Source Automated Data Analysis tool for everyone.
RATH (opens in a new tab) enables you to streamline your data analysis workflow and effortlessly discover insights from complex data sources, creating highly-customizable multi-dimensional Data Visualizations. Beyond that, RATH has a powerful Augmented Analytics engine that identifies patterns, insights, and causal inferences to support data-driven decision-making.
Quick Start
Get Insights with One Click
The Data Autopilot tab gives you excellent data insights in the span of one click. Simply import your data to RATH, and click on the Start Analysis button to get automated data insights.
Easily Explore Data
Before getting started with Data Analysis, it is always the best practice to prepare your data. RATH is equipped with a wide amount of features such as:
- Overview your data on the Data Source tab.
- Data Profiling
- Data Transformation
- NLP-powered Text Pattern Extraction
The following demo video demonstrates how to take a glance over your data statistics:
Drag & Drop, Build Charts
For users with a more traditional BI background, RATH has an easy-to-use Visual UI for Data Exploration called Manual Exploration. You can create highly customizable charts by dragging and dropping variables to shelves. Watch the following demo video about Exploring the seasonal relationships between registered users and casual users.
Causal Analysis Made Easy
Causal discovery is a critical part of the data analysis process. RATH has included the Causal Discovery feature that is ready for everyone.
Paint the Data Insights
Discovering the underlying patterns and trends from a complicated data source can be extremely challenging. The Data Painter feature is designed to fix this problem. You can easily clean data, model data, and explore data using a Painting Tool, which turns the complex Exploratory Data Analysis process visual and simple.
The following demo video shows the process of finding out the meaning of the trend within a certain data set:
Explore Data in Copilot Mode
You can use RATH as the Copilot for your exploratory data analysis process. Take the following steps to generate visualizations with your data:
- Import your data to RATH.
- On the Data Copilot tab, select a variable that you would like to explore. In this example, we would like to know more about registered users (
registered). - Scroll down, and you can see that RATH has automatically suggested many related data visualizations in the Associated Patterns and Associated Features sections.
- Once you discover a visualization that interests you, click on the related insights button on top of it. RATH will generate new visualizations about it.
- Repeat the process.
Enterprise-ready
Powered by AI, RATH is your fastest way to move from Raw Data to well-informed Decision Making:
- Powerful Augmented Analytics Engine: RATH can automatically learn your behaviors and suggest visualized insights in no time, assisting you to make informed business decisions effortlessly.
- Robust Architecture Design: Dynamic system structure with great industry-leading scalability and reliability.
- RESTful API support.
- For enterprise users, please Contact us for more details.
Supported Databases
RATH supports a wide range of data sources. Here are some of the major database solutions that you can connect to RATH:
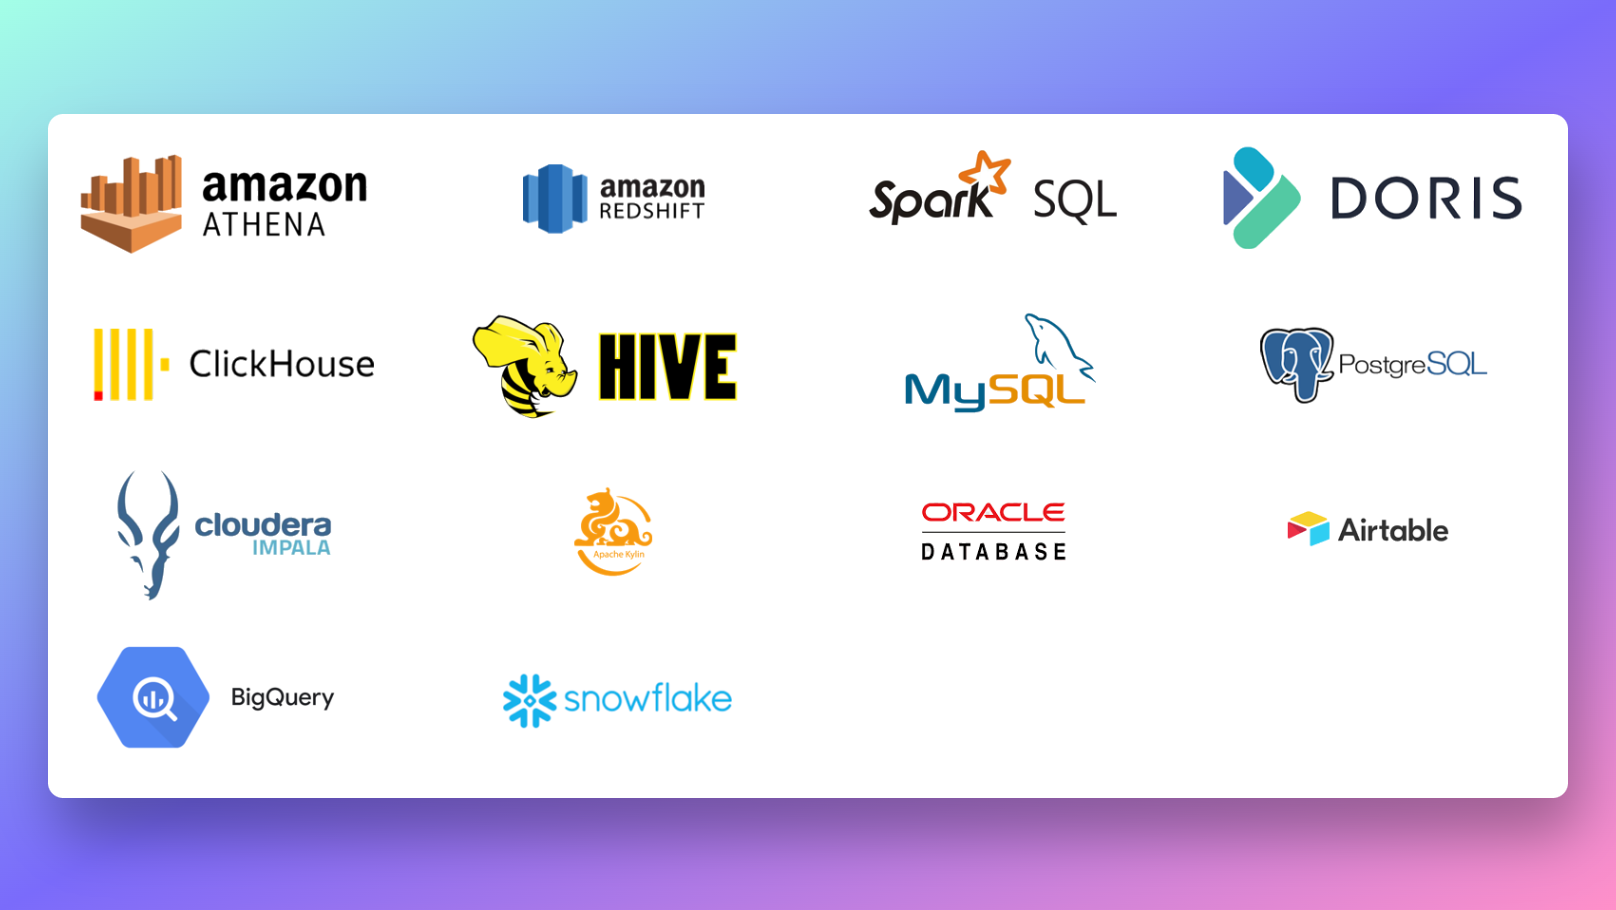
If you want to add support for more database types or data engines, feel free to contact us.
Open Source Community
(opens in a new tab)
(opens in a new tab)
(opens in a new tab)

RATH is created by a group of passionate and dedicated Data Scientists and Programmers. We are trying to build a global community that shares the same vision for the future of Data Analysis and Data Visualization.
Feel free to join the discussions on our Discord (opens in a new tab). Don't forget to leave us a ⭐️ on GitHub (opens in a new tab)!