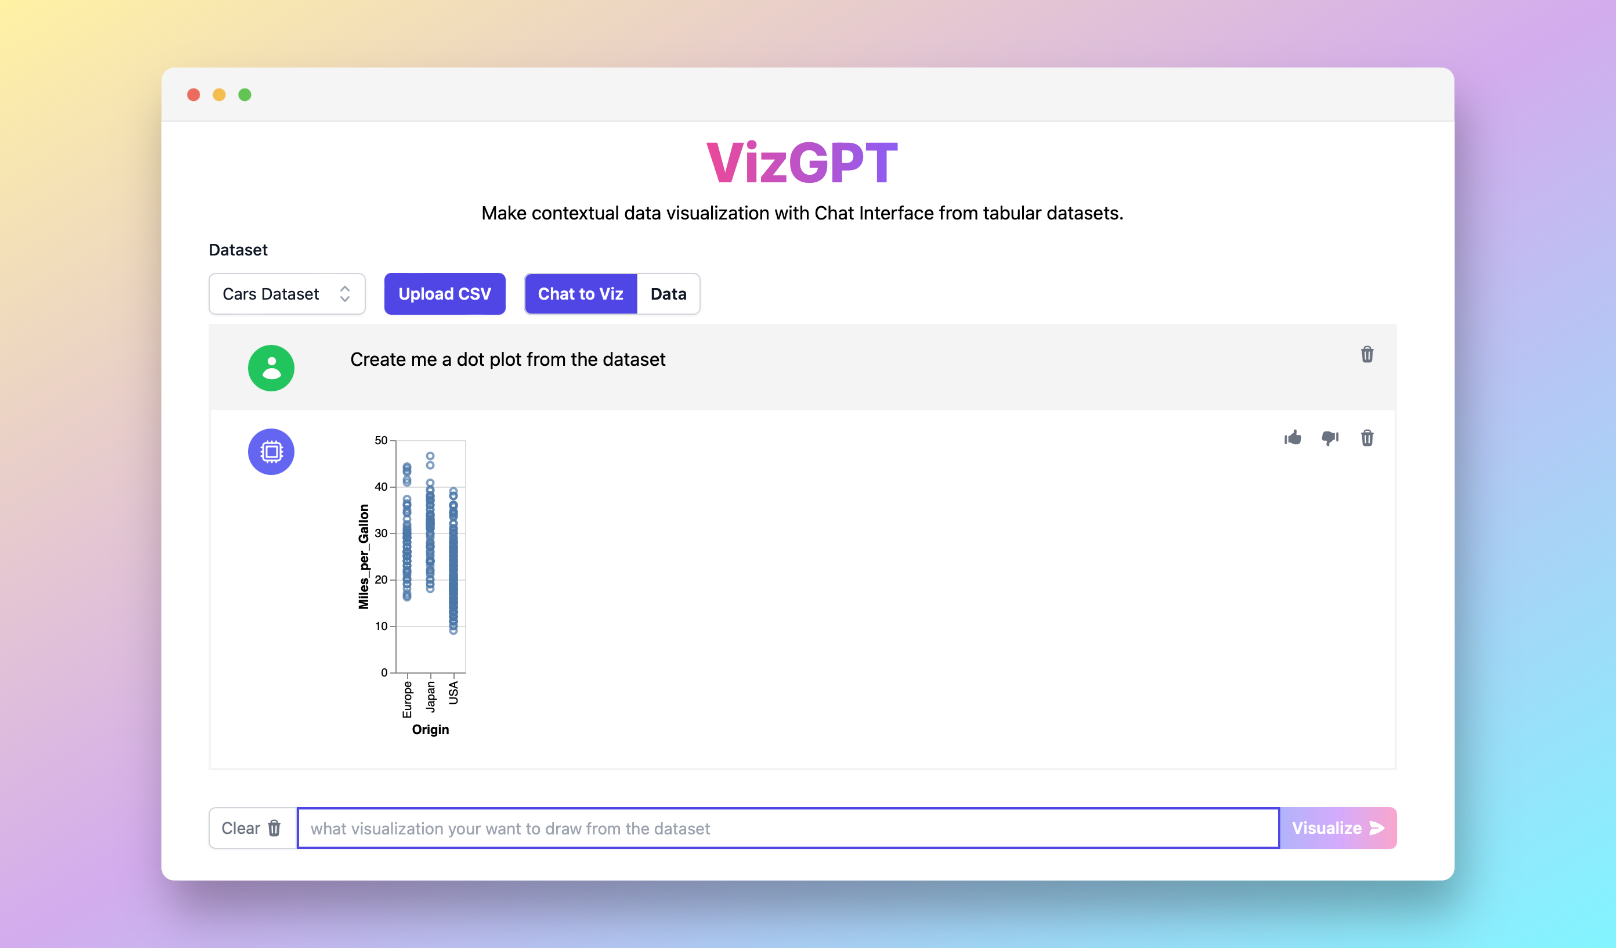
Best Online Dot Plot Maker with VizGPT
Ready to start creating your own dot plots with VizGPT? Try this Prompt:
Create a dot plot from the data set
Want to Upload a Customized CSV File? Upgrade to Kanaries Plus Plan, you can get the full package of apps (opens in a new tab) for handling much more complicated data analysis!
Introduction to Dot Plot Maker
Data visualization is an indispensable part of data analysis in today's data-driven world. Among many mathematical tools, one efficient and easy-to-use tool for visualizing statistical data is a dot plot maker. From the simple dot plot maker for students to the more complex dot plot maker Excel, the vast array of available tools can cater to a variety of user needs and capabilities.
Understanding the Dot Plot Maker
What is a Dot Plot?
A dot plot, otherwise known as a dot chart, is a statistical chart consisting of data points plotted on a simple scale. It's similar to bar charts, line charts, scatter plots, and histograms, but uses dots instead of bars or lines to represent data.
How to Use Dot Plot Maker?
Creating a dot plot graph using a dot plot maker is an intuitive process. Firstly, gather your data set. Then, define your variables on the x and y axes. Next, plot your data points or dots based on the frequency of each variable. Many online dot plot maker tools, like the free dot plot maker or the easy dot plot maker, will guide you through this process.
Customizing your Dot Plot Maker
A customizable dot plot maker allows for personalized touches to your graph. Users can adjust color schemes, dot sizes, axis labels, and more, depending on the data visualization requirements. Such features are usually available in both the dot plot maker Excel and dot plot maker Google Sheets.
Interpreting Data in Dot Plot Maker
Interpreting a dot plot graph involves understanding the distribution and frequency of data points. The higher the concentration of dots, the higher the frequency of that data variable. This allows for easy analysis of data trends, outliers, and more.
Versatility of the Dot Plot Maker
A dot plot maker is adaptable and versatile, designed to cater to a broad range of users, from students to teachers and professionals. For example, there's a dot plot maker for teachers that offers a blank dot plot template, making it easier to teach statistical concepts to
students. On the other hand, a dot plot maker for students simplifies the process of creating and interpreting dot plots.
Advantages of Using a Dot Plot Maker
A dot plot maker comes with several benefits. It's an accessible way to visualize data for users at any skill level. Whether it's a free dot plot maker or a more complex dot plot maker Excel, these tools bring ease and efficiency to data analysis.
Choosing Your Ideal Dot Plot Maker
The market offers a variety of dot plot makers, from a basic free dot plot maker to more specialized versions like the dot plot maker Excel, dot plot maker Google Sheets, or dot plot maker Desmos. Some tools even offer a dot plot maker without registration or sign up, ensuring immediate accessibility for users.
If you need assistance while using a dot plot maker, there are helpful dot plot maker videos online. These videos offer visual guidance and step-by-step tutorials, perfect for beginners or those looking to enhance their chart-making skills.
Frequently Asked Questions
-
What is a dot plot? A dot plot is a type of statistical chart that uses dots to represent data on a simple scale. It is an effective tool for data visualization and analysis.
-
What are the benefits of using a dot plot maker? A dot plot maker simplifies the process of creating dot plots. It offers customization features, easy data import options, and guides for interpretation, making it a powerful tool for data visualization.
-
Are there any free dot plot maker tools available online? Yes, there are multiple free dot plot maker tools online. These tools are user-friendly and can be a great starting point for students and those new to data visualization.

