Seaborn vs. Matplotlib: A Comparative Analysis
Introduction
In the realm of data visualization in Python, two libraries often come to the forefront: Seaborn and Matplotlib. Both are powerful tools for creating a variety of plots and charts, but they each have their own strengths and weaknesses. This blog post delves into a comparative analysis of Seaborn and Matplotlib, focusing on three critical aspects: ease of use, customization, and aesthetics.
Ease of Use

When it comes to ease of use, Seaborn often has the upper hand. Seaborn is built on top of Matplotlib and provides a high-level interface for drawing attractive and informative statistical graphics. This means that with just a few lines of code, users can create complex plots without worrying about the underlying intricacies. For example, creating a scatter plot with linear regression in Seaborn can be done in a single line, whereas Matplotlib requires more extensive coding. Thus, for beginners or those looking for quick visualizations, Seaborn offers a more straightforward and efficient experience.

Interestingly, AI tools like ChatGPT’s code interpreter often start with Seaborn for simple visualizations due to its simplicity. However, as the requirements grow more complex, they tend to switch to Matplotlib to leverage its extensive customization capabilities.
Customization
Matplotlib is the go-to library for those who need extensive customization. While Seaborn simplifies many tasks, it can sometimes be restrictive when it comes to fine-tuning specific details of a plot. Matplotlib, on the other hand, provides granular control over every aspect of a figure. From adjusting the position of ticks to customizing the finest details of legends and annotations, Matplotlib's flexibility is unparalleled. For users who need to create highly customized and publication-quality visuals, Matplotlib is often the preferred choice.
Aesthetics
Aesthetics play a crucial role in data visualization, and here Seaborn shines brightly. Seaborn comes with a variety of built-in themes and color palettes that make it easy to produce visually appealing plots. These aesthetics are designed to be harmonious and can be easily applied to different types of plots. Matplotlib, while highly customizable, requires more effort to achieve the same level of visual appeal. Users often need to manually adjust colors, styles, and themes to match the elegance that Seaborn offers out of the box. For those who prioritize the visual impact of their data, Seaborn provides an easier path to beautiful graphics.
Popularity and Community Support
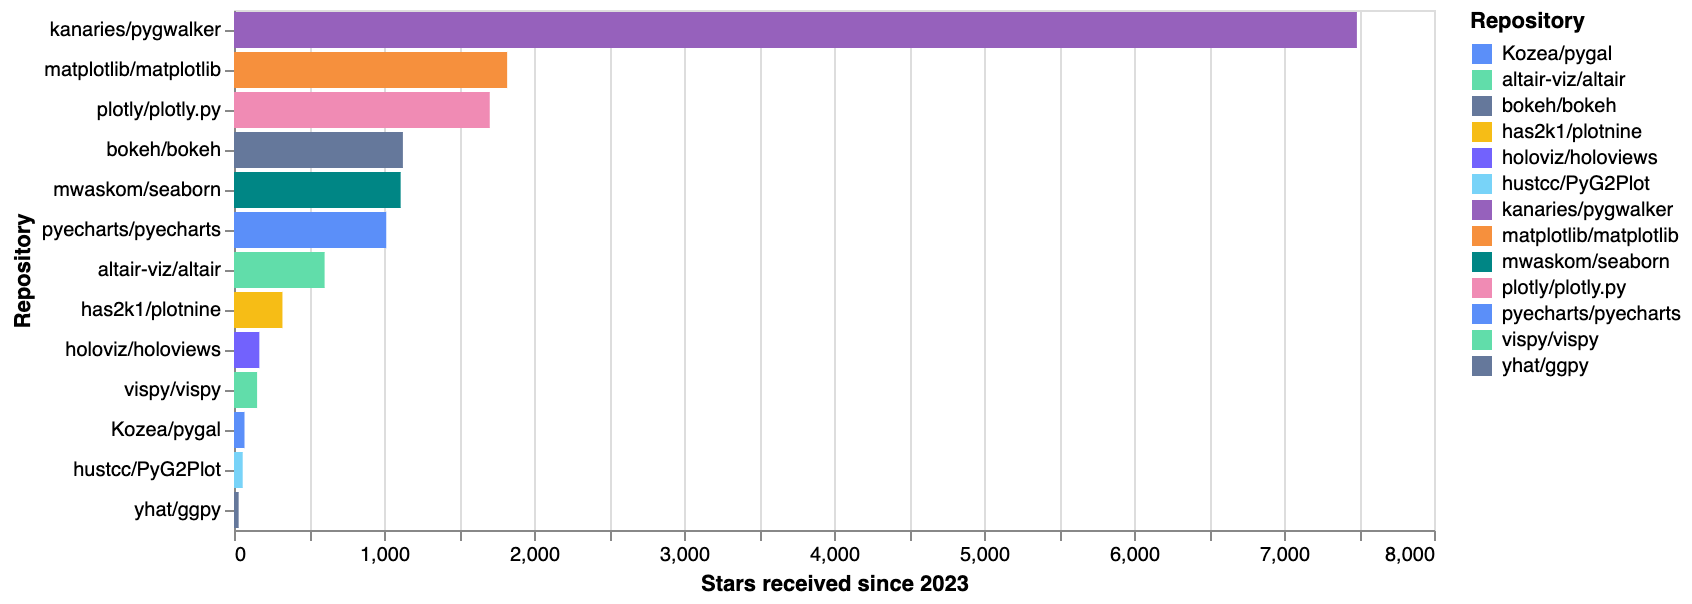
According to Open Data Analytic's Rank Review Top 10 growing data visualization libraries in Python in 2023 (opens in a new tab)

Despite Seaborn’s ease of use and aesthetic appeal, Matplotlib remains more popular. According to recent data, Matplotlib received 1821+ stars on GitHub in 2023, while Seaborn garnered 1111+ stars. This indicates that while Seaborn is gaining traction, Matplotlib’s extensive community and long-standing reputation still make it a preferred choice for many.
Emerging Trends
While Seaborn and Matplotlib continue to be mainstays in the data visualization landscape, new tools are also gaining popularity. Notably, PyGWalker received over 9000+ stars in 2023, reflecting a growing interest in user-friendly, interactive data tools. For newcomers to data visualization in Python, exploring PyGWalker might be a valuable addition to their toolkit.
Conclusion
In summary, both Seaborn and Matplotlib have their own unique advantages and are suited to different needs. Seaborn excels in ease of use and aesthetics, making it ideal for quick, beautiful visualizations. Matplotlib, with its extensive customization options, remains the tool of choice for those needing detailed control over their plots. By understanding the strengths of each library, users can make informed decisions about which tool to use for their specific data visualization needs. Additionally, exploring emerging libraries like PyGWalker can provide new avenues for creating interactive and engaging visualizations.
References
Top 10 growing data visualization libraries in Python in 2023 (opens in a new tab)