How to Switch from Tableau to PyGWalker for Dark Theme Support

Introduction
Tableau has long been a staple in the data visualization arena, lauded for its robust features and intuitive interface. However, despite its popularity, one feature remains conspicuously absent: a dark mode. This omission has been highlighted in the recent community update from April 2024, where the demand for a dark-themed interface in Tableau continues unmet. For those in the data visualization community seeking alternatives that offer this eye-friendly feature, PyGWalker emerges as a promising candidate. This open-source tool not only supports a dark theme but also offers extensive customization options to suit any aesthetic preference.
Overview of Tableau and Its Theme Limitations
Tableau's platform offers powerful tools for data analysis and sharing insights, making it a favorite among professionals. However, as vibrant as its visualizations are, the lack of a dark mode can be a strain on the eyes, especially during long work hours in low-light environments. This has been a recurring point of discussion among users, as evidenced by recent feedback on the Tableau Community forum.
Introduction to PyGWalker

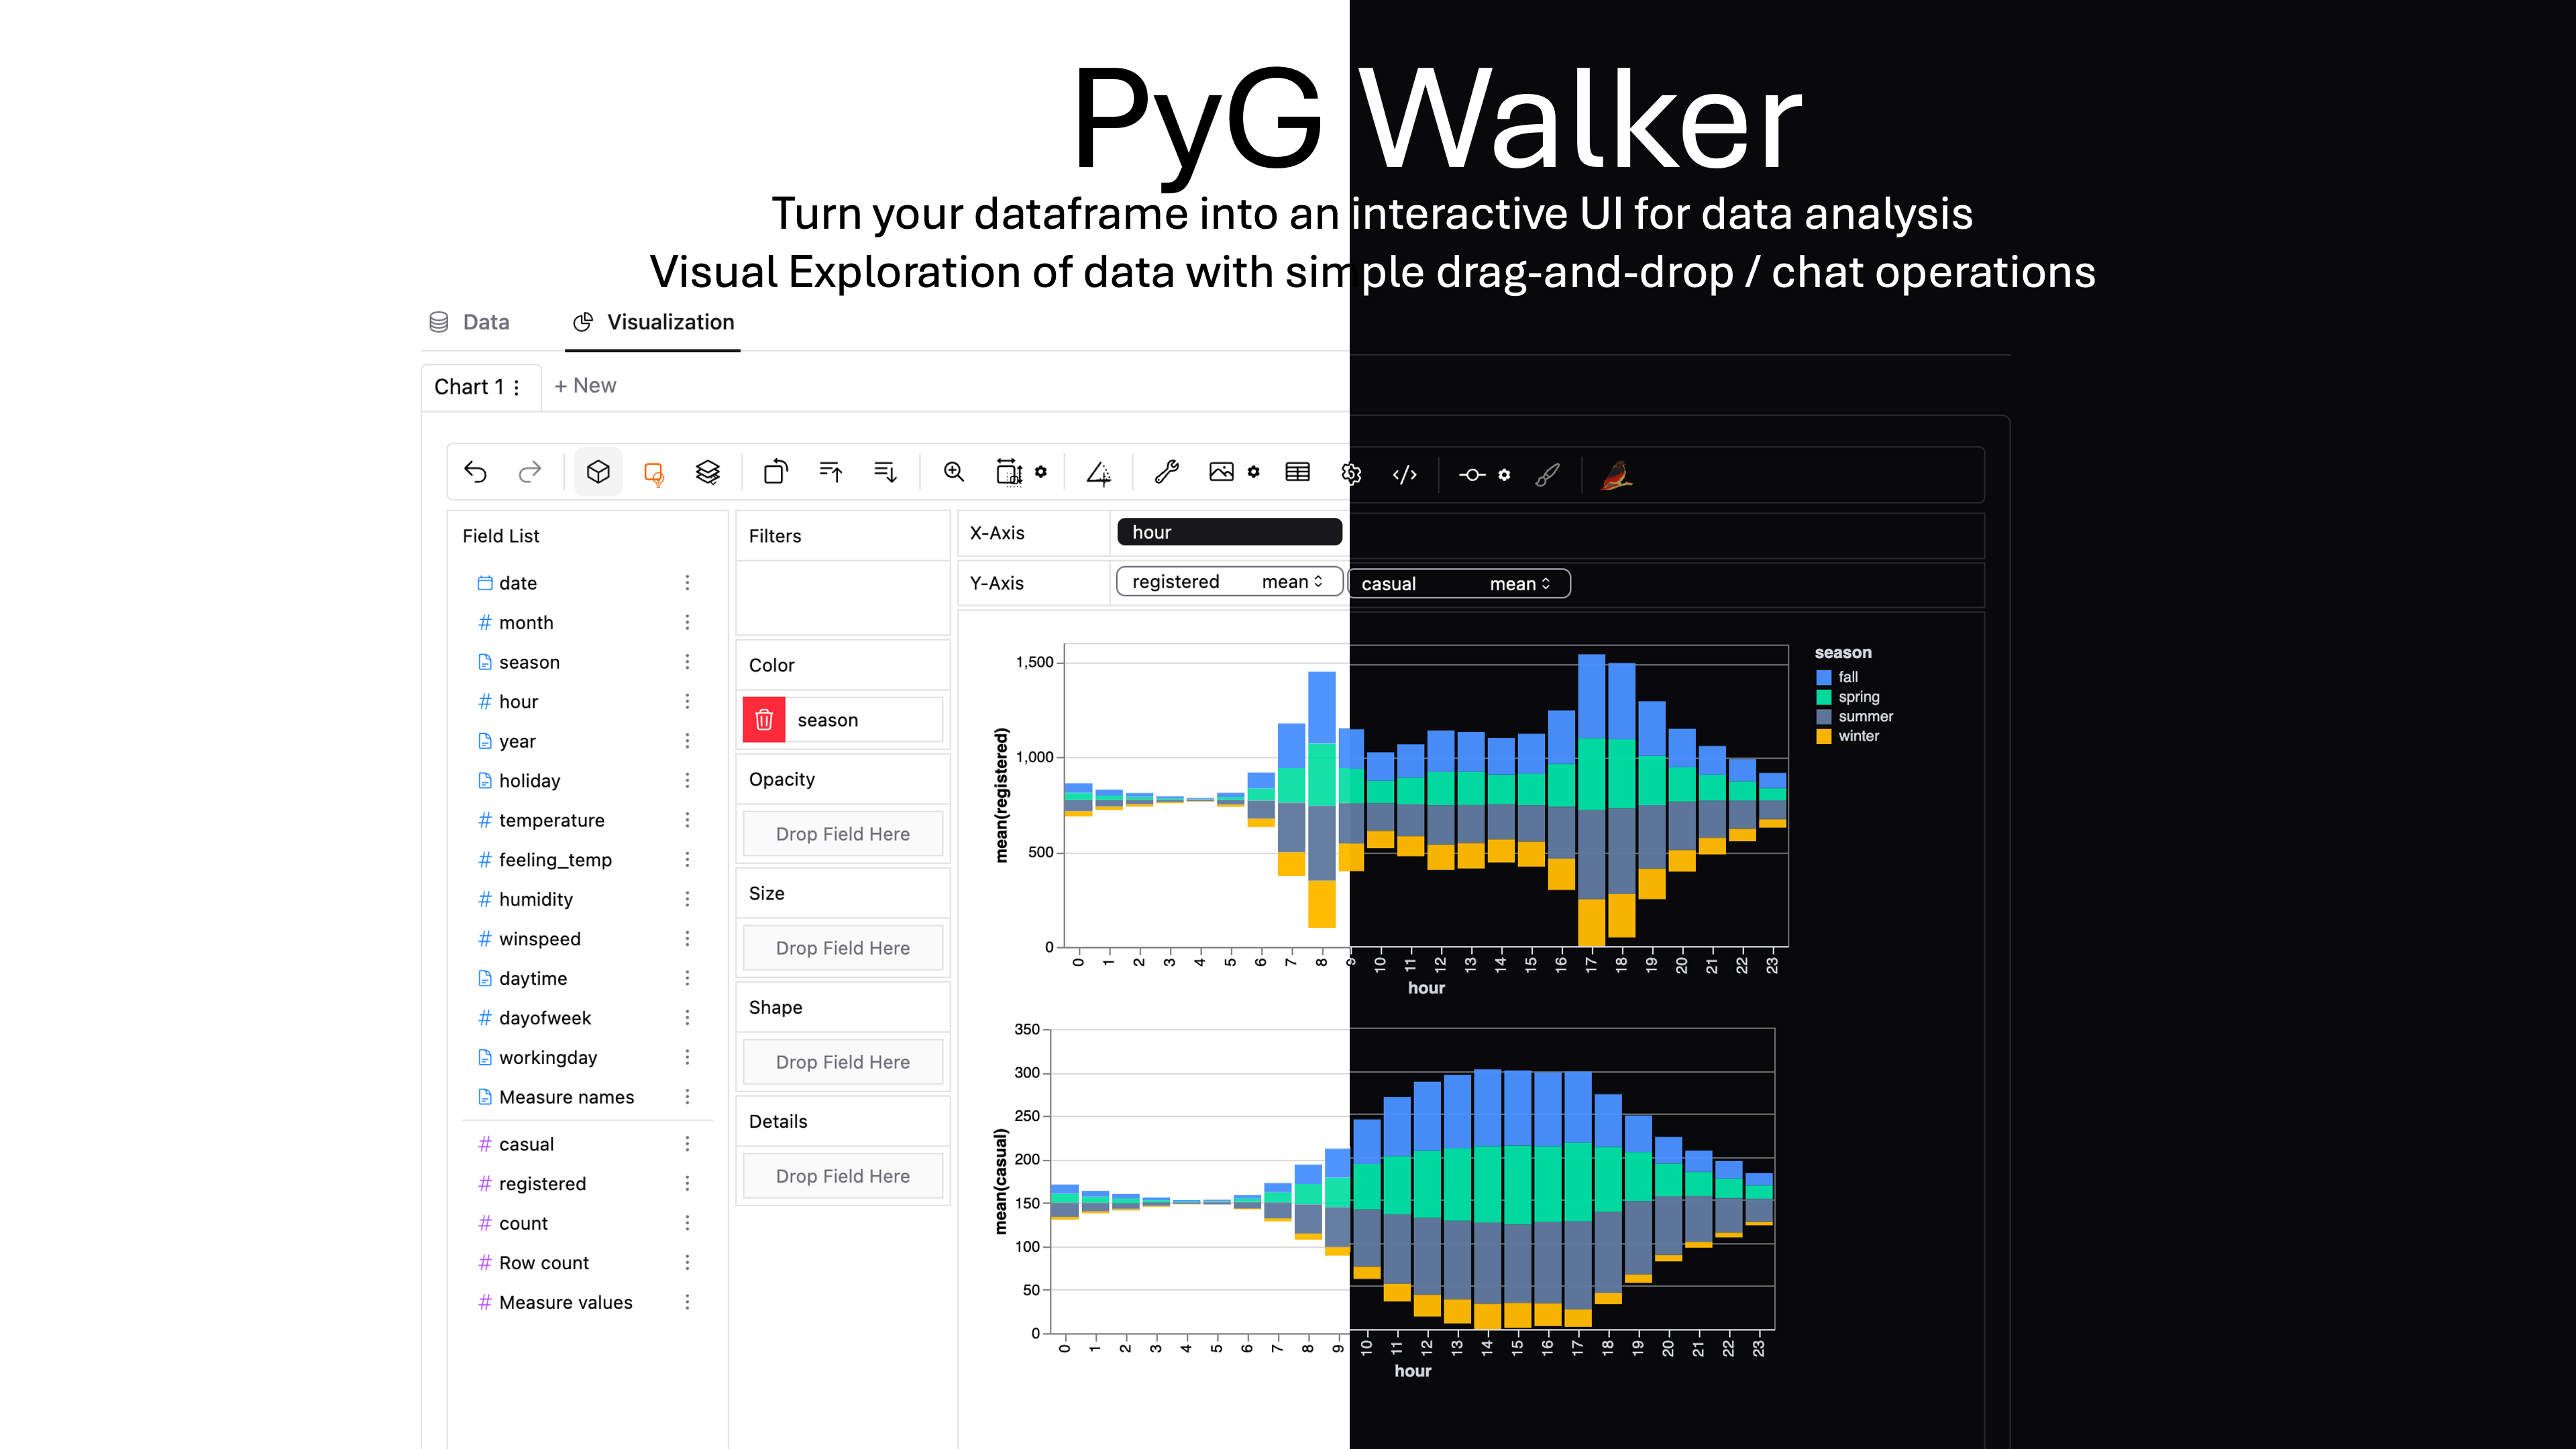
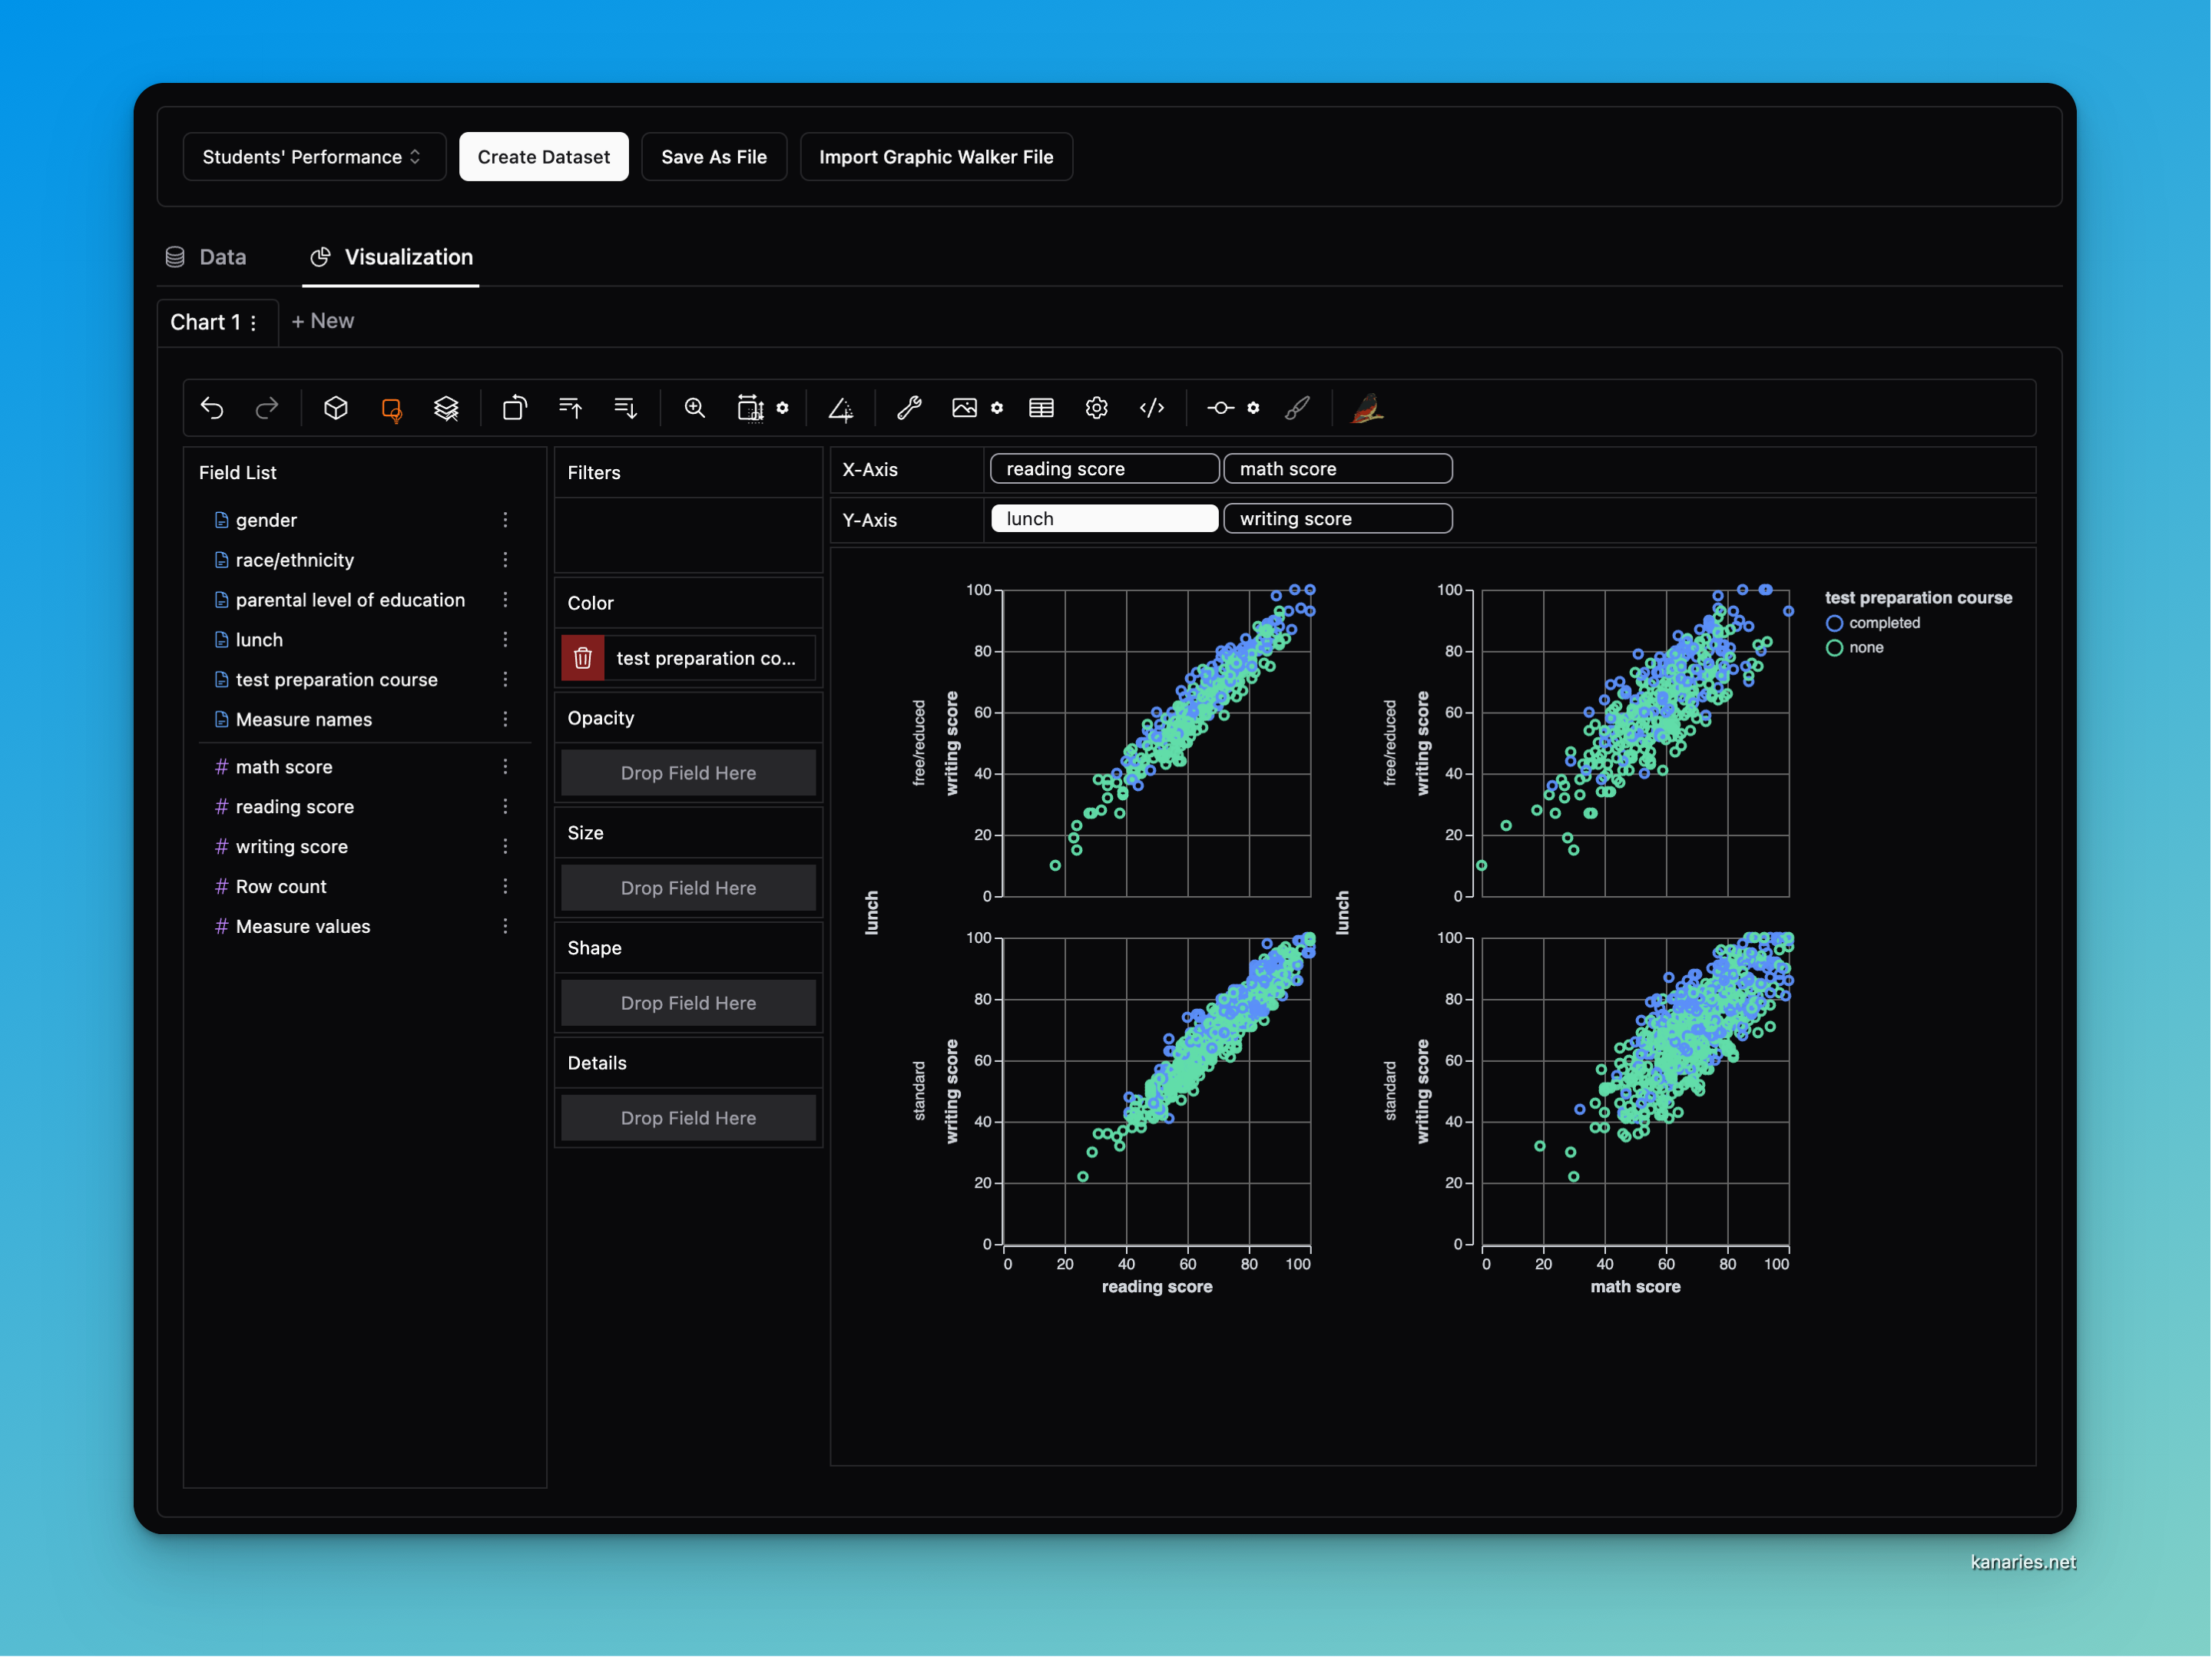
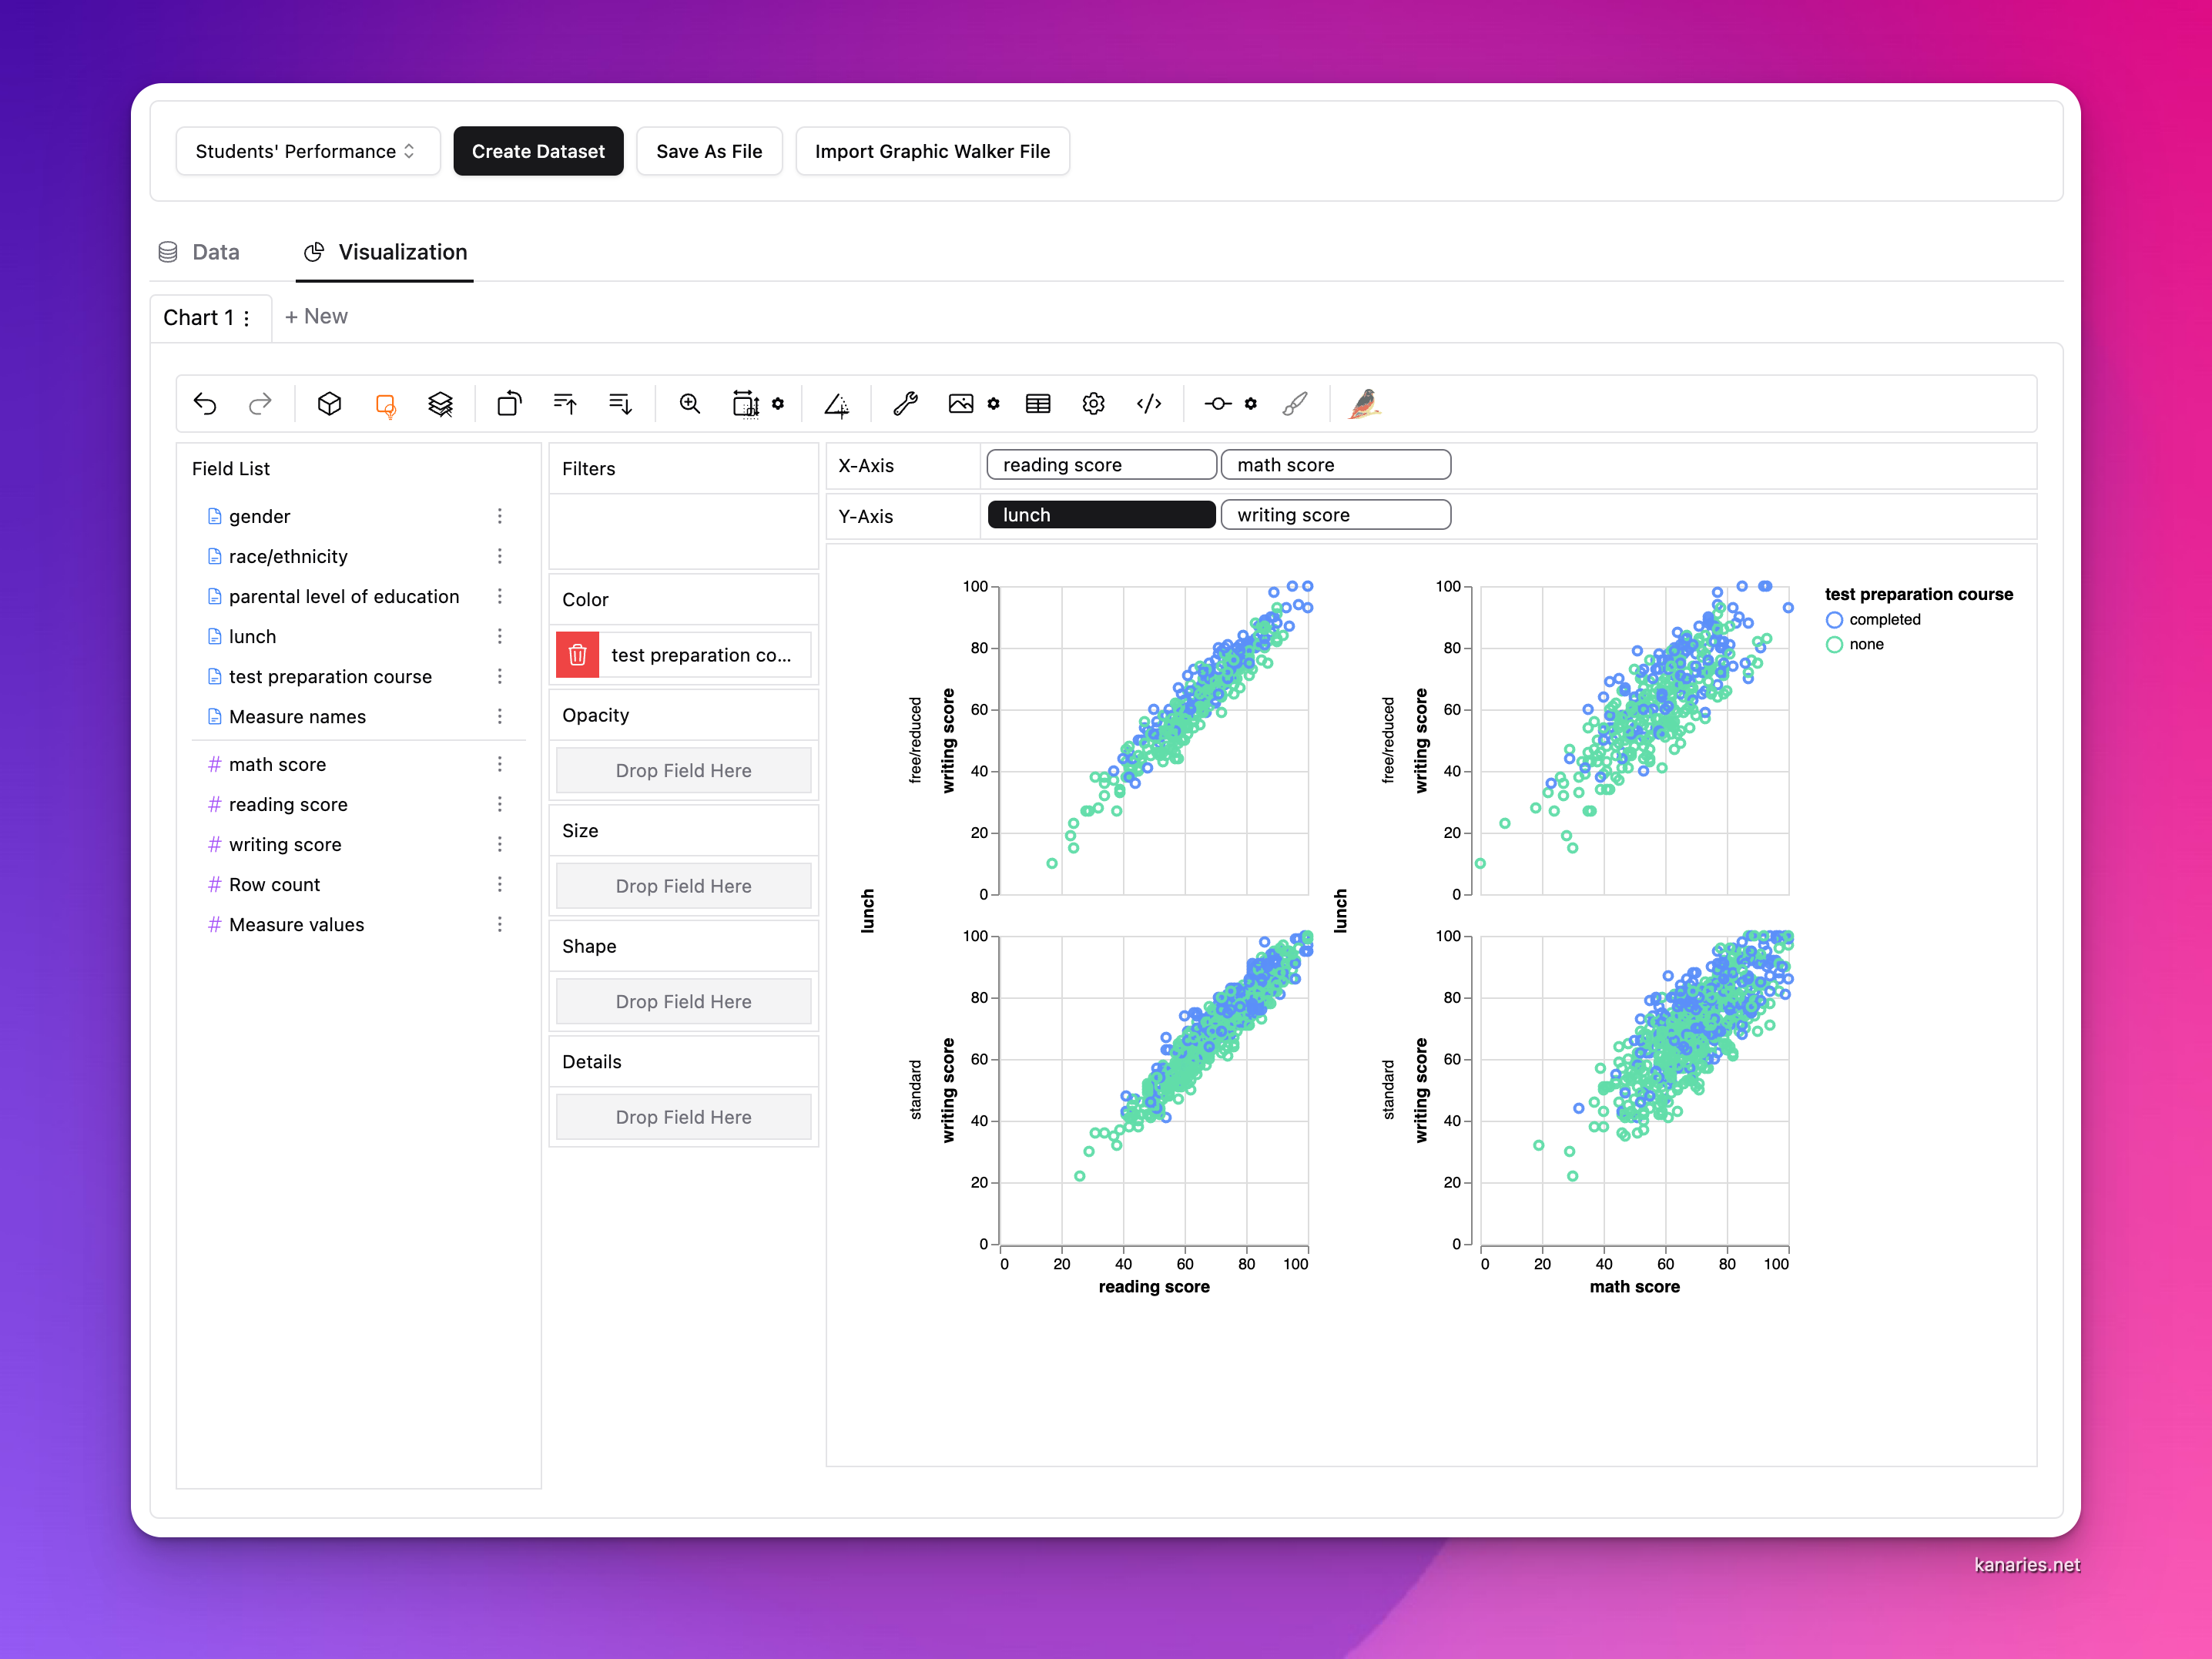
Enter PyGWalker, a versatile open-source alternative to Tableau that not only matches many of Tableau's capabilities but also surpasses it in terms of interface customization. PyGWalker allows users to switch to a dark theme, providing a visually comfortable environment for data analysis. This feature is particularly beneficial for those who prefer darker hues for aesthetic reasons or to reduce eye strain.
Step-by-Step Guide How to use PyGWalker Dark Theme
1. Installing PyGWalker
Install pygwalker with pip:
pip install pygwalker2. Launching PyGWalker
You can specify the theme in both python code and GUI of pygwalker. To launch PyGWalker with a dark theme, use the following code:
import pygwalker as pyg
import pandas as pd

dataframe = pd.read_csv('your_data.csv')

pyg.walk(appearence='dark')
Or you can directly lauch PyGWalker, it's appearence by default is the same as your system's theme.
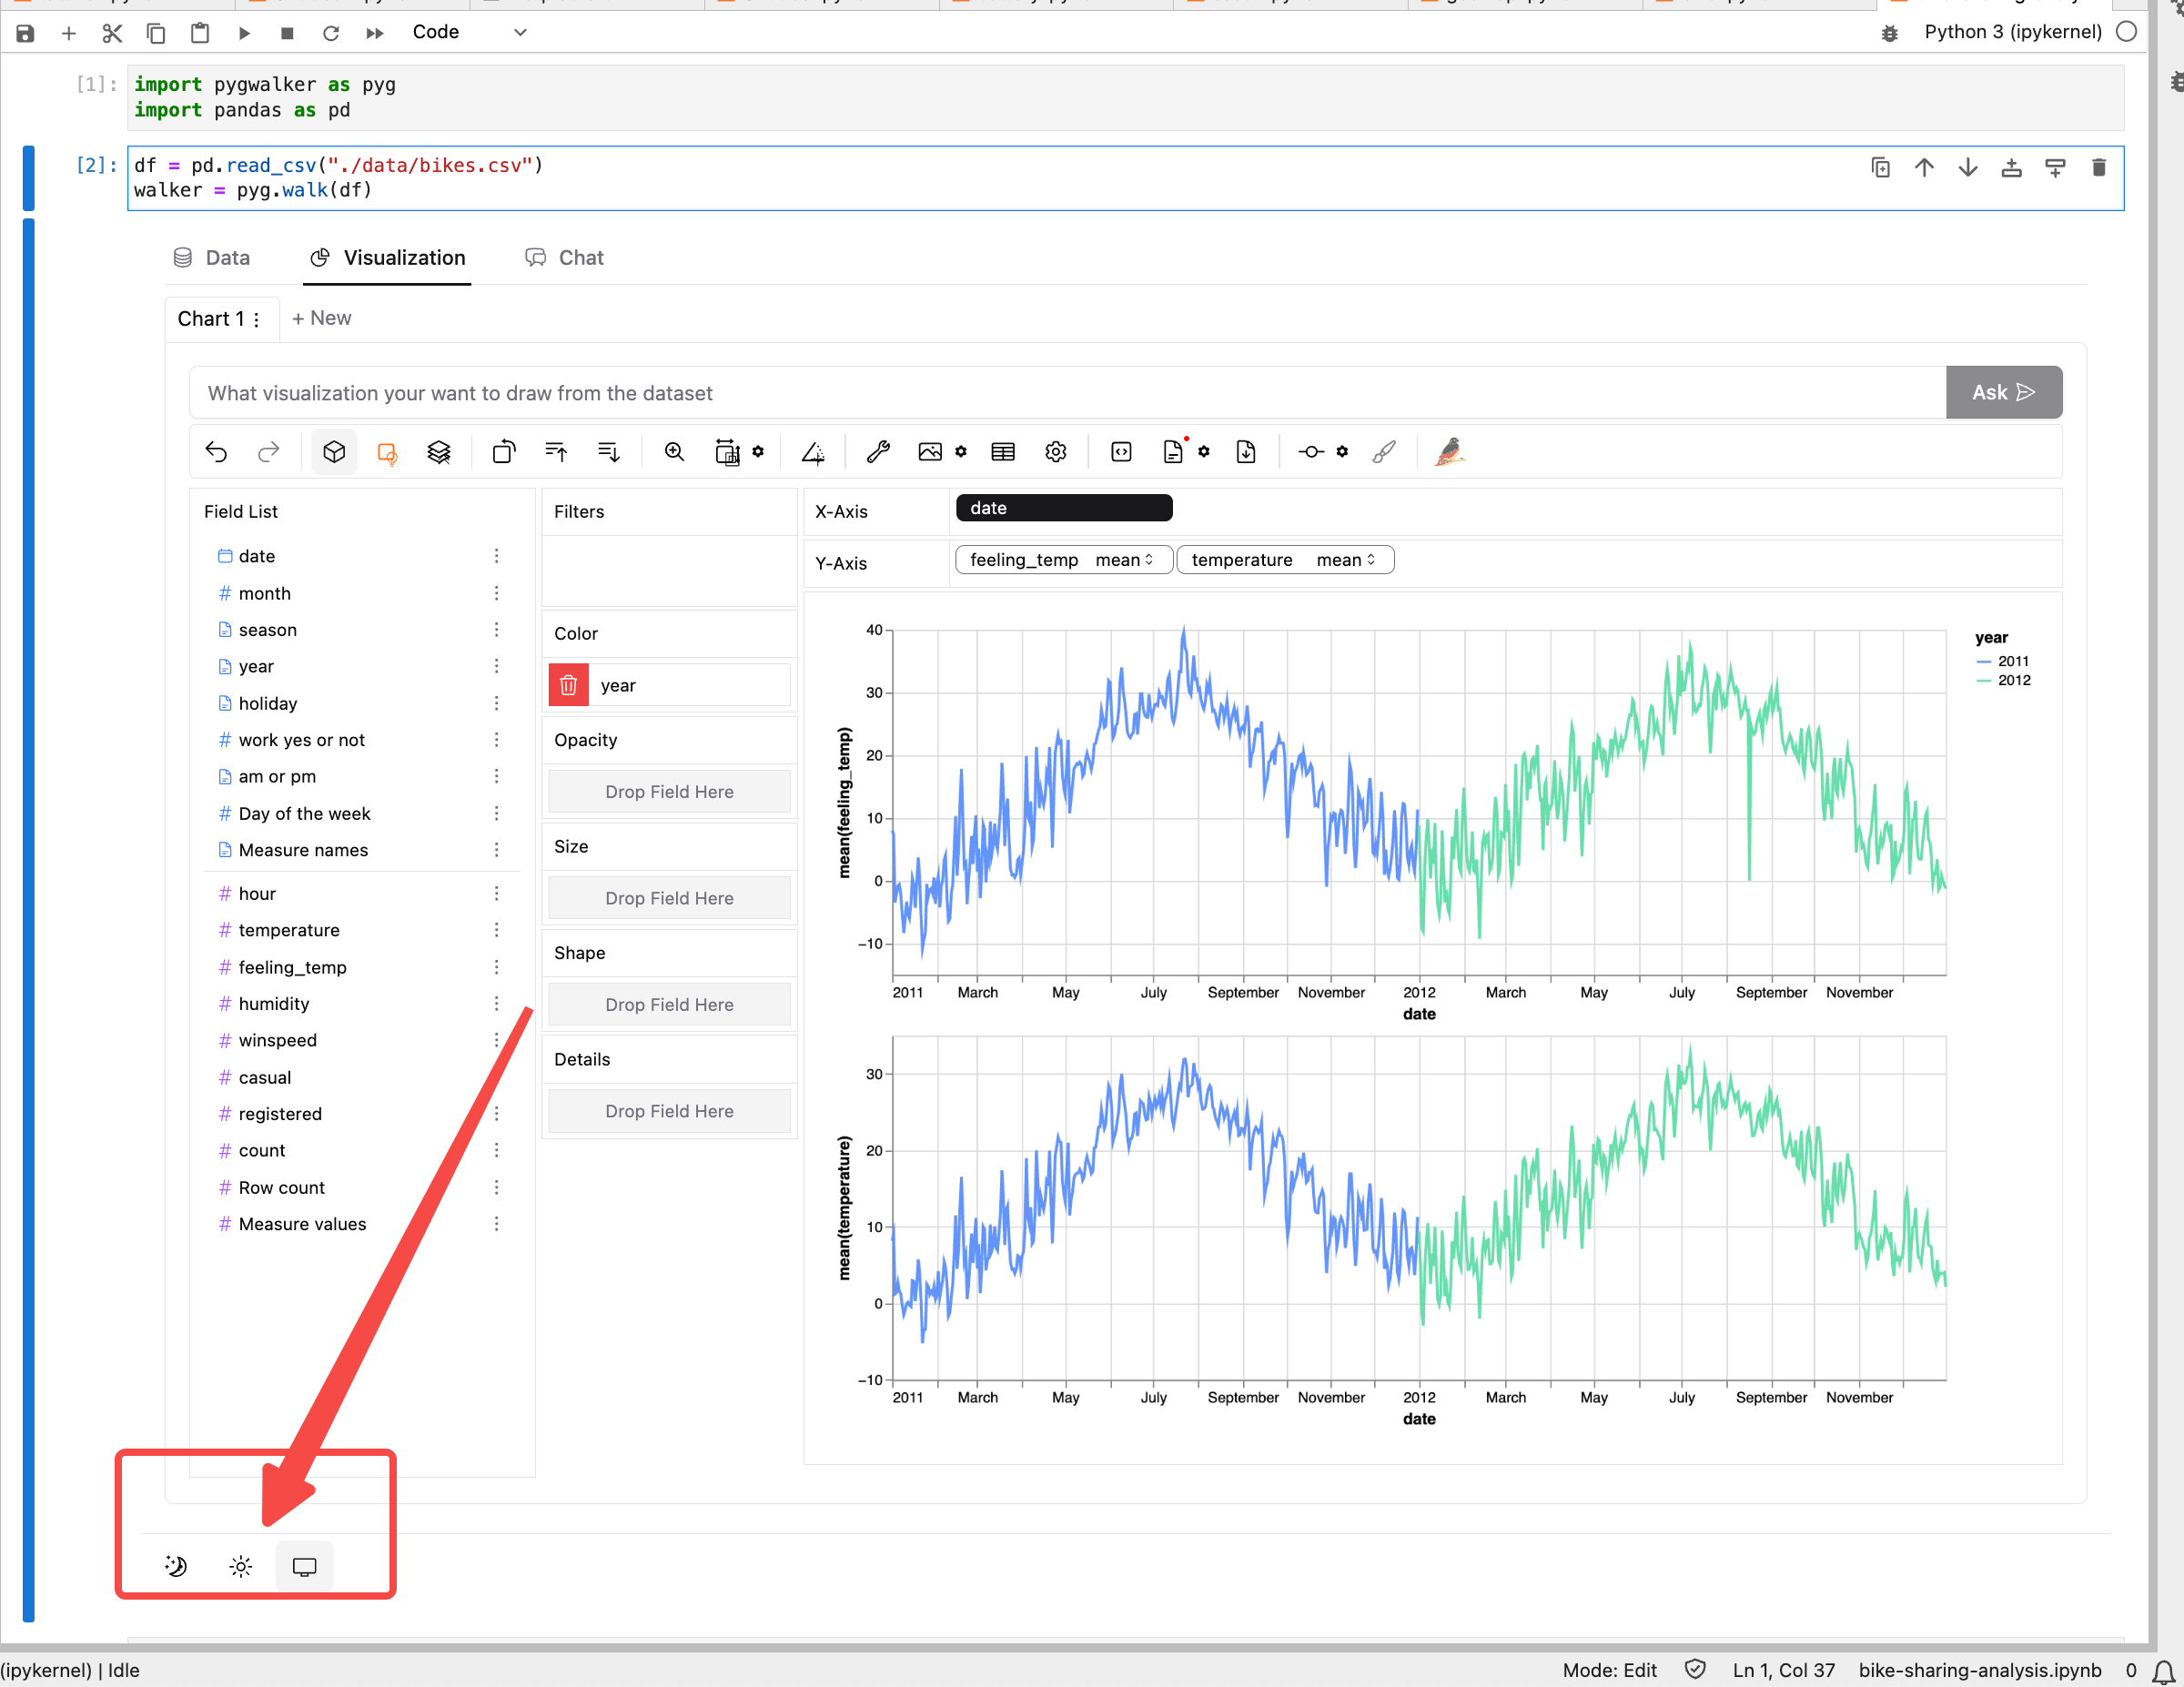
In the bottom of the GUI, you can find the theme switcher, where you can change the theme to dark.

Non Python Users
If you do not want to use python, you can use the web version of PyGWalker (opens in a new tab)

Benefits of Using PyGWalker
PyGWalker not only offers thematic flexibility but also embraces the ethos of open-source software, providing a platform that evolves with its user community. It typically incurs lower costs than proprietary software like Tableau, making it an attractive option for startups and individual professionals. The ability to tweak and extend its features can be a significant advantage for those with specific needs or who enjoy personalizing their tools. Besides, PyGWalker provides AI enhanced features, like chat to visualization, which can help you to create visualizations faster.
Case Studies or User Testimonials
Several users who have transitioned from Tableau to PyGWalker have noted improvements in their workflow, particularly when working in low-light conditions. For instance, a data analyst from a tech startup mentioned, "Switching to PyGWalker was a game changer for our night shifts. The dark mode not only made it easier on the eyes but also helped us focus better on our tasks without the glare."
Conclusion
While Tableau continues to be a powerful tool for data visualization, the lack of a dark mode can be a drawback for many users. PyGWalker offers a compelling alternative, with its customizable interface and user-centric design. By embracing PyGWalker, users can enjoy a more comfortable and personalized data visualization experience.
Call to Action
Ready to try a more visually comfortable data visualization tool? Download PyGWalker today from PyGWalker’s official website (opens in a new tab) and start exploring its customizable themes! Join the community forum to share your experiences or get help customizing PyGWalker to your needs.
This blog aims not only to guide users through the transition from Tableau to PyGWalker but also to foster a community that values user feedback and customization in their data analysis tools.